Introduction
The Massachusetts Black/African American Equity Dashboard offers a comprehensive view of employment-related insights, encompassing demographics, wage discrepancies, foreign-born populations, industry/occupation breakdowns, geographic variations, unemployment rates, labor force participation, and more. For the most recently available 12-month average unemployment and labor force participation rates, see Labor Market Statistics by Demographic.
This dashboard is part of the Department of Economic Research's workforce equity dashboard project, which aggregates Massachusetts-centric employment statistics across diverse demographic, racial, ethnic, and other identifiers. In addition to offering a snapshot of workforce outcomes among various demographic groups and illuminating persistent workforce disparities, these data sets underscore the substantial contributions and diverse talents and needs of Massachusetts' communities. The dashboards also serve as a benchmark to gauge the Commonwealth's progress in advancing equitable career pathways across all sectors of its economy.
The Black/African American workforce dashboard was crafted with input from members of the Black and Latino Legislative Caucus, the Governor’s Advisory Council on Black Empowerment, and the Black Economic Council of Massachusetts, who provided valuable feedback on research approaches and language as well as insight into Black/African American experiences in the Massachusetts labor force.
It should be noted that much of the data utilized in these narratives and dashboards is derived from the American Community Survey, conducted by the United States Census Bureau. For more information, see Definitions and Methodology. Additional Equity Dashboards are available at mass.gov/EquityDashboards.
Analysis & Key Takeaways
Overview
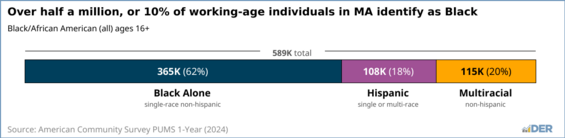
- In 2024, 589,000 working-age people in Massachusetts identified as Black, represented about 10% of the total working-age population. Within this group, 365,000 identified Black or African American alone, while 220,000 identified as Black and Hispanic or Latino, or as multiracial. For more information on race groupings, see Definitions and Methodology.
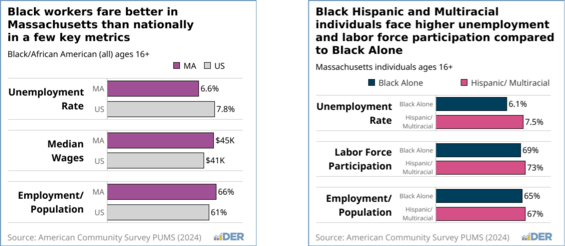
- Compared to Black workers across the United States, Black workers in Massachusetts generally have better job market outcomes. They experienced lower unemployment rates, higher rates of participation in the labor force, and a higher ratio of employment to population.
- In 2024, the unemployment rate for all workers identifying as Black was 6.6%. In 2024, those who identified as Black or African American alone (6.1%) had lower unemployment rates than those who identified as Black and Hispanic/Multiracial (7.5%).
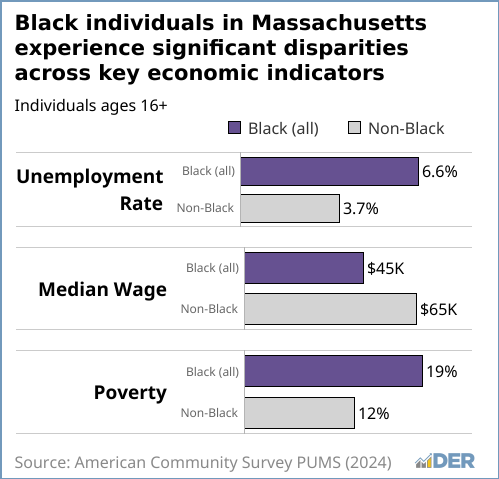
- Differences in job market outcomes are even larger between Black workers and Non-Black workers. In 2024, the unemployment rate for non-Black workers was 3.7%, and for White alone workers, it was 3.3%.
- Fewer than one in three (29%) Black/African American people aged 25+ held a bachelor's degree in 2024, significantly less than the 53% rate of bachelor's attainment among White alone individuals.
- Among those with a bachelor’s degree, Black workers are more likely to be underemployed—working in jobs that do not typically require a bachelor's degree. In 2024, 35% of Black workers with a degree were underemployed, compared to 26% in the White alone population. For more information on Underemployment, see Definitions and Methodology.
Employment
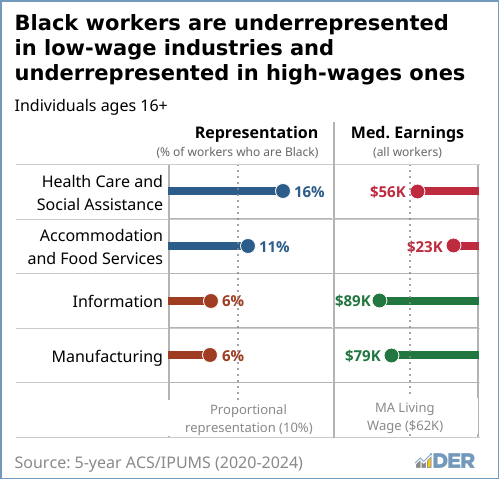
- In Massachusetts, Black/African American workers are more likely to be employed in sectors such as Health Care and Social Assistance and Accommodation and Food Services. Pay in these sectors is often lower than the living wage in Massachusetts.
- Conversely, fewer Black/African American workers are employed in fields that typically offer higher pay, like Information and Manufacturing roles. Pay in these sectors is often higher than the living wage in Massachusetts.
- This trend—more representation in lower-paying sectors and less in higher-paying ones—is seen for both workers identifying solely as Black/African American alone and the wider group including multiracial and Hispanic Black individuals.
Wages and Poverty
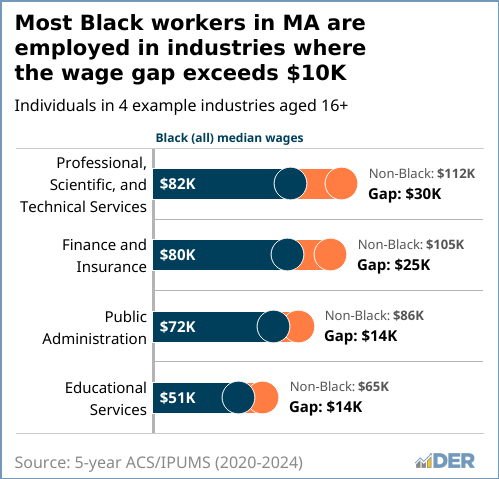
- On average, Black workers in Massachusetts earn significantly less than their non-Black counterparts. For instance, Black workers holding at least a bachelor's degree have a median income of $70,000, which is $20,000 less than the $90,000 median income for White alone workers with the same level of education.
- This pay gap often persists within the same industry. In areas like Professional, Scientific, and Technical Services, as well as Finance and Insurance, the median annual wage difference between Black workers and their non-Black counterparts is more than $20,000.
- These earnings differences may be linked to or associated with higher poverty rates. Around 20% of Black residents in Massachusetts live below the poverty line, compared to about 10% of White residents.
- To explore further wage gap data, see the Earnings tab of the dashboard.
Foreign-Born Population
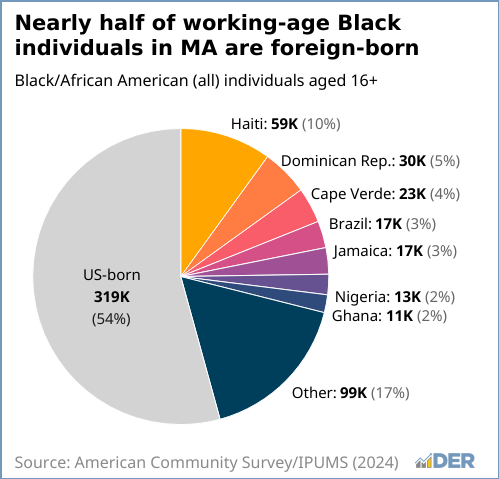
- Massachusetts has one of the most diverse Black populations in the country. In 2024, 45% of working-age Black residents in Massachusetts were born outside the U.S., compared to only 15% nationally. This means a working-age Black person in Massachusetts is almost three times more likely to be foreign-born than a Black person elsewhere in the U.S.
- Similarly, 54% of the 589K residents in MA who identify as Black are U.S. Born.
- As of 2024, the most common country of origin for working-age foreign-born Black individuals in Massachusetts was Haiti, followed by the Dominican Republic, Cape Verde, Brazil and Jamaica.
- In Essex, Worcester, Middlesex, and Plymouth counties, more than half of the working-age Black population was foreign-born in 2024.
- Among working-age Black individuals, 57% of those born outside the U.S. are proficient in English, while 95% of those born in the U.S. are proficient.
Black/African American Equity Dashboard
Explore the Black/African American Equity Dashboard to gain insights into labor market and demographic trends among working-age Black/African American individuals in Massachusetts. This dashboard is largely dependent on the U.S. Census Bureau's American Community Survey (ACS) and Public Use Microdata Sample (PUMS). The dashboard includes multiple categories including Black/African American (All), Black/African American Alone, and Black/African American Hispanic/Multiracial. See Definitions and Methodology for more information.
Dashboard Navigation
- Navigation: The dashboard is structured into three main sections, or tabs, for each area of analysis. You can navigate these sections by clicking the tabs along the top of the dashboard.
- Data Insights: Within each tab are a collection of graphs and insights, containing detailed information and elevating key insights from the relevant data. Refer to the titles, subtitles, and dropdown menus for population segment filters, such as by selecting a different age group, switching between racial and ethnic groups, or selecting different metrics. Hover over the small gray circle with a question mark to learn more about relevant definitions and options throughout the dashboard.
- Interactivity: In addition to the dropdown options, hover over elements of the charts and graphs to see additional details and clarifications on the data.
- Concepts & Data: Visit the Concepts tab for additional context, definitions, and links to the source data. For detailed source information and data download, see Definitions and Methodology.
Definitions & Methodology
Race & Ethnicity - Identifying the Black and African American Population
In the U.S. Census ACS, respondents can identify their ethnicity as either Hispanic/Latino or of Spanish origin, and also select one or more race categories, such as White, Black/African American, or Asian. This survey approach means that there are various combinations of ethnicity and race, which can complicate a question like “How many people identify as Black/African American in Massachusetts?”
Labor market analyses of US Census data often focus on respondents who identify solely as Black/African American without Hispanic ethnicity or multiracial identity (“Black or African American alone”).
U.S Census summary tables on labor market outcomes are only available for the Black or African American alone population, leading to a common analytical focus on this group. However, this approach obscures the experiences of Black Hispanics and multiracial individuals, resulting in an incomplete understanding of the labor market for Black or African American individuals. In this analysis, additional steps are taken by using the U.S. Census Public Use Microdata Sample (PUMS) to explore demographic and labor market outcomes for all individuals who identify as Black or African American, including those who are multiracial or Hispanic.
This is an important distinction. For example, in 2023, there were about 545,000 working-age people in Massachusetts that identified as Black or African American alone, Black and multiracial, or Black and Hispanic or Latino, while 370,000 identified as Black or African American alone. By focusing on the Black or African American alone population that excludes multiracial or Hispanic identities, would leave out less than a third of the total population that identifies as Black.
The dashboard includes functionality to compare the Black population using multiple definitions (when available or appropriate):
- Black/African-American (all): This is the broadest definition, including individuals who identify as Black alone, as well as those who identify as both Black and Hispanic or multiracial.
- Black/African-American Alone: This traditional definition includes only individuals who identify solely as Black or African American, excluding any Hispanic or multiracial identities.
- Black Hispanic/Multiracial: This group includes individuals who identify as both Black Hispanic or Black multiracial, excluding those who identify as Black alone.
For clarity, the sum of the "Black/African American Alone" and "Black Hispanic/Multiracial" populations equals the "Black/African American (All)" population.
In some cases, the dashboard also allows comparisons between Black populations and other racial or ethnic groups, including:
- White (Alone): This is typically defined as individuals who identify as White only, excluding Hispanic and multiracial identities.
- Non-Black: This category includes all individuals who do not identify as Black/African American (All), such as non-Hispanic White, Asian, and other racial or ethnic groups. Together, the Black/African American (All) and Non-Black populations make up the total population considered in this analysis.
Access more information about the question ACS asks on race
Access more information about the question ACS asks on Hispanic origin
Median Annual Wages
Median Annual Wages reflect the median earned income across the entire population, being examined regardless of part-time or full-time status. While this measure does not distinguish between work hours, it captures what a typical worker in a race group earns annually. A higher share of part-time workers may lower the median, but this also highlights potential structural barriers that lead to part-time work instead of full-time employment.
Underemployment
The Black underemployment population is defined as the number of Black workers with a bachelor’s degree who are employed in jobs that typically do not require a bachelor’s degree. For example, a Black worker with a bachelor’s degree who is employed as a customer service representative or office clerk would be considered underemployed in this context, as these jobs are classified by the BLS as typically requiring only a high school diploma to enter.
Unhoused Population
Please note that the data source for this project is the US Census Bureau’s American Community Survey (ACS). According to the American Community Survey Data Handbook, “The ACS collects data from people living in both housing units and GQ (group quarters) facilities.” Unhoused individuals who are not living in group quarters are typically not captured in ACS data and may be underrepresented in the above analysis.
Difference Between Census ACS 1-Year Estimates and 5-Year Estimates
Graphs/charts based on Census ACS data may rely on either 1-year or 5-year estimates.
1-year estimates provide a point-in-time estimate for the population. Yet, because the same size is smaller, there are limitations in using 1-year estimates to calculate statistics for small geographies and sub-populations.
5-year estimates have larger samples that are collected over the 5-year period and are useful for detailed data and can be interpreted as a 5-year average. The advantage offered by the 5-year estimate is that it can be used to calculate statistics for small geographies and sub-populations like the number of Black workers by occupation or industry.
Users should be cautious when comparing data from 5-year estimates to 1-year estimates and consider that 1-year estimates represent a point-in-time while 5-year estimates represent a 5-year average. For more information, view "Understanding and Using ACS Single-Year and Multiyear Estimates."
Data Reference & Download
Download the data sets used in the above resources by clicking the file under 'Additional Resources" below.
Data on populations and labor force participants comes from the U.S. Census American Community Survey (ACS). ACS summary tables and the ACS Public Use Microdata Sample (PUMS) are used to calculate statistics.
The following are the data sources used in the dashboard:
Overview
| Spreadsheet Tab | ACS Source | Time Frame | Population Frame | Description |
|---|---|---|---|---|
| LMI Over Time | IPUMS 1-Year | 2021-2024 | Civ. pop 16+ & 25–54, MA and US | Employment, LFPR & unemployment by race |
| LMI by County (Alone) | Census ACS 1-Year Estimates (Table B23002B & B23002A) | 2024 | Civ. pop 16+ | Employment, LFPR & unemployment by race/counties |
| Poverty (all) | ACS PUMS 1-Year | 2024 | Black (all) population 16+ | Calculate share of Black/African American population in poverty compared to the non-BAA |
| Poverty (Alone) | ACS PUMS 1-Year | 2024 | Black (alone) population 16+ | Calculate share of Black/African American (alone) population in poverty compared to the non-Black/African American (alone) population |
| Population by Occ Ind | ACS PUMS 5-year | 2020-2024 | Wage & salary workers 16+ | Over/under-representation by occupation & industry |
Demographics
| Spreadsheet Tab | ACS Source | Time Frame | Population Frame | Description |
|---|---|---|---|---|
| Population by Age | IPUMS 1-year | 2021-2024 | Total pop 16+ (pop) / total_pop (age) | Total Black/African American population by year |
| Educational Levels | ACS PUMS 1-year | 2024 | Total pop 25+ | Educational attainment for Black/African American & non-Black populations |
| Foreign Born Population (all) | IPUMS 1-year | 2021-2024 | Total pop 16+ | Share of foreign-born Black/African American working age population over time |
| Country of Origin | IPUMS 1-year | 2024. Percentage growth based on 2021-2024. | Total pop 16+ | Top countries of origin for foreign-born Black/African American working age population |
| English Proficiency | IPUMS 1-year | 2024 | Total pop 16+ | English proficiency share among foreign-born Black/African American working age population |
| Foreign Born by County | IPUMS 1-year | 2024 | Total pop 16+ | Share of foreign-born Black/African American working age pop by county |
| Population by County (Alone) | Census ACS 5-Year Estimates (Table DP05) | 2020-2024 | Total alone population | Black/African American (alone) non-Hispanic population |
| Education by County (Alone) | Census ACS 1-Year Estimates (Table B15002A & B15002B) | 2024 | Population 25 years and over | Education for Black/African American (alone) population for select counties |
| Underemployment | ACS PUMS 2024 5-year | 2020-2024 | Civilian non-instit. workers 25+ | Underemployment rate of Black/non-Black workers broad and White alone |
| College Attainment | ACS PUMS 1-Year | 2024 | Population 25 and over | Educational attainment (bachelor’s) for Massachusetts |
Earnings
| Spreadsheet Tab | ACS Source | Time Frame | Population Frame | Description |
|---|---|---|---|---|
| Wages by County (Alone) | Census ACS 5-Year Estimates (Table B19013A & B19013B) | 2020-2024 | All households | Median household income |
| Wages by Occ Ind | ACS PUMS 5-year | 2020-2024 | Civilian wage/salary workers 16+ | Wages for Black/African American (alone) by occupation and by industry |
| Median Individual Earnings | IPUMS 1-year | 2024 | Civilian wage/salary workers 16+ | Median earnings of total and college educated Black/African American, non-Black/African American, and white workers in MA/US (broad and alone) |
Additional Resources
-
Open XLSX file, 124.79 KB, Black/African_American_Equity_Dashboard_Alternative_Data_Tables (English, XLSX 124.79 KB)