Black/African American Equity Dashboard & Insights
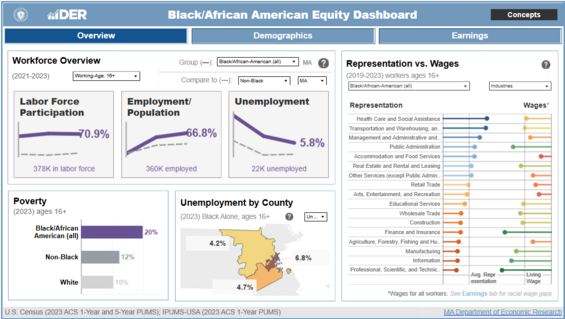
The Black/African American Equity Dashboard provides a comprehensive view of employment-related insights, encompassing key labor market indicators, demographics, industry/occupation information, and more. Use the links below to access the interactive dashboard, written analysis and key insights, definitions and methodology, and downloadable data.
Access the Black/African American Equity Dashboard Page
Access the interactive Black/African American Equity Dashboard
Veterans Equity Dashboard & Insights
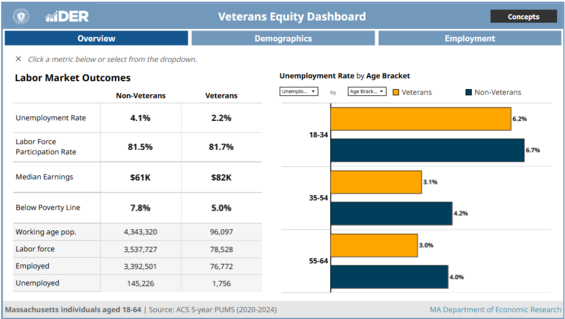
The Veterans Equity Dashboard combines data, visualizations, and analysis to provide an overview of labor market information related to Veterans in the Massachusetts workforce. Covered topics include demographic and geographic breakdowns, differences in unemployment, industry distribution, and more. Access the interactive dashboard, written analysis and key insights, definitions and methodology, and downloadable data using the links below.
People with Disabilities Equity Dashboard & Insights
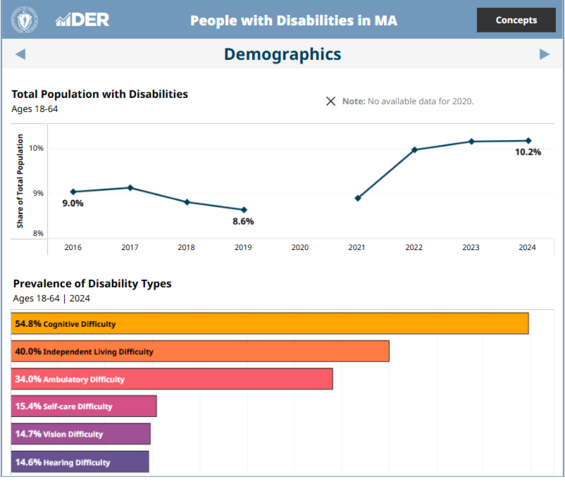
In April 2024, DER has released an interactive People with Disabilities Equity Dashboard featuring data and insights on People with Disabilities in the Massachusetts labor force, with a focus on employment and labor market outcomes. Access the interactive dashboard, written analysis and key insights, definitions and methodology, and downloadable data using the links below.
Access the People with Disabilities Equity Dashboard page
Access the interactive People with Disabilities Equity Dashboard
Equity Dashboard Frequently Asked Questions
Are there plans for additional dashboards such as ones representing Pacific Islanders, Indigenous people, LGBTQ people, and others?
The current Equity Dashboards serve as a starting point and the Department of Economic Research welcomes feedback on how to improve these dashboards and inspire future projects. If you have suggestions about representation for a specific group, please contact DER through this form.
How are race, ethnicity, and sex determined in the statistics used in the Equity Dashboards?
The Equity Dashboards use data from multiple sources, each of which utilizes its own methods for demographic identification. Generally, racial, ethnic, and gender identity are self-reported by survey respondents for that program. More information related to identity from data sources can be found below.
The U.S. Census Bureau includes information on its website about how racial and ethnic groups are defined in Census data. The U.S. Census also provides information on why they ask about race and ethnicity in the American Community Survey and why they ask about sex in the American Community Survey.
Where can I find more labor market data specific to certain demographics?
Additional data by demographic is available through the American Community Survey Data from the US Census Bureau.
Labor Market Statistics by Demographic (12-Month Moving Averages)
The Equity Dashboards mainly rely on data from the U.S. Census Bureau's American Community Survey (ACS). The data used to create the dashboard below comes from a different data source; the U.S. Census Bureau's Current Population Survey (CPS).
Note on 12-month moving averages: The data point for each month in the below dashboard represents the average over the prior 12-months. This is a statistical method used to provide the most accurate representation of trends over time. The data is compiled by DER staff.
- The dashboard defaults to metrics by Race/Ethnicity, click "View by Age/Sex" to view metrics by sex and age group
- Use the "Select Metric" drop down menu to switch between 12-month average unemployment rate, labor force participation rate, employment to population ratio, unemployed population, employed population, and total population in labor force
- Use the sliding bar to select a time period
Other Data Visualizations from the Department of Economic Research
Access a full list of data visualizations available from the Department of Economic Research.
For the latest labor market data, visit mass.gov/EconomicResearch.