Introduction
The Veterans Equity Dashboard combines data, visualizations, and analysis to provide an overview of labor market information related to Veterans in the Massachusetts workforce. Covered topics include demographic and geographic breakdowns, differences in unemployment, industry distribution, and more.
The Department of Economic Research consulted with several agencies and groups to develop the framework for this project, including the Executive Office of Veteran Services, the Office of the Veteran’s Advocate, and MassHire Veteran’s Employment Representatives. Their input was crucial to ensuring the research and analysis considered the lived experiences of Veterans and included topics relevant to improving labor market outcomes for Veterans.
Please note that the data for this project comes mainly from the U.S. Census Bureau American Community Survey. Consequently, the naming conventions describing various demographic groups closely mirrors the terminology used in the survey and does not necessarily align with the naming preferences of the Department of Economic Research or the groups who collaborated on its creation. For more information, please see Definitions and Methodology below. Click here to access other Equity Dashboards from the Department of Economic Research.
Analysis and Key Takeaways
Labor Market Outcomes
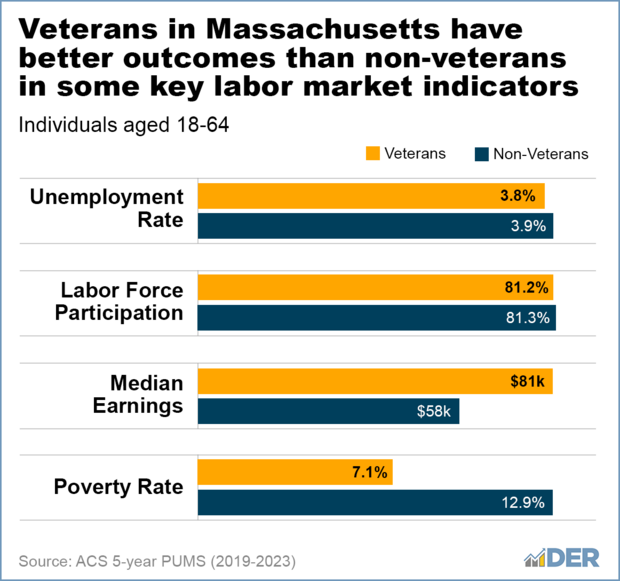
- Veterans generally have similar unemployment rates and labor force participation (except for the oldest age group), higher median incomes, and lower poverty rates compared to non-veterans. These positive outcomes could be attributed to a combination of factors, including the skills and experience gained during service, and veteran-specific employment programs.
- These positive outcomes are observed across different age groups, indicating that the benefits of military service can translate to successful labor market integration throughout a veteran's career.
Demographics
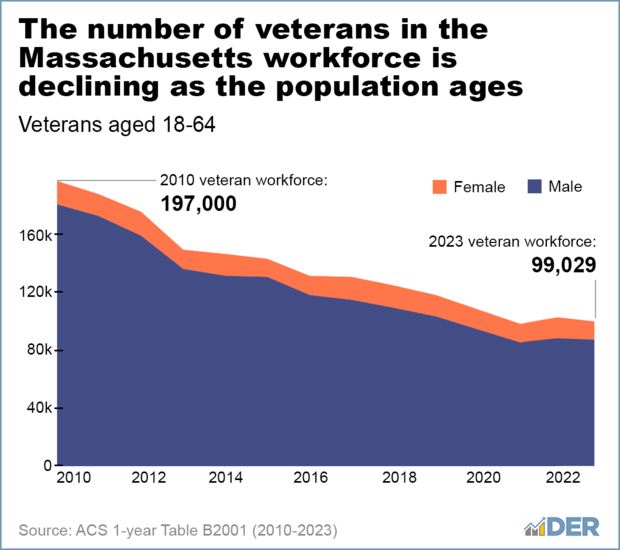
- There were over 230k veterans in Massachusetts as of 2023, and roughly 100k are typical working age (18-64).
- The largest segment of veterans in Massachusetts are aged 35-54, with a declining population overall due to aging and retirement. This reflects national trends as the veteran population from earlier eras ages out.
- The veteran population is disproportionately male, although the female veteran workforce has remained relatively stable in recent years. This aligns with the historical trends in military demographics, with female representation increasing over time.
- While veterans have similar high school diploma attainment rates as non-veterans, they have lower Bachelor's degree attainment but higher Associate's degree or some college attainment. This pattern may be influenced by the fact that military service can provide alternative pathways to career success without necessarily requiring a four-year degree. Additionally, veterans may utilize educational benefits like the GI Bill to pursue shorter-term training or certifications that lead to immediate employment opportunities.
Disabilities
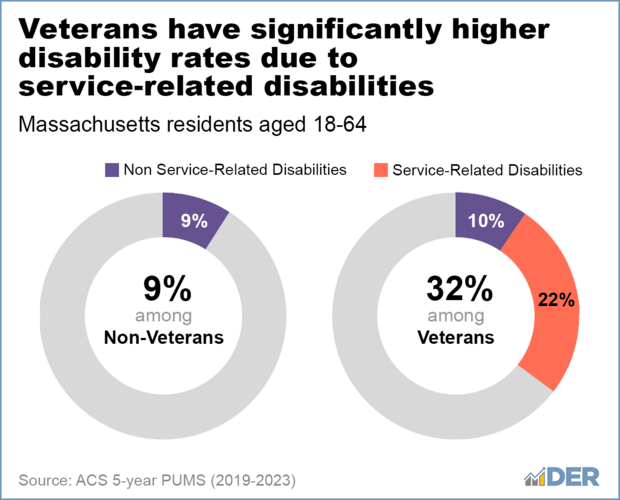
- Veterans have significantly higher disability rates than non-veterans, with a substantial portion being service-related. Service-related disabilities are a direct consequence of the physical and mental demands of military service, including combat exposure and hazardous environments.
Geography
- Veterans are most likely to live in Worcester and Middlesex counties, but are most concentrated in Western, and Southeastern Massachusetts.
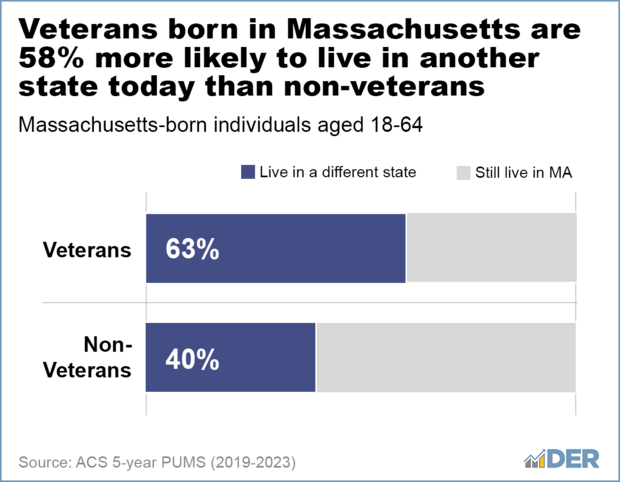
- A larger proportion of Massachusetts-born veterans live in other states compared to Massachusetts-born non-veterans, likely due to military deployments and subsequent settlement. Military careers often involve relocation, and veterans may choose to remain in areas where they established roots during their service or where there are strong veteran communities.
Employment
- Veterans are more likely to be employed in the public sector, particularly in the federal government, in comparison to their non-veteran counterparts. This dynamic likely stems from policies favoring veterans in government recruitment, the applicability of skills honed during military service to public sector positions, and a dedication to continued public service.
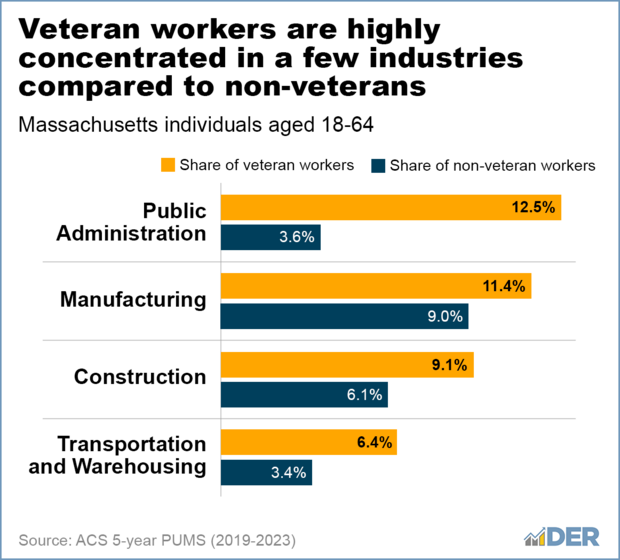
- Veterans are significantly concentrated in sectors such as public administration, manufacturing, construction, and transportation and warehousing. While also represented in sectors like utilities, wholesale trade, and other services, they are less frequently employed in professional, scientific, and technical services, healthcare, and educational services when compared to non-veterans. This distribution may reflect skills acquired during their service, such as logistics, security, and operational expertise, which are highly relevant to these sectors. However, it also raises questions about potential challenges veterans might face in accessing opportunities within other professional domains.
- Veterans tend to have higher median earnings than non-veterans in most occupations and sectors they are employed in, even with lower rates of Bachelor's degree attainment.
Veterans Equity Dashboard
Explore the Veterans Equity Dashboard to gain insights into labor market and demographic trends among working-age veterans in Massachusetts. Hover over charts for detailed explanations of various equity indicators.
Using the Overview tab, browse key workforce indicators by age or by service period using the dropdown menus. Visit the Demographics tab for details including sex, race, geography, education, and disability status of veteran workers. For deeper analysis by occupation, industry, or sector, select the Employment tab.
Additional instructions for navigating the dashboard are below.
Dashboard Navigation
Overview Tab
This section provides quick insights on the statewide labor market to compare veterans with non-veterans across key workforce indicators. For unemployment rate, labor force participation rate, and median earnings, additional breakdowns are available by age bracket (for both veterans and non-veterans) and by service period (for veterans only). To update the visualization, select a metric from the table on the left-hand side of the dashboard, or use the dropdown menu. To switch between age bracket and service period groupings, use the rightmost dropdown menu. Hover for additional details.
Demographics Tab
This tab provides detailed breakdowns of the Massachusetts veteran population compared to the non-veterans across key demographic classifiers, including race and ethnicity, geography, sex, educational attainment, disability rates, and age. For detailed descriptions of each metric, hover over different sections of the relevant chart. To compare the racial/ethnic makeup of veterans vs. non-veterans, use the dropdown menu beside the relevant chart. The regional map can be updated to reflect either a) the percentage of all veterans statewide living in a given county or b) the percentage of the local population made up of veterans.
Employment Tab
Use this tab to explore the occupations, sectors and industries where veterans work. The first dropdown menu determines the sorting order, the second determines whether occupations or industries are presented, and the third dropdown menu determines which metric is charted (explained in the chart below). Data are available for all veterans or for male veterans only.
| Veterans Employment | Total employment of veterans (i.e. "Where do veterans work?") |
|---|---|
| Relative Employment | Relative employment of veterans vs. non-veterans (i.e. "Where are veterans relatively over or under-represented?") |
| Veterans Earnings | Median earnings of veterans (i.e. "In which industries do veterans earn the highest salaries?") |
| Relative Earnings | Relative difference in earnings of veterans vs. non-veterans (i.e. "Where do veterans earn significantly more than their non-veteran peers?") |
To view comparison data for a given industry or occupation, click its name or measures in the chart.
Definitions and Methodology
Veteran Status
The majority of the Veterans Equity Dashboard project relies on data from the U.S. Census Bureau, primarily the American Community Survey (ACS).
The US Census Bureau’s definition of “Veteran” is as follows: "A "civilian veteran" is a person 18 years old or over who has served (even for a short time), but is not now serving, on active duty in the U.S. Army, Navy, Air Force, Marine Corps, or the Coast Guard, or who served in the U.S. Merchant Marine during World War II. People who served in the National Guard or military Reserves are classified as veterans only if they were ever called or ordered to active duty, not counting the 4-6 months for initial training or yearly summer camps. All other civilians 16 years old and over are classified as nonveterans."
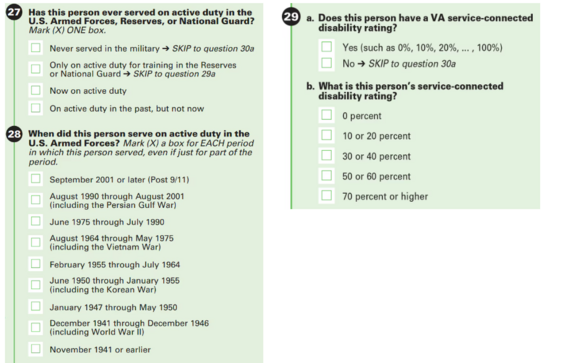
How Veteran-Status related questions appear in the American Community Survey
The American Community Survey asks three questions for respondents to self-identify related to Veteran status:
- Has this person ever served on active duty in the U.S. Armed Forces, Reserves, or National Guard?
- When did this person serve on active duty in the U.S. Armed Forces?
- Does this person have a VA disability rating? What is this person’s service-connected disability rating?
Click here for more information about the questions ACS asks about Veterans
Race/Ethnicity
The U.S. Census Bureau asks one question about race and one question about Hispanic/Latino/Spanish origin. The Veterans Equity Dashboard Project utilizes an inclusive definition of race that includes those who may identify as more than one race. For example, someone who identifies as Black/African American as well as Asian will be counted in both groups.
Click here for more information about the question ACS asks on race
Click here for more information about the question ACS asks on Hispanic origin
Age
When conducting labor market analysis of Veterans, we follow the U.S. Census convention of limiting the analysis to working-age adults between 18-64 years old. There are two main reasons for this:
- People aged 65 and over make up a disproportionately high percentage of Veterans
- Those 65 and older have much lower labor force participation rates (LFPR) largely due to retirement
In summary, people aged 65 and over make up a high percentage of Veterans but have low engagement with the labor force. Limiting the analysis to working-age adults between 18-64 years old allows for a more accurate representation of the employment circumstances for Veterans.
Click here for more information about the question ACS asks on age
Sex
The U.S. Census Bureau asks one question about sex in the American Community survey:
- What is [the respondent’s] sex?
Additional information from the U.S. Census Bureau related to sex: “While often used interchangeably, sex and gender are two distinct concepts. Sex is based on biological attributes of males and females (e.g., chromosomes, anatomy, and hormones), while gender is a social construction whereby a society or culture assigns certain tendencies or behaviors to the concepts of masculinity and femininity... Respondents should respond either "male" or "female" based on how they currently identify their sex.”
Click here for more information about the question ACS asks on sex
Data Reference and Download
Download the data sets used in the above resources by clicking the file under 'Additional Resources" below.
Data on populations and labor force participants comes from the U.S. Census American Community Survey (ACS). ACS summary tables and the ACS Public Use Microdata Sample (PUMS) are used to calculate statistics.
The following are the data sources used in the dashboard:
American Community Survey (ACS) Tables
Overview Section
| Spreadsheet Tab | ACS Source | Time Frame | Population Frame | Description |
|---|---|---|---|---|
| Labor Market Outcomes | ACS 1-year Table B21005 | 2023 | Individuals aged 18-64 | Labor market indicators (LMI) for veterans and non-veterans, including working age population, labor force, employed, unemployed, labor force participation rate, and unemployment rate. |
| Poverty Rates | ACS 5-year PUMS | 2019-2023 (5-year) | Individuals aged 18-64 | Poverty rates for veterans and non-veterans. |
| Outcomes by Service Period | ACS 5-year PUMS | 2019-2023 (5-year) | Individuals aged 18-64 | Differences in LMI metrics (unemployment rate, LFPR, median earnings) between veterans and non-veterans, broken down by service period. |
| Outcomes by Age Bracket | ACS 5-year PUMS | 2019-2023 (5-year) | Individuals aged 18-64 | Labor market indicators (LMI) for veterans and non-veterans across different age groups. |
Demographics Section
| Spreadsheet Tab | ACS Source | Time Frame | Population Frame | Description |
|---|---|---|---|---|
| Educational Attainment | ACS 1-year Table B21003 | 2023 | Individuals aged 25 and older | Educational attainment rates for veterans and non-veterans, including high school diploma, some college or associate's degree, and bachelor's degree. |
| Disability Rates | ACS 5-year PUMS | 2019-2023 (5-year) | Individuals aged 18-64 | Disability rates (including service-connected disability) for veterans and non-veterans. |
| Working-Age Veteran Trends | ACS 1-year Table B21001 | 2010-2023 | Veterans aged 18-64 | Trend of the working-age veteran population by sex over time. |
| Geographic Distribution | ACS 5-year Table B21001 | 2019-2023 (5-year) | Individuals aged 18-64 | Share and total number of veterans in the working-age population by county. |
| Birthplace/Residence | ACS 5-year PUMS | 2019-2023 (5-year) | Individuals aged 18-64 | Migration patterns of veterans and non-veterans, specifically whether they stayed in or moved out of Massachusetts. |
| Race/Ethnicity | ACS 5-year PUMS | 2019-2023 (5-year) | Individuals aged 18-64 | Racial and ethnic composition of veterans and non-veterans. |
Employment Section
| Spreadsheet Tab | ACS Source | Time Frame | Population Frame | Description |
|---|---|---|---|---|
| Employer Types | ACS 5-year PUMS | 2019-2023 (5-year) | Individuals aged 16 and older who are employed | Share of employment by employer type (class of worker) for veterans and non-veterans. |
| Sectors | ACS 5-year PUMS | 2019-2023 (5-year) | Individuals aged 18 and older who are employed | Industry employment and median earnings for veterans and non-veterans. |
| Occupations | ACS 5-year PUMS | 2019-2023 (5-year) | Individuals aged 18 and older who are employed | Occupation employment and median earnings for veterans and non-veterans. |
Additional Resources
-
Open XLSX file, 44.82 KB, Veterans Workforce Equity Data (English, XLSX 44.82 KB)

