Although it seems as if Massachusetts is building homes rapidly, the rate of production is still well below that of past decades. The total number of units grew by 190,300 from 2010 to 2020, an increase of 6.8%. This was largely a continuation of production rates in the 2000s, when the state added 186,300 units. It is far less than the historical rates. From 1950 to 1990, Massachusetts’ housing stock grew its housing stock by 12% to 21% in each decade. This was also the period that produced many units that are still affordable to working families today.
Unfortunately, it is difficult to acquire comprehensive, detailed, and accurate information about most housing production in real time. Building permits are issued by municipal officials in each of the 351 cities and towns of Massachusetts, and there is currently no reliable mechanism for compiling this information in an automated way. The U.S. Census Bureau administers a monthly survey to building officials, seeking information about the number of structures and units permitted. However, municipal responsiveness to this survey is inconsistent. In 2024, 77 municipalities did not provide a single month of data to the Census Bureau. This 22% nonresponse rate matches the average of the past 15 years. Nonresponders include many large cities that are actively permitting large numbers of housing units.
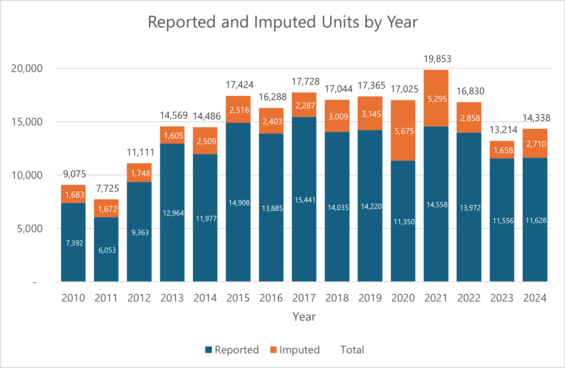
When municipalities do not respond, the Census Bureau attempts to impute missing data based on permitting in prior years. From 2010 to 2019 there were 120,200 units reported, and an additional 22,600 units that were imputed, for a total of 142,800 units. Decennial census counts show that the state added a net 190,300 housing units from 2010 – 2019. This means the reported numbers underestimate total housing unit change by 37%, and the reported and imputed numbers underestimate by 25%.
At the municipal level, EOHLC has found that high levels of imputation can result in over- or-under-estimation of housing production activity as verified by decennial housing unit counts. There were 71 municipalities that reported less than 6 months a year during the decade from 2010 – 2019, resulting in imputed building permit estimates that over- or under-estimated production by an average of 45% when compared to the decennial census counts.
Even when reported regularly, building permit data are available only at the municipal level, and the permit issuance precedes actual occupancy of a building by at least a year, if not more. Furthermore, the Census Bureau does not collect information about demolitions, so building permits for teardowns imply addition of housing even if the net number of units has not increased. This results in overestimation of new production in municipalities with large numbers of replacements.
In 2024, municipalities reported issuing permits for 11,628 units, and the Census bureau imputed another 2,710 units for a total of 14,338. This total is a substantial decline from the peak permitting estimate of 19,853 in 2021. Comparison of the reported numbers shows a much smaller decline from 2021 to 2024, though one that is still worrisome.
Building permit data do provide insight into the type and cost of new homes. From 2013 through 2023, municipalities reported issuing permits for 148,900 units. More than half of those new homes (53%) were in buildings with five or more units. About 40% of those units were single family homes, and only 6% of new units were in two-, three- or four-unit buildings.
In 2023, the reported construction value of the 11,600 units that were permitted was nearly $3.9 billion, or approximately $336,000 per unit. The highest valuation per unit was on the Cape ($606,000 per unit) and Islands ($780,000 per unit on Martha’s Vineyard and $1.6 million on Nantucket). Value per unit was below $300,000 in some regions surrounding Metro Boston (Northern Middlesex, Old Colony, Southeastern MA, Central MA) and in the Pioneer Valley.
Another source of data that has become available recently is the Current Address Count Listing Files produced by the Census Bureau. These files are based on the detailed Master Address File (MAF), a detailed and continuously maintained inventory of every residential address in the country. The MAF is updated biannually based on the latest information from US Postal Service delivery sequence files. Census Bureau staff also review the data to verify the addresses and remove those that no longer exist or which are misclassified (e.g., group quarters addresses listed as housing unit addresses.) Current Address Count Listing Files are provided at a detailed geographic scale (census block) and addresses are added around the time that units become available for occupancy.
The most recent Current Address Count Listing Files were released in July 2025. They indicate that the state has experienced a net increase of 97,700 residential addresses since the 2020 Census, a rate of approximately 18,700 new addresses annually. This statistic indicates that housing deliveries exceed what would be expected based on building permit data, whether reported or imputed. Since Address Count Listing Files are anticipated to be updated twice per year, EOHLC will continue to investigate this dataset and use it for tracking overall housing deliveries moving forward.