The Massachusetts Leading by Example (LBE) portfolio includes over 70 million square feet of buildings, over 539,000 acres of open space, 36,000 miles of roads and highways, and more than 9,400 vehicles. This includes hospitals, college and university campuses, prisons, visitor centers, state parks, roads and tunnels, airports, dams, wastewater treatment facilities, and dozens of other property types.
LBE Executive Order 594 (EO 594) sets targets and requirements that will accelerate the decarbonization of fuels used to heat and cool state facilities and electrify the state fleet, among a number of other directives. This webpage outlines the specific targets and timelines associated with EO 594. Advancement toward these targets is tracked and evaluated annually for state-owned and managed assets.
LBE Progress Dashboard

Download the Leading by Example Progress Dashboard
The LBE Progress Dashboard is a tool that can be used by LBE partners, stakeholders, and the general public to explore state government progress across a wide range of energy and sustainability metrics set forth in Executive Order 594. The objective of the Dashboard is to enhance data transparency, as required by EO 594, and increase accessibility to those interested in state government progress. The Dashboard is broken into various data sections that align with EO 594 directives and targets, each of which is described in the "Introduction" tab.
Download the Leading by Example Progress Dashboard here.
If you have any questions or feedback on the LBE Progress Dashboard, please reach out to Sophia Vitello (Sophia.Vitello@mass.gov).
LBE Progress Snapshot: FY23
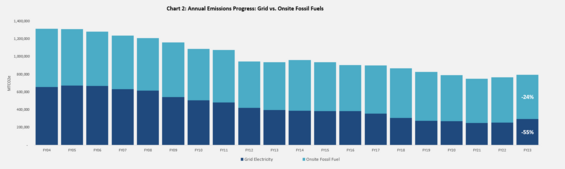
As of FY23, grid electricity emissions have declined 55% since FY04, while onsite fossil fuel emissions have declined 24% over the same time period. Emissions reductions from grid electricity have been driven primarily by the integration of renewable energy resources into the regional grid, helping to drive down grid emission factors year over year, while emissions reductions from onsite fossil fuels have been driven primarily by entity action at state owned facilities.
The LBE Progress Dashboard provides users with an extensive set of graphics and metrics detailing the Commonwealth's (and individual state entity) progress towards achieving the goals of Executive Order 594. This section summarizes the latest data for the key categories tracked by LBE.
Greenhouse Gas Emissions (GHG) - Overall GHG emissions from state government have been reduced by 39% since FY 2004, due in large part to the greening of the grid. State government emissions from onsite fossil fuels have been reduced by 24% since FY 2004, while emissions from grid electricity have been reduced by 55% due to a combination of increased efficiency and the greening of the electric grid.
Energy Use Intensity (EUI) - Since FY 2004, the overall state government portfolio EUI has decreased 12% among the state entities for which LBE tracks this metric.
Fuel Consumption - Through the installation of more efficient systems and technologies and switching to cleaner fuel sources, state facilities have thus far reduced annual heating oil use by 88%.
Zero-Emission Vehicles (ZEVs) - As of November 2024, of the 9,995 covered vehicles (non-emergency response) in the state fleet, 432 are ZEVs (battery-electric or plug-in hybrid), equivalent to ~4.5% of the total state fleet.
EV Charging Stations - As of November 2024, there are 445 EV charging stations at state sites, 91% of which are Level 2, 5% DC Fast Chargers, and the remainder Level 1 stations.
Renewable and Clean Energy Resources - As of November 2024, 72 megawatts of renewable capacity have been installed at state facilities. Solar PV comprises 46% of installed capacity, followed by anaerobic digestion at 27%, and wind and hydro, comprising 15% and 13%, respectively.
LEED Buildings - Of the 103 LEED certifications in the state building portfolio, 63% are at the highest levels of Platinum and Gold, 34% are Silver, and 3% are at the Certified level.
LBE Progress Reports
LBE develops progress reports accounting for progress towards the energy and emissions reduction targets of previous Executive Order 484 and the current Executive Order 594. These reports include descriptive data, graphs, fact sheets, and case studies.
Annual Progress Reports
In addition to the extensive multi-year reports, LBE releases annual fiscal year progress reports to highlight and summarize year-by-year progress towards the targets of the respective LBE Executive Orders. The annual reports can be downloaded here:
| Date published: | September 1, 2023 |
|---|---|
| Last updated: | September 1, 2023 |