Author: Tony Rassias, Bureau of Accounts Deputy Director
PERAC, the Public Employee Retirement Administration Commission, is responsible for oversight, guidance, monitoring and regulation of 99 city, town, county, special purpose district and regional school district public pension systems (municipal systems), and 61 state public pension systems inclusive of the Boston Teachers’ system for purposes of this article.
PERAC has recently published its 2024 Annual Report including important indicators on the financial health of each retirement system. Funded Ratios, Investment Return Assumptions, and Funding Schedules as of January 1, 2025, common fiscal metrics of retirement systems, were reported in our March 20, 2025 City & Town publication and will be updated in a future publication after January 1, 2026 data becomes available.
The purpose of this article is to summarize and compare where possible particular financial indicators taken from PERAC’s 2024 and prior Annual Reports. Except for pension appropriations reported on a fiscal year basis, other reported indicators are based on the system’s last valuation date.
Investment Returns
PERAC’s Executive Director Bill Keefe reported that, “investment returns were strong again in 2024 with a composite return of 9.60% and 98% of boards meeting their actuarially assumed rate of return. Twenty boards are now funded at 90% or better and 70 are at 70% or better.”
| Composite Investment Return Percentages | |||
|---|---|---|---|
| 2024 | 2023 | 2022 | 2021 |
| 9.57 | 11.64 | -10.84 | 19.51 |
Source: PERAC Annual Reports. Natick was not included in the 2022 Report but subsequently reported -11.9.
From 2021 to 2022, all systems showed double-digit percentage-point decreases that ranged from 22.1 to 41.0 with a total median decrease of 30.9. From 2022 to 2023, 105 systems showed double-digit percentage-point increases that ranged from 15.0 in Norwood to 43.9 in Somerville with a total median increase of 22.4. From 2023 to 2024, 98 systems showed percentage-point decreases that ranged from 0.14 in Brockton to 6.41 in Somerville with a total median decrease of 1.97.
Market Value of Investments
It’s reported that state and local government retirement systems as of the first half of 2025 held total long-term investments of $6.2 trillion. Assets are invested in the economy and are therefore subject to volatility. In Massachusetts, each system reports its allocation of assets to PERAC into as many as seven categories: Global Equity, Core Fixed Income, Value Added Fixed Income, Private Equity, Real Estate, Timberland and Portfolio Completion Strategies. Specific investments within each category are not indicated.
| Composite Market Value (in $ billions) | |||
|---|---|---|---|
| 2024 | 2023 | 2022 | 2021 |
| 129.3 | 119.2 | 108.4 | 123.6 |
Source: PERAC Annual Reports. Natick was not included in the 2022 Report but subsequently reported $200.5 million
From 2021 to 2022, all systems decreased from $2.1 million to $4.9 billion for with a total median decrease of $28.9 million. From 2022 to 2023, all systems increased from $900,000 in Minuteman Regional to $3.5 billion in Mass Teachers with a total median increase of $21.0 million. From 2023 to 2024, all systems increased from $800,000 in Minuteman Regional to $3.5 billion in Mass Teachers with a total median increase of $18.2 million.
The Cost of Municipal Pension Assessments
Due to increasing pension costs, government leaders nationwide face fiscal challenges providing necessary governmental services while trying to meet pension obligations. Pension costs rely on three major sources of revenue: investment earnings, employer contribution, and employee contribution.
The Massachusetts municipal pension cost, or employer contribution, is an assessment by the retirement system upon participating local governments and must be provided for in the government’s annual operating budget either by appropriation or without appropriation in the next tax levy. (G.L. c. 32, §22) Retirement systems in other States that do not require such provision may leave them short of their required contribution.
For all 99 Massachusetts municipal systems, the following graph shows recent growth in total reported municipal pension assessments.
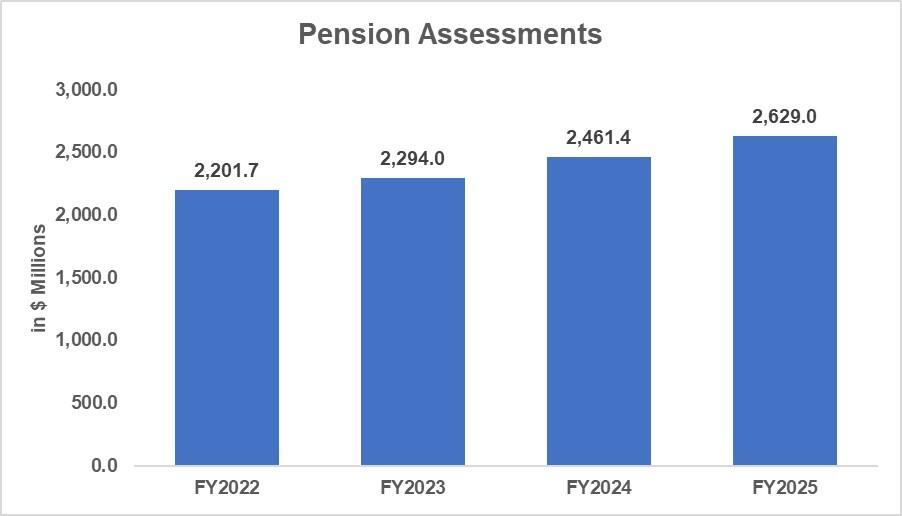
Source: PERAC Annual Reports
From FY2022 to FY2023, the $92.3 million net increase included 92 systems that increased from $32,000 in Minuteman to $38.5 million in Boston, three had no change and four that decreased from $6.4 million in Watertown to $29.1 million in Quincy. From FY2023 to FY2024, the $167.4 million net increase included 93 systems that increased from $36,000 in Minuteman Regional to $35.7 million in Boston, five had no change and Watertown decreased by $1.3 million. From FY2024 to FY2025, the $167.5 million net increase included 91 systems that increased from $52,000 in Blue Hills Voc to $45.0 million in Boston, three had no change and five decreased from $11,000 at Greater Lawrence Sanitary District to $1.3 million in Milton.
The Unfunded Liability
The system’s unfunded liability is another common fiscal metric. Should revenue sources fall short in a system with this liability, other revenues must be increased for the system to be adequately funded or the system’s unfunded liability will grow. A system where the unfunded liability is $0 is said to be “fully funded.”
Projecting future pension costs requires an actuarial look at future demographic and economic events such as investment returns, the number of workers, retirees, life expectancy, wage and benefit growth, inflation, and the value of invested assets.
A system’s unfunded liability is updated with each system’s actuarial valuation to provide an up-to-date assessment of the system’s condition. Otherwise, the liability remains the same until a new valuation is completed. An update, however, does not guarantee a liability reduction.
On an actuarial basis, the nationwide unfunded liability is estimated at over $1 trillion. PERAC annually reports the unfunded liability for all systems. Below is the unfunded liability for the 99 municipal systems.
| The Unfunded Liability for Massachusetts Municipal Retirement Systems (in $ billions) | |||
|---|---|---|---|
| Funding Gap | $ Inc. (Dec.) | % Inc. (Dec.) | |
| 2021 | 17.796 | ||
| 2022 | 15.594 | -2.202 | -12.37 |
| 2023 | 15.217 | -0.377 | -2.42 |
| 2024 | 15.591 | -0.374 | -2.46 |
| 2021 to 2024 | -2.205 | -12.39 | |
Source: PERAC Annual Reports
From FY2021 to FY2022, the $2.2 billion net decrease included 3 systems that increased from $200,000 in Amesbury to $35.3 million in Worcester County, 30 had no change and 66 that decreased from $100,000 in Danvers to $436.8 million in Quincy. From 2022 to 2023, the $376.8 million net decrease included 8 systems that increased from $900,000 in Reading to $54.3 million in Leominster, 64 had no change and 27 decreasing from $600,000 in North Adams to $176.5 million in Andover. From 2023 to 2024, the $374.0 million net increase included 41 systems that increased from $100,000 in Northbridge to $122.8 million in Plymouth County, 31 had no change and 27 decreasing from $100,000 in Newburyport to $100 million in Boston.
Additional Resources and Suggestions
Through their education sessions and publications, PERAC provides recommendations on assumptions, funding strategies, and funding measures retirement systems should employ to better manage their pension obligations.
For further details on funded ratios and unfunded liabilities, view the DLS Municipal Finance Trend Dashboard Unfunded Liabilities Report.
Conclusion
The greatest challenge facing retirement systems going forward continues to be providing benefits to employees while achieving and maintaining full funding. Closely analyzing and monitoring investment positions, listening to professional advice and considering the example of systems well on their way to full funding can help system administrators navigate their system’s pension obligations and help keep their system financially stable.
1 State systems reported in PERAC’s Annual Report include the Mass State Teachers, MWRA, MHFA, Massport and State.
Helpful Resources
City & Town is brought to you by:
Editor: Dan Bertrand
Editorial Board: Tracy Callahan, Sean Cronin, Janie Dretler, Jessica Ferry, Christopher Ketchen, Paula King, Jen McAllister, Brianna Ortiz and Tony Rassias
| Date published: | November 20, 2025 |
|---|