

According to the U.S. Energy Information Administration (EIA), Massachusetts households spend 22 percent more on energy than the U.S. average, paying about $2500/yr, which is slightly less than the six state New England region average.
Background
Total Household Expenditures
Not surprisingly, the region’s higher than average energy use is driven primarily by cooler weather, which pushes up heating costs. The following chart illustrates that Massachusetts heating degree days (HDD, the demand for energy to heat a building) ─ blue bars ─ are greater than the rest of the country, while cooling degree days (CDD, the energy used to cool a home or business) ─ orange line ─ are less.
Heating & Cooling Degree Days-Mass. vs. U.S.
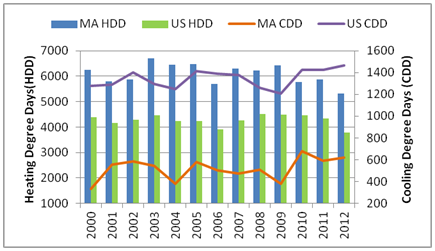
Source: National Oceanic and Atmospheric Administration
In contrast to much of the rest of the country, Massachusetts’ cooler weather makes space heating the largest portion of household energy use (59%), while air conditioning makes up one percent of usage.
Average Household Energy Costs by Type
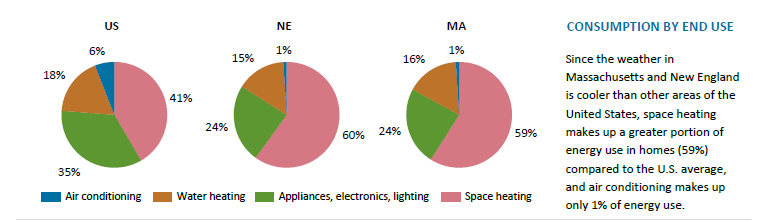
“Other” includes end uses not shown separately (e.g., cooking appliances, clothes washers, dryers, dishwashers, televisions, computers, small electronic devices, pools, hot tubs, and lighting.)
Source: U.S. Energy Information Administration (EIA)