Web Map
Overview

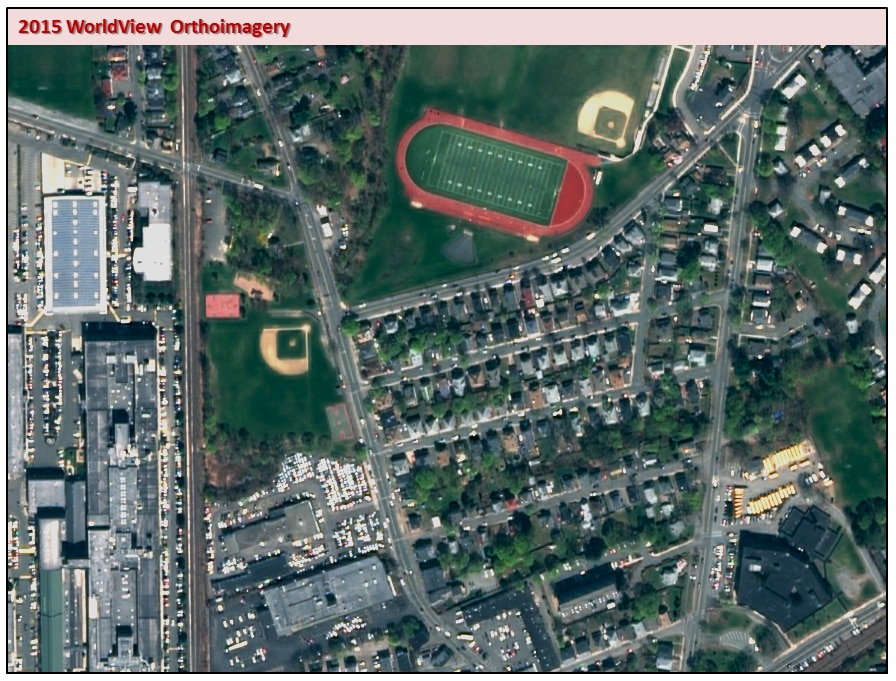
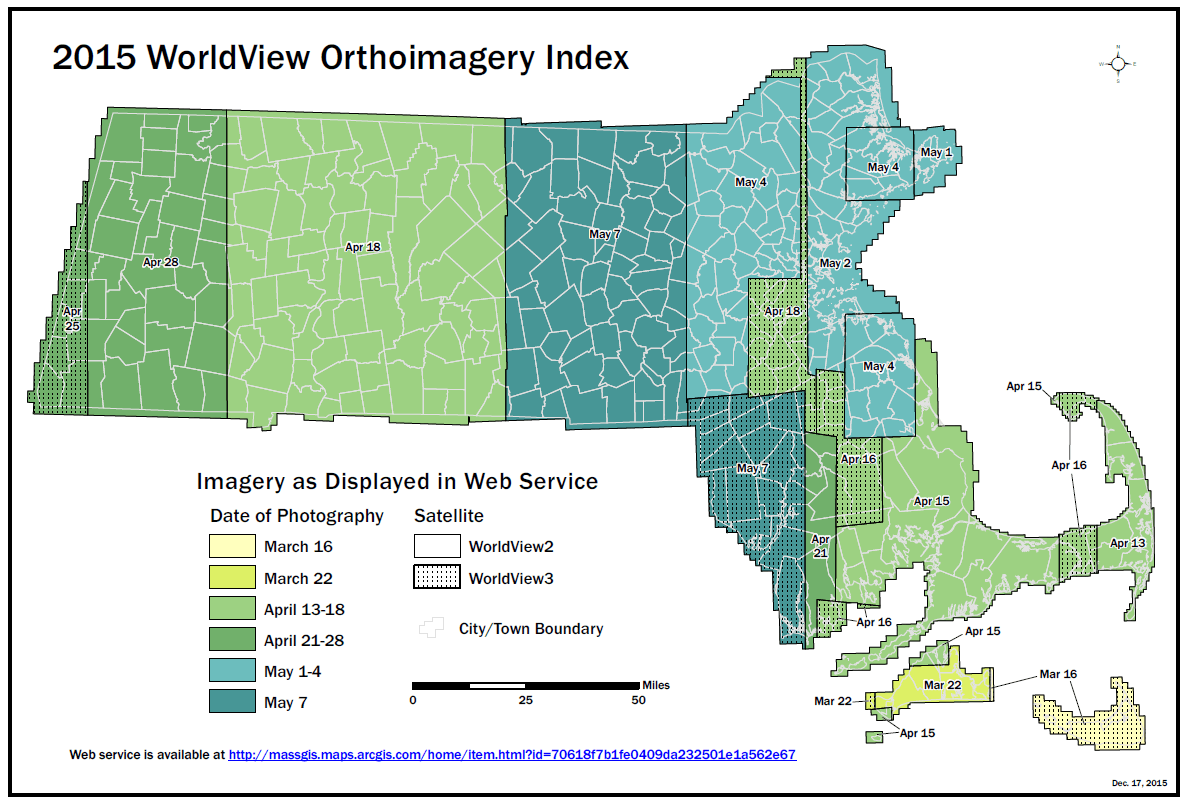
This high resolution imagery of Massachusetts from the spring of 2015 was acquired by DigitalGlobe™ of Longmont, Colorado.
MassGIS had the WorldView-2 and WorldView-3 satellites tasked to collect swaths of panchromatic and multispectral imagery in 43 separate overflights from March 16 - May 7, 2015. WorldView-2 operates at an altitude of 770 km (478 mi.), and WorldView-3 at 617 km (383 mi.).
The pixel resolutions of the delivered data varied due to off-nadir viewing angles and the altitudes of the sensors:
0.46 - 0.73 m panchromatic and 1.87 - 2.94 m multispectral (WorldView-2)
0.40 - 0.46 m panchromatic and 1.60 - 1.83 m multispectral (WorldView-3)

Pixels closest to nadir (the point directly below the sensor) have a better resolution than those farthest from nadir. U.S. regulation requires imagery to be resampled to a minimum of .40 m pan and 1.6m multispectral.
The strips of image data were subdivided and delivered to MassGIS in the form of more than 200 overlapping scenes of "Basic 1B" imagery, DigitalGlobe's least-processed image product. The data were only adjusted to correct for internal sensor geometry and any optical and sensor distortions.
The delivery included Image Support Data composed of spacecraft telemetry and camera model information. This information permitted MassGIS to perform orthorectification and correct geometric distortions so that it appears as though each pixel had been acquired from directly overhead.
Production

MassGIS performed the orthorectification process in ERDAS IMAGINE 2015 using an accurate Digital Surface Model (DSM) as well as the pre-computed rational polynomial coefficient (RPC) models included with the imagery.
MassGIS further pan-sharpened the data to create 4-band multispectral scenes, each with the higher resolution of the corresponding panchromatic image. This was done in ERDAS IMAGINE 2015 using the Hyperspherical Color Space Resolution Merge algorithm developed by DigitalGlobe™ scientists and engineers for WorldView-2 sensor data.
Unlike previous MassGIS imagery products which were typically digitized to 8 bits (256 gray levels) per band, the radiometric response of these data is 11 bit (up to 2,048 levels of gray).
The spectral characteristics of the two satellites are similar in the visible and near-infrared bands (values are nanometers):
| Type | Blue | Green | Red | Near-IR1 |
|---|---|---|---|---|
| WorldView-2 | 442-515 | 506-586 | 624-694 | 765-901 |
| WorldView-3 | 445-517 | 507-586 | 626-696 | 765-899 |
The Projection (Spatial Reference) is Geographic (Latitude/Longitude); Datum is WGS 84. Units are decimal degrees.
Although a maximum cloud cover of 10% was stipulated (not including cloud shadows), Digital Globe collected several frames with up to about 60% clouds in an attempt to fill in obscured portions of other frames.
A small portion of the imagery shows snow on the ground, and there are some ice-covered water bodies.
For internal use, creation of a web service and distribution, MassGIS created a set of Mosaic Datasets in ArcGIS 10.3 that group the orthorectified ERDAS IMAGINE files by strip.
The 2015 Satellite Imagery Index Map contains information on image date, sun azimuth, off-nadir angle and the satellite that captured the data.
Distribution

Public Web Service
Due to licensing issues, data cannot be downloaded or otherwise distributed.
A statewide Web service is available for use by the general public. This cached tile service may be added to ArcMap and other GIS software and applications. The Web service was created in ArcMap 10.3 using the orthorectified imagery in the mosaic datasets and published to a tile package. The package was published as service that is hosted at MassGIS' ArcGIS Online organizational account.
When creating the service in ArcMap, the display settings (stretching, brightness and contrast) were modified individually for each mosaic dataset in order to achieve the best possible uniform appearance across the state; however, because of the different acquisition dates and satellites, seams between strips are visible at smaller scales. With many tiles overlapping from different flights, imagery was displayed so that the best imagery (highest resolution, most cloud-free) appeared "on top".
See the Index Map for details on which imagery (based on acquisition date and satellite) appears in the cached Web service.
Also see the 2015 Satellite Imagery Index data layers.
References
For further information see the following, or contact MassGIS.
- DigitalGlobe Basic Imagery Data Sheet
- DigitalGlobe WorldView-2 Data Sheet
- DigitalGlobe WorldView-3 Data Sheet
* Please note that MassGIS does not have any old aerial photographs (pre-1992).
The MassDOT Survey Section maintains an archive of aerial photographs dating back to the 1930’s