Downloads
Zip files containing:
- statewide data
- summary statistics (PDF and Excel files)
- regional and state PDF maps
- ArcGIS 10.4 layer file (.lyr)
Overview
Environmental Justice populations are the focus of the state's Executive Office of Energy and Environmental Affairs' (EEA) Environmental Justice (EJ) Policy, which establishes EJ as an integral consideration in all EEA programs, to the extent applicable and allowable by law. For more information, please visit EEA's Environmental Justice Web page, which includes a detailed fact sheet as well as text of the full policy.
** Please note: future adjustments to this datalayer may be made as outlined in Chapter 8, Acts of 2021. An Outline Creating a Next Generation Roadmap for Massachusetts Climate Policy.
Polygons in the 2020 Environmental Justice (EJ) Populations layer are 2020 Census block groups across the state that meet one or more of the criteria listed below.
(i) the annual median household income is not more than 65 percent of the statewide annual median household income; (ii) minorities comprise 40 percent or more of the population; (iii) 25 percent or more of households lack English language proficiency; or (iv) minorities comprise 25 percent or more of the population and the annual median household income of the municipality in which the neighborhood is located does not exceed 150 percent of the statewide annual median household income.
The 2020 EJ dataset should be used at the block group (BG) level to ensure that environmental planning and decision-making is done at the appropriate geographic scale. A fact sheet for 2020 EJ, MA EJ 2020 Municipal Statistics.pdf, lists municipalities with EJ BGs and statistics for each of these communities: the number of EJ BGs, the EJ criteria, the percentages of the BGs classified as EJ and the population living in these EJ BGs.
This online Environmental Justice Viewer shows which Census 2020 block groups are classified as EJ populations.
The datalayer is named EJ_POLY.
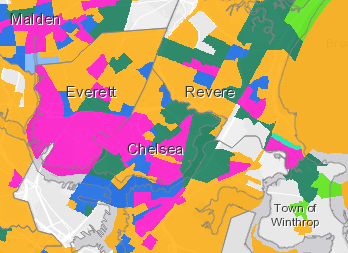
A series of regional maps displaying EJ Block Groups is available, and will provide an overview of the distribution of EJ communities in Massachusetts:
Attributes
The polygon attribute table contains the following fields:
| Field | Description |
|---|---|
| GeographicAreaName | Name of block group, Census tract, county, and state |
| GEOID10 | Geo_ID |
| SPLIT_FOR_MUNI | A flag (Y/N) denoting if the block group has been divided at a town boundary |
| MUNICIPALITY | Municipality name |
| TOTAL_POP | Total population of Block Group (2020 Census counts) |
| NonHispWHITEALONE | Total population of persons identifying as white alone and non-Hispanic/Latino |
| PCT_MINORITY | Percentage of Block Group population identified as minority (persons other than non-Hispanic white) |
| TOTAL_HH | Total number of households (ACS 2016-2020 5-year estimates) |
| LimEngHH | Number of households without a person 14 years of age or older who speaks English ‘very well’. |
| LimEngHHpct | Percent of limited English-speaking households (ACS 2016-2020 5-year estimates) |
| BG_MHHI | Median 2020 household income |
| BG_MHHI_pct_MAHHI | Block group 2020 MHHI as percent of MA 2020 MHHI. |
| BG_MUNI_is_2019 | A flag for when the block group MHHI in the 2016-2020 ACS estimate is blank. In these cases, the block group and state MHHI from the 2015-2019 ACS estimate were used to evaluate the EJ designation. |
| MUNI_MHHI | Municipal 2020 MHHI |
| MUNIMHHI_PCTMAHHI | Municipal 2020 MHHI as percent of MA 2020 MHHI |
| MEDIANHHI | Flag (I) for the income EJ criterion |
| LIMITEDENGLISH | Flag (E) for the limited English household EJ criterion |
| MINORITY_POPULATION | Flag (M) for the minority population EJ criterion |
| EJ | Flag (Yes) for designation as an EJ block group |
| EJ_CRITERIA | EJ criteria (I, E, M) designated for the block group |
| EJ_CRITERIA_CNT | Number of EJ criteria designated for the block group (1-3) |
| EJ_CRIT_DESC | EJ criteria description |
Production
The Environmental Justice layer was produced by designating Census 2020 block groups as an Environmental Justice population using three criteria: Minority population, median household income (of the block group, the municipality of the block and the state), and household English language isolation. Block groups are statistical divisions of census tracts and their boundaries are based on population numbers rather than geographic size, generally between 600 and 3,000 people. Therefore, block groups can vary greatly in size. Where block groups cover more than one town, most often in the western part of the state, the block group has been split along the town boundary and the attributes, with the exception of TOWN_ID, Municipality and MUNI2, have been duplicated in each part of the block group. These polygons are coded ‘Y’ in the split_for_muni field.
Environmental Justice neighborhood, i.e., block groups as defined in Chapter 8 of the Acts of 2021 were evaluated with the 2020 biennial Census population table and American Community Survey 2016-2020 5-year-estimate tables to produce the updated 2020 EJ datalayer, released in November, 2022
Minority population:
2020 Census Redistricting Data: Table P2: Hispanic or Latino, and Not Hispanic or Latino By Race
Median Household Income: (block groups, municipalities and state)
American Community Survey 2020 5-year estimates: Table B19013: Median Household Income in the Past 12 Months (In 2020 Inflation-Adjusted Dollars)
Limited English Households:
American Community Survey 2020 5-year estimates: Table C16002: Household Language by Household Limited English Speaking Status
*Additional data adjustments:
Block groups with a total population of fewer than 50 were removed.
Summary Tables
The summary statistics shown in EJ_2020_CommunitiesStatistics.pdf are also available in an Excel Spreadsheet:
- EJ_2020_municipal_stats.xls – includes statistics for each municipality containing one or more EJ Block Groups: the number of EJ BGs, which EJ criteria are identified in these EJ BGs for the municipality as a whole, the percentages of BGs classified as EJ, and the number of people and percent of the population living in EJ BGs.
Maintenance
EEA GIS is maintaining this layer. Questions may be directed to Dominique Pahlavan at dominique.pahlavan@mass.gov.
In June 2024 EEA GIS made one minor update to fix a block group in Lowell that was misidentified as being in Chelmsford.
| Date published: | June 23, 2021 |
|---|---|
| Last updated: | June 6, 2024 |