Downloads
(3.7 MB)
ESRI shapefile with ArcGIS 10.0 layer file
Overview

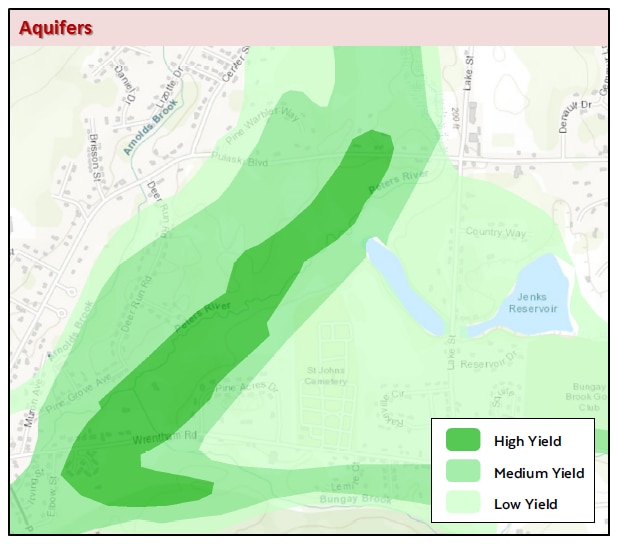
MassGIS produced an aquifer datalayer composed of 20 individual panels, generally based on the boundaries of the major drainage basins. Areas of high, medium and low yield were mapped. The SDE layers contain seamless data from Basin-based tiles and are named AQUIFERS_POLY and AQUIFERS_ARC.
Aquifer polygons were not delineated for Cape Cod and the Elizabeth Islands. These areas in their entirety are considered by the Massachusetts Contingency Plan (MCP) as medium yield aquifers. The areas of Martha's Vineyard and Nantucket not delineated as high yield aquifers are also considered as medium yield under the MCP.
This datalayer NO LONGER includes polygon attribute coding to help in the identification of areas in which clean up of hazardous waste sites must meet drinking water standards, as defined in the Massachusetts Contingency Plan (MCP) (310 CMR 40.0000). Please refer to the DEP NPDWSA Datalayer for areas that are defined as Non Potential Drinking Water Source Areas.
Production
The USGS 1:48,000 hydrologic atlas series on groundwater favorability was produced for all of Massachusetts. The basemaps for these were photographically reduced and spliced together from 1:24,000 USGS quadrangles. Each manuscript covers one of the major drainage basins. They have been individually researched and published by the USGS-WRD starting in the 1960s and continuing to the present. Several have been compiled but not yet published. In these cases the draft manuscripts were automated.
The definition of high and medium yield varies between panels, as it does on the source manuscripts. While the medium yield for most basins is between 100 and 300 gpm (gallons per minute), this range may vary greatly from basin to basin. High yield definitions vary from basin to basin as well.
The high and medium yield categories were automated from the manuscripts. The major drainage basin boundary was copied from the Major Basins layer to use as a template for digitizing. Because ponds and lakes are also closely related to aquifers, they were clipped from water bodies in the 1:100,000 Hydrography datalayer and also used as a template. The USGS manuscripts were not edgematched to adjacent panels; no attempt has been made to resolve interpretation inconsistencies between panels.
Attributes
The arc feature class has one item called OUTLINE. The drainage basin boundary is coded as '1'. All other arcs are coded as '0'.
The polygon feature class has the following items:
| Field name | Description |
|---|---|
| CODE | 0 = Non-aquifer area 1 = Pond 2 = High yield ( > 300 gallons per minute) 3 = Medium yield (100-300 gpm) 4 = Low yield ( < 50 gpm) |
| TYPE | Character values the equivalent to the CODE item (POND, HIGH, MED, LOW) |
| YIELD | Yield in gallons per minute for the aquifer classes |
| TRANS | Transmissivity in square feet per day |
| AREA_SQ_FT | Area in square feet of each polygon |
| AREA_ACRES | Area in acres of each polygon |
| BAS_ID | Major basin ID |
| PANEL | Original basin panel, used to identify source of aquifer data |
Displaying the data
To properly portray the aquifers with full statewide coverage, users should refer to the image above. This image displays the Aquifers layer symbolized on CODE or TYPE. If the display of NPDWSA is desired, see the "Displaying the Data" section in Massachusetts Contingency Plan (MCP) (310 CMR 40.0000). Please refer to the Non-Potential Drinking Water Source Areas layer.
Maintenance
This datalayer is maintained by MassDEP. In June 2003, the DEP GIS group modified all tiles to remove the NPDWSA designations. In July 2007, the boundaries of two polygons in the town of Colrain were modified.