Downloads
Overview

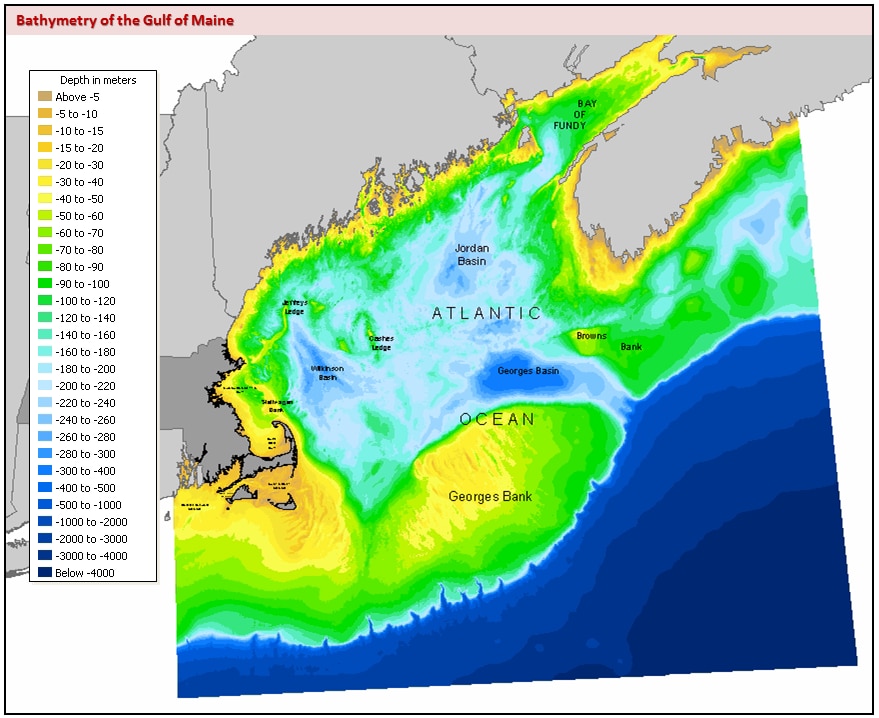
This datalayer represents seafloor topography for the Gulf of Maine, extending from the Bay of Fundy south of New Brunswick to the Continental Shelf southeast of Nantucket. The linework in this layer came from an ArcInfo bathymetric contour coverage available through the U.S. Geological Survey's Coastal and Marine Geologic and Environmental Research program, part of its Woods Hole Field Center. MassGIS assembled the data into two ArcSDE layers, BATHYMGM_POLY and BATHYMGM_ARC. An annotation layer in ArcSDE is named BATHYMGM_ANNO_NAME.
Manuscript
The USGS collected data from available sources on the Web and from CD-ROM products. The data included digital sounding data, digitized contour line data and previously gridded products from a variety of sources. Specifically, seven datasets were incorporated to produce a final 15 second grid product:
- NOAA Hydrographic Survey Data and NGDC Marine Trackline Geophysics Data - hydrographic surveys completed between 1930 and 1965, and from survey data acquired digitally on NOS survey vessels since 1965. The data is extremely dense in many regions (greater than 0.5 km resolution), but there are large gaps in the coverage due to surveys currently in non-digital form.
- Naval Oceanographic Office DBDB-V gridded bathymetry - crucial coverage in the interior of the Gulf and in Canadian waters, constructed from a variety of public and classified source data.
- Supplemental Datasets from Bedford Institute of Oceanography and Brookhaven National Laboratory - filled gaps in the interior of the Gulf between the NOSDB data and the DBDB-V data as well as providing coverage of the Scotian Shelf and gaps on the eastern flank of Georges Bank.
- NOAA Medium resolution digital Shoreline and DMA World Vector Shoreline - 1:80,000 US shoreline created by the Strategic Environmental Assessments Division of NOAA's Office of Ocean Resources, Conservation and Assessment. The DMA's World Vector Shoreline (WVS) is suitable for scales close to 1:250,000.
- Defense Mapping Agency ETOPO5 Digital relief of the Surface of the Earth - generated from a digital data base of land and seafloor elevations on a 5-minute latitude/longitude grid. The original source of the data in the ocean areas in ETOPO5 is from the U.S. Naval Oceanographic Office.
- GEBCO General Bathymetric Chart of the Oceans - Digitized bathymetry for the World Ocean at a scale varying from 1:10 million to 1:500,000 depending on data density. GEBCO bathymetry is available from the British Oceanographic Center on behalf of the International Hydrographic Organization.
- USGS North American 30 arc-second Digital Elevation Model (DEM), used for land values. MassGIS removed this land data; the BATHYMGM layer contains topography for offshore areas only.
- Bathymetry contour lines were then generated at the following intervals, in meters below sea level, from the 15 second grid: -4000, -3000, -2000, -1000, -500, -400, -300, -280, -260, -240, -220, -200, -180, -160,-140, -120, -100, -90, -80, -70, -60, -50, -40, -30, -20, -15, -10, -5
Production
MassGIS processed the bathymetry linework coverage to remove dangles and intersection errors and to create polygon topology. With Arc Macro Language (AML), each polygon was coded for a range of depth below sea level in meters, based on the values of the lines' CONTOUR item. Additionally, the mainland areas were "sealed off" to create an inland polygon coded with the range "Above -5." Because there was no zero contour or coastline in the original USGS dataset, this inland polygon represents the shallowest of sea floor topography. When displaying this layer it is important to draw land features atop the bathymetry; the coastline included in land feature will serve as the zero contour and the area just offshore will appear as the -5 to 0 range
Attributes
The polygon layer attribute table has the following attributes associated with each polygon:
| Field name | Description |
|---|---|
| HIGH | The highest (closest to surface) depth, in meters |
| LOW | The lowest (farthest from surface) depth, in meters |
| DEPTHRANGE | The range of values, from the HIGH value to LOW |
| DEPTHCODE | A numeric code based on the DEPTHRANGE value. See following table: |
| DEPTHRANGE | DEPTHCODE |
|---|---|
| Above -5 | 1 |
| -5 TO -10 | 2 |
| -10 TO -15 | 3 |
| -15 TO -20 | 4 |
| -20 TO -30 | 5 |
| -30 TO -40 | 6 |
| -40 TO -50 | 7 |
| -50 TO -60 | 8 |
| -60 TO -70 | 9 |
| -70 TO -80 | 10 |
| -80 TO -90 | 11 |
| -90 TO -100 | 12 |
| -100 TO -120 | 13 |
| -120 TO -140 | 14 |
| -140 TO -160 | 15 |
| -160 TO -180 | 16 |
| -180 TO -200 | 17 |
| -200 TO -220 | 18 |
| -220 TO -240 | 19 |
| -240 TO -260 | 20 |
| -260 TO -280 | 21 |
| -280 TO -300 | 22 |
| -300 TO -400 | 23 |
| -400 TO -500 | 24 |
| -500 TO -1000 | 25 |
| -1000 TO -2000 | 26 |
| -2000 TO -3000 | 27 |
| -3000 TO -4000 | 28 |
| Below -4000 | 29 |
The arc layer attribute table has the following attributes:
| Field name | Description |
|---|---|
| CONTOUR | Depth below sea level, in meters |
This layer also contains three levels of annotation, subclass NAME, for some offshore features.
Maintenance
MassGIS is maintaining this datalayer.
Also see a more generalized and less extensive offshore bathymetry polygon layer developed by Mass. Coastal Zone Management, Offshore Bathymetry (1:250,000).