Downloads
Overview
Seagrass, a form of Submerged Aquatic Vegetation (SAV), serves as important fish and wildlife habitat and assists with storage and recycling of nutrients and the stabilization of sediments. The predominant seagrass found in Massachusetts coastal waters is eelgrass (Zostera marina). The Massachusetts Department of Environmental Protection (MassDEP) began surveying seagrass in the early 1990s and the MassDEP Eelgrass Mapping Project has produced multiple phases of seagrass mapping along the Massachusetts coastline.
The Phase 4 mapping in this layer covered these areas:
- 2010 - South Shore of Cape Cod: Woods Hole to Chatham, selected embayments, Pleasant Bay
- 2012 - North Shore, Boston Harbor, South Shore to Provincetown
- 2013 - Buzzards Bay, Elizabeth Islands, Martha's Vineyard and Nantucket
The layer is named EELGRASS2010_13_POLY. This combines features from and supersedes EELGRASS2010_POLY, EELGRASS2012_POLY and EELGRASS2013_POLY.
Production
Image Acquisition
Digital imagery was acquired in late spring during 2010, 2012 and 2013 through a contract with GeoVantage Corporation (Peabody, MA). Imagery was collected using M1 multispectral aerial imaging sensors. Splayed 5184 pixel X 3456 pixel single frames were acquired using two sensors in a direct digital manner combined into 10000 pixel X 3456 pixel single frames. Each M1 sensor has an integrated inertial measurement unit (IMU) to record sensor attitude while collecting frame nadirs with an integrated airborne GPS. Positional data are refined and optimized utilizing multiple sets of Continuously Operating Reference Station (CORS) base station data. Aeroptic proprietary geoimage post-processing application was used to process the individual single frames into orthophoto mosaics rectified to 7.5 min Digital Elevation Model (DEM) grids at 1 arc-sec (~30m) resolution. Data collection times were selected to optimize conditions for viewing nearshore benthic habitat including: tidal stage, season, wind, cloud cover/shadow, sun elevation, and precipitation timing.
Image Rectification
Mosaics were generated from orthorectified single frames corrected to USGS 1 arc-sec DEM using multiple CORS stations to control airborne GPS and IMU data. In order to maximize spatial accuracy, all data collected went through the following process: Navigation solution - processed GPS and CORS data to plot coordinates of single frame nadirs for mosaic generation. If navigation solution residuals were in excess of an error tolerance of +/- 1.5m in any of the three axes of rotation, data were reprocessed following a systematic series of quantitative adjustments to processing parameters including the following: incremental manipulation of the GPS elevation mask (usually sufficient), blocking and/or substitution of corrupt or confounding CORS data, blocking data from specific individual satellites from the solution, and/or truncation of full mission time. If, after iterating through each of the preceding systematic quantitative adjustments, the navigation solution failed to return residuals within tolerance, the target was submitted for recapture. Mosaic Generation produced using proprietary GeoImage software which projected single frames to DEM of 1 arc-sec resolution. Single frames were inspected for uniquely identifiable coincident tie points by which to mosaic to adjacent frames.
Image Interpretation and Field Verification Work
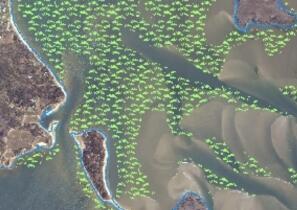
Polygons of seagrass were hand digitized on-screen using ESRI ArcGIS Desktop software. Much of the MA coast has a sandy substrate providing a useful color contrast to map the darker seagrass photo-signatures. Nonetheless, there are still uncertainties with signature interpretation that required field verification. Extensive fieldwork was conducted to develop a quantitative understanding of the signatures and gather surface level data where the presence or extent of habitat was not apparent. The fieldwork methods and ground-truthing protocols were similar for this project as were used in the previous coast-wide eelgrass mapping surveys (1995, 2001). Questionable points in the interpreted data were investigated using a small boat equipped with underwater videography, high resolution acoustics and DGPS (1 meter accuracy). These fieldpoints (2010- 947 pts, 2012-701 pts, 2013-852 pts) were logged into the on-board digital database and later used in the laboratory for final data interpretation.
Attributes
The attribute fields for this layer are:
| Field | Type | Value(s) |
|---|---|---|
| YEAR | Char | Years of delineation (2010, 2012, 2013) |
| HABITAT | Char | Seagrass type (Eelgrass) |
| AREA_ACRES | Float | Area of SAV feature in acres |
| AREA_M | Float | Area of SAV feature in meters |
Maintenance
This layer is maintained by the MassDEP Wetlands Program.
Learn more about the MassDEP Eelgrass Mapping Project.
Also see an overview of all GIS data layers in the MassDEP Eelgrass Mapping Project.