Call Volume:
Historical trends over the past five years, call volume to the PCC has stayed stable with a slight increase in calls during 2019 and 2020. There is a constant drop in calls in 2020, 2021 and 2022 since 2019.
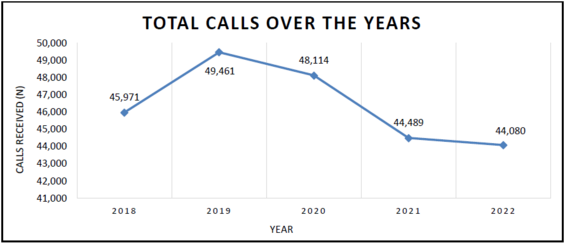
Line graph depicting total calls to MA & RI poison center from 2018 to 2022. There is a constant drop in calls in 2020, 2021 and 2022 since 2019.
Exposure Calls:
Over the past five years (2018-2022), the PCC has received 193,021 exposure calls from MA and RI. Call volume has been stable over the past five years, but there was a small increase in calls from 2019 to 2020.
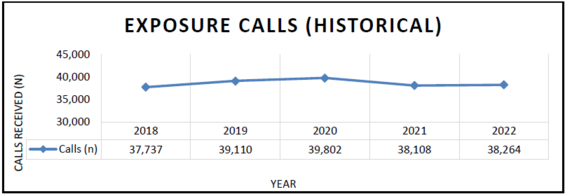
Over the past five years (2018-2022), the PCC has received 193,021 exposure calls from MA and RI. Call volume has been stable over the past five years, but there was a small increase in calls from 2019 to 2020.
What are the reasons for poisoning?
Overall Reasons:
Poisoning happens for a multitude of reasons. Most exposure calls to the PCC were unintentional (81.24%), with a small percentage of poisonings being intentional (16.34%) or due to adverse reactions (1.38%).
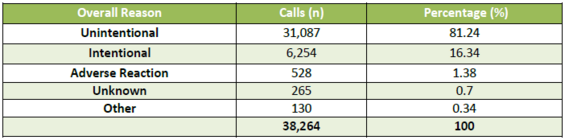
A table displaying the reasons for poison exposure. Most exposure calls were unintentional at 81.24%. A small percentage of poisonings being intentional (16.34%) or due to reactions (1.38%)
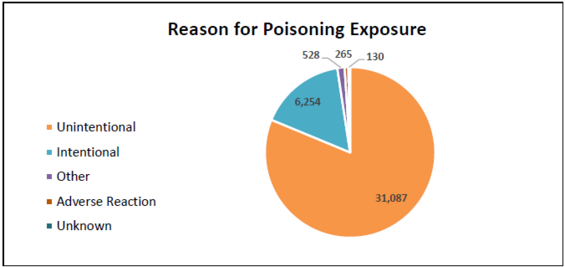
A pie chart displaying the reasons for poison exposure. Most exposure calls were unintentional at 81.24%. A small percentage of poisonings being intentional (16.34%) or due to reactions (1.38%)
Information Calls:
Over the past five years (2018 through 2022), the PCC has received 22,234 information calls. The highest number of information calls were received in 2019 and the lowest number of information calls were received in 2022.
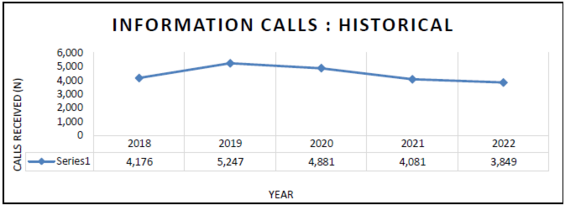
Line graph depicting the number of information calls the MA & RI Poison Center has received from 2018 through 2022. There has been a total of 22,234 information calls.
Additional information
- Regional Poison Center Annual Reports
- MA and RI Annual Reports
- American Association of Poison Control Centers (AAPCC) Annual Reports
- AAPCC Annual Reports and Data Snapshots from 1999
- Drug and Overdose Poisoning Data from the Massachusetts Department of Public Health
- Massachusetts Drug and Overdose Poisoning Data Reports