Introduction
The Regional Occupation Alignment Dashboard (ROAD) is designed to help state and regional leaders in workforce development, education, and policy make data-driven decisions about workforce training and education. The dashboard identifies high-demand, high-wage occupations and highlights how local education and training programs align with projected job openings across Massachusetts and its workforce regions.
ROAD uses occupational projections and wage data, as well as graduate data from the Integrated Postsecondary Education Data System (IPEDS). Future updates to this tool are planned to include data from Career Technical Education (CTE), non-credit, and alternative training pathways. For more information, see Data Sources & Methodology.
ROAD provides a starting point for understanding potential gaps in a region's workforce supply, and workforce leaders should consider additional information and perspectives - including employer input, alternative supply pipelines, and other data - to assess workforce supply and demand. Read below to learn about ROAD’s key features - the Opportunity Star System and Training Pipeline Alignment – and how these features can be used to analyze occupations in different regions.
For the latest available labor market data, including unemployment rates and payroll job counts, visit the Department of Economic Research.
Understanding the Opportunity Star System
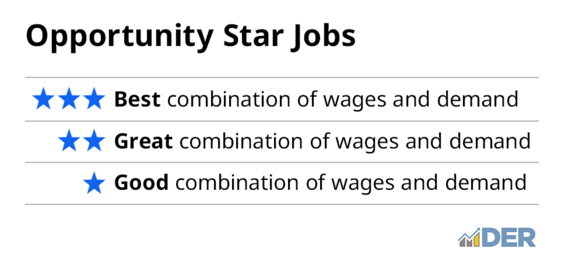
The Opportunity Star System is a three-star rating that pinpoints occupations with strong combinations of projected employment growth, annual openings, and high wages in a particular geography. Opportunity Stars signal jobs that are projected to have high long-term demand and pay good wages for workers. They are prime targets for investment in workforce development and educational programs.
Opportunity Stars prioritize both demand and wages, relative to other jobs in the same region. Many jobs that are in high demand and are essential to the economy (e.g., nursing assistants) may not receive a star due to lower wages. In these cases, workforce leaders should consider if a job serves as a viable stepping-stone on a career pathway toward an Opportunity Star occupation. For more details on how Opportunity Stars are assigned, see the ROAD Methodology.
Related Resources
-
Open PDF file, 451.54 KB, ROAD Methodology (English, PDF 451.54 KB)
-
Open PDF file, 817.64 KB, ROAD User Guide (English, PDF 817.64 KB)
Understanding Training Pipeline Alignment
The Training Pipeline Alignment feature compares the projected number of annual job openings to the number of annual graduates from local institutions likely to work in that occupation based on their field of study and other local job options. This feature is available for statewide and Workforce Skills Cabinet (WSC) geographies.
Balanced indicates that the number of annual graduates is within 15% of the annual openings for a selected occupation and geography.
Gap indicates that the number of annual graduates is less than the number of annual openings for a selected occupation and geography, by at least 15%.
Overflow indicates that the number of annual graduates is greater than the number of annual openings for a selected occupation and geography, by at least 15%.
For more details on how training pipeline alignment is calculated, see ROAD Methodology.
Related Resources
-
Open PDF file, 451.54 KB, ROAD Methodology (English, PDF 451.54 KB)
-
Open PDF file, 817.64 KB, ROAD User Guide (English, PDF 817.64 KB)
Combining ROAD with Local Knowledge & Regional Context
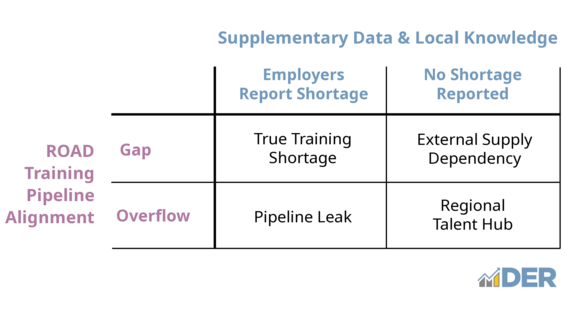
It is important to note that training pipelines are just one component of labor supply. This data should be combined with local knowledge and other sources to develop a more complete picture of the workforce. A “Gap” between the regional training pipeline and projected openings does not necessarily indicate a workforce shortage if employers do not report difficulty filling or retaining positions. For a detailed overview of common scenarios and follow-up questions for workforce leaders, see ROAD User Guide.
For a detailed overview of common scenarios and follow-up questions for consideration, see ROAD User Guide.
True Training Shortage: Local training infrastructure is not producing enough graduates to fill openings, and employers are not attracting enough workers to the region.
External Supply Dependency: Employer demand is met by “importing” workers trained in other regions, including residents who leave the area for training and return home to work.
Pipeline Leak: Graduates of local institutions who could fill open positions are either leaving the region or experiencing barriers to employment.
Regional Talent Hub: Local demand is satisfied and, in cases of significant overflow, graduates from local institutions are typically “exported” to other regions.
Related Resources
-
Open PDF file, 451.54 KB, ROAD Methodology (English, PDF 451.54 KB)
-
Open PDF file, 817.64 KB, ROAD User Guide (English, PDF 817.64 KB)
Regional Occupation Alignment Dashboard (ROAD)
Throughout the dashboard, users can hover over items with their cursor for more information. Sort and filter data using the drop-down menus. Click an occupation title to view detailed information on that occupation. For detailed, step-by-step instructions on using the dashboard, plus guidance on incorporating local knowledge and regional context, see ROAD User Guide.
Related Resources
-
Open PDF file, 451.54 KB, ROAD Methodology (English, PDF 451.54 KB)
-
Open PDF file, 817.64 KB, ROAD User Guide (English, PDF 817.64 KB)
Data Sources & Methodology
Data Sources
The Integrated Postsecondary Education Data System (IPEDS) is a set of annual surveys conducted by the U.S. Department of Education’s National Center for Education Statistics. It collects data from all institutions that participate in federal student financial aid programs, including colleges, universities, and technical schools.
The Occupational Employment and Wage Statistics (OEWS) program is a data series produced by the U.S. Bureau of Labor Statistics providing annual estimates of employment levels and wages for nearly 800 occupations across industries and geographic areas. The data is collected from surveys of nonfarm businesses and is widely used for workforce planning, policy development, and labor market analysis.
Occupational employment projections published by the Department of Economic Research use current and historical data to project how employment in various occupations will change over time.
Note on suppressed data: In some instances, state-wide and/or regional employment and wage data is suppressed from OEWS and employment projections. In these cases, data is imputed from alternative sources including national OEWS statistics, Lightcast, and 5-Year American Community Survey (ACS) data from the U.S. Census Bureau.
For additional data source details, see ROAD Methodology.
Methodology
For additional information about the Opportunity Star system and the estimation of graduates in training pipelines, see ROAD Methodology.
Related Resources
-
Open PDF file, 451.54 KB, ROAD Methodology (English, PDF 451.54 KB)
-
Open PDF file, 817.64 KB, ROAD User Guide (English, PDF 817.64 KB)
Contact
To contact the Massachusetts Department of Economic Research with questions or to request data in spreadsheet format, please use this form.