
Data and collection
Methods
A range of data and information collection methods were used to support a well-informed understanding of travel along the corridor. Data and information were also provided by local stakeholders such as the Milton Police Department. Methods for data and information collection included:
- Automatic Traffic Recorders
- Manual Travel Times
- INRIX Travel Times and Speed DataSpeed Feedback Signs
- Field Observations
- Community Surveys
- Project Email
Field Observations
Field observations were conducted throughout the pilot to inform MassDOT’s understanding of the impacts along corridor and respond to community feedback. Field observations included:
- Route 28 Signal Operations and Traffic: October 21-22, 2025
- Route 28 U-turn movements: October 9, 2025
- Cut-through Observations: November 6, 2025
- Corridor Travel Times: November 20, 2025, April 8, 2026, and April 11, 2026
- Route 28 Signal Operations and Traffic: April 8, 2026 and April 11, 2026
Counts
Counts were taken to inform travel volumes and roadway usage at several locations along and outside the corridor.
Roadway count locations:
- Route 28 (Randolph Avenue)
- Reedsdale Road
- Randolph Avenue
- Pleasant Street
- Reed Street
- Highland
- Hallen Avenue
- Ridgewood Road
- Heather Drive
- Nahanton Avenue
- Sassamon Avenue
- Hillside Street
- Eager Road
- Chickatawbut Road
- Blue Hill Avenue
- Blue Hills Parkway
- Canton Avenue
- Unquity Road
- Adams Road
- Clifton Road
Instersection count locations:
- Route 28 at Reedsdale Road
- Route 28 at Pleasant Street
- Route 28 at Reed Street
- Route 28 at Highland Street
- Route 28 at Hallen Avenue
- Route 28 at Ridgewood Road
- Route 28 at Nahanton Avenue
- Route 28 at Heather Drive
- Route 28 at Sassamon Avenue
- Route 28 at Hilltop Street
- Route 28 at Hillside Street
- Route 28 at Eager Road
- Route 28 at Susi Lane
- Route 28 at Chickatawbut Road
- Reedsdale Road at Clifton Road
- Reedsdale Road at Spafford Road
- Canton Ave at Blue Hills Parkway/Unquity Road/Blue Hills Avenue
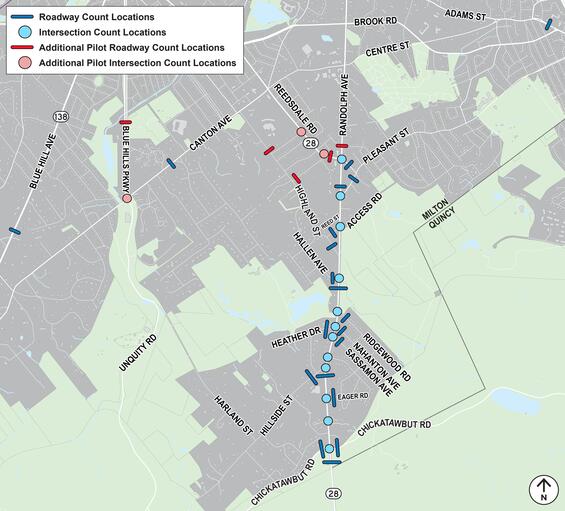
Map 1. Roadway and intersection count locations.
Weekday traffic volume changes were determined from data collected before and during the pilot. Daily traffic volume changes are shown in the images below.
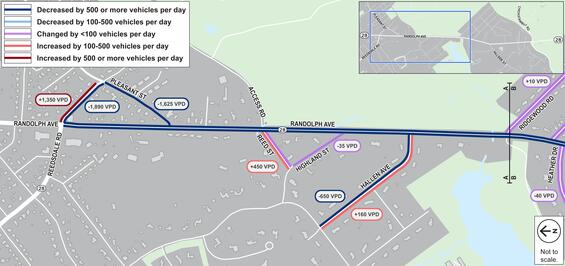
Map 2. Traffic volume changes along Randolph Avenue on the north side of the project area.
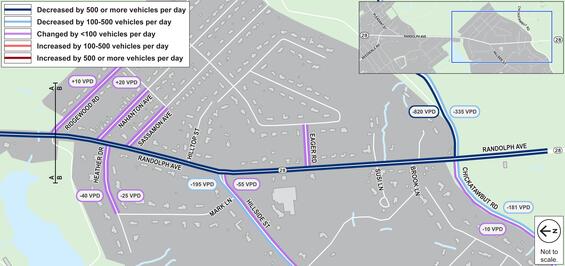
Map 3. Traffic volume changes along Randolph Avenue on the south side of the project area.
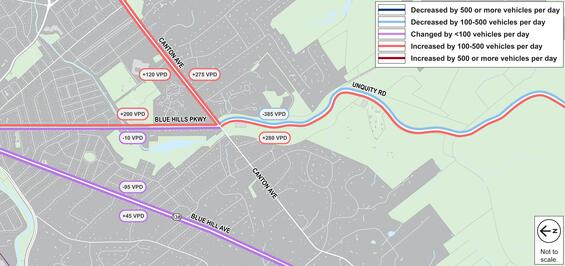
Map 4. Traffic volume changes along roadways outside the immediate project area.
Travel times
Travel times were recorded along the corridor from the Route 28 and Reedsdale Road intersection to the Route 28 and Chickatawbut Road intersection. Travel times were recorded before and during the pilot at peak travel times in the morning and evening on the following dates:
- Saturday, September 28, 2025
- Tuesday, September 30, 2025
- Thursday, November 20, 2025
- Tuesday, April 8, 2026
- Saturday, April 11, 2026
Additional travel times were obtained using probe data. The travel times can be seen in the table below.
Recorded travel times along Route 28
| Travel Time Category | Peak Timeframes | NB/SB | Pre-Pilot* - Sept 30, 2025 | Early Pilot - Nov 20, 2025 | Late Pilot - April 8, 2025 | Pre-Pilot to late Pilot Change |
|---|---|---|---|---|---|---|
| Average Recorded Weekday Travel Time (min) | AM Peak 7-9AM | NB | 5.7 | 18.7 | 16.0 | +10.3 |
| SB | 5.2 | 3.7 | 4.8 | -0.4 | ||
| PM Peak 4-6PM | NB | 5.8 | 12.5 | 6.0 | +0.2 | |
| SB | 5.0 | 14.9 | 10.4 | +5.4 | ||
| Maximum Recorded Weekday Travel Time (min) | AM Peak 7-9AM | NB | 7.2 | 22.7 | 23.1 | +15.9 |
| SB | 6.7 | 5.4 | 9.1 | +2.4 | ||
| PM Peak 4-6PM | NB | 8.4 | 16.3 | 6.6 | -1.8 | |
| SB | 7.2 | 22.1 | 13.0 | +5.8 |
Probe Data travel times along Route 28
| Travel Time Category | Peak Timeframes | NB/SB | Pre-Pilot (Sept 2025 | Early Pilot (Nov 2025) | Late Pilot (April 2026) | Pre-Pilot to Late Pilot Change |
|---|---|---|---|---|---|---|
| 50th Percentile Weekday Travel time (min) | AM Peak 7-9AM | NB | 9.5 | 13.2 | 12.8 | +3.3 |
| SB | 4.5 | 4.7 | 4.8 | +0.3 | ||
| PM Peak 4-6PM | NB | 5.8 | 6.4 | 6.0 | +0.2 | |
| SB | 7.8 | 12.2 | 10.4 | +2.6 | ||
| Maximum Weekday Travel time (min) | AM Peak 7-9AM | NB | 23.6 | 25.0 | 24.3 | +0.7 |
| SB | 10.8 | 8.7 | 8.1 | -2.7 | ||
| PM Peak 4-6PM | NB | 14.4 | 19.1 | 19.5 | +5.1 | |
| SB | 14.9 | 20.3 | 18.7 | +3.8 |
Speeds
Speed data was collected along the corridor using speed feedback signage and INRIX probes.
Speed Feedback Signage Data Showed:
- Average Speed Decreased by 3 MPH
- 85th Percentile Speed Decreased by 5 MPH
Probe Speed Data Showed:
- Average Speed Decreased 6-8 MPH
- 85th Percentile Speed Decreased by 7-8 MPH
The overall data trends can be seen in the images below.
Speed Feedback Signage Average Vehicle Speed Changes Route 28 Northbound
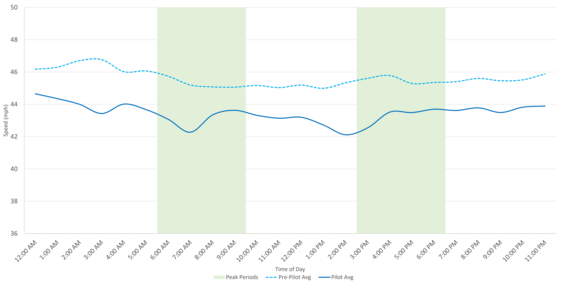
Chart 1. Average vehicle speeds throughout the day along Route 28 northbound from speed feedback signage before and during the pilot.
Speed Feedback Signage Average Vehicle Speed Changes Route 28 Southbound.
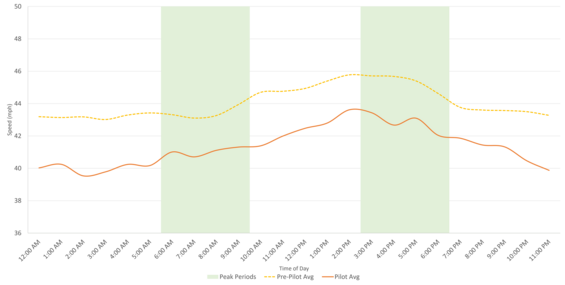
Chart 2. Average vehicle speeds throughout the day along Route 28 southbound from speed feedback signage before and during the pilot.
INRIX Probe Average Vehicle Speed Changes Route 28 Northbound.
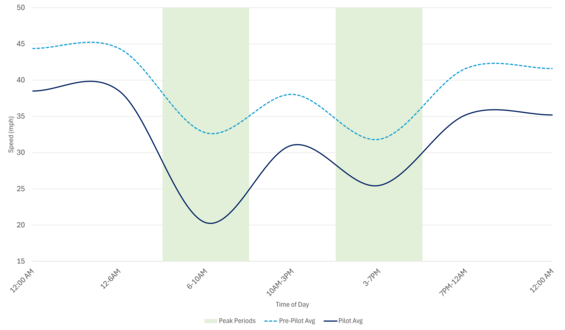
Chart 3. Average vehicle speeds throughout the day along Route 28 northbound from INRIX probe data before and during the pilot.
INRIX Probe Average Vehicle Speed Changes Route 28 Southbound.
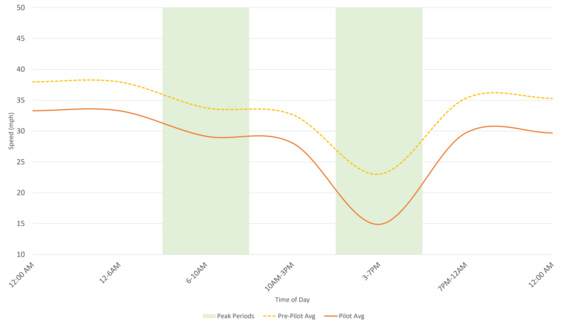
Chart 4. Average vehicle speeds throughout the day along Route 28 southbound from INRIX probe data before and during the pilot.