Parent/Guardian Travel Survey

A parent/guardian travel survey helps gauge how and where students travel to/from school through a three-minute online or paper questionnaire. Results show the average distance students travel to/from school, as well as the number of students living within walking/biking distance of the school. The survey is offered in nine languages. Schools are offered an incentive to achieve a 50 percent or higher response rate. Contact your Outreach Coordinator to schedule a survey at your school.
All results are presented via a formal SRTS survey report.
Links to paper surveys (PDF):
Parent/Guardian Travel Survey - English
Parent/Guardian Travel Survey - Spanish
Parent/Guardian Travel Survey - French
Parent/Guardian Travel Survey - Portuguese
Parent/Guardian Travel Survey - Khmer (Cambodian)
Parent/Guardian Travel Survey - Arabic
Parent/Guardian Travel Survey - Haitian Creole
Arrival/Dismissal Observations

Outreach coordinators will look at a school’s immediate environment and surroundings during school arrival and dismissal. This is a critical data collection step toward gaining a clear overview of student, parent/guardian, and staff behavior during an often-hazardous time. During an observation, we look at the interaction between walker/bikers, buses and vehicles. We also look at Crossing Guard utilization and rule violation of current arrival and dismissal procedures.
All results are presented via a formal SRTS observation report.
Walk/Bike Assessments

Outreach coordinators will examine the outdoor surroundings of a school to identify or study the routes that students use to walk to/from school. During an assessment, participants observe and document safety and accessibility issues and experience walking and biking conditions firsthand.
All results are presented via a formal SRTS assessment report.
School Streets Guide

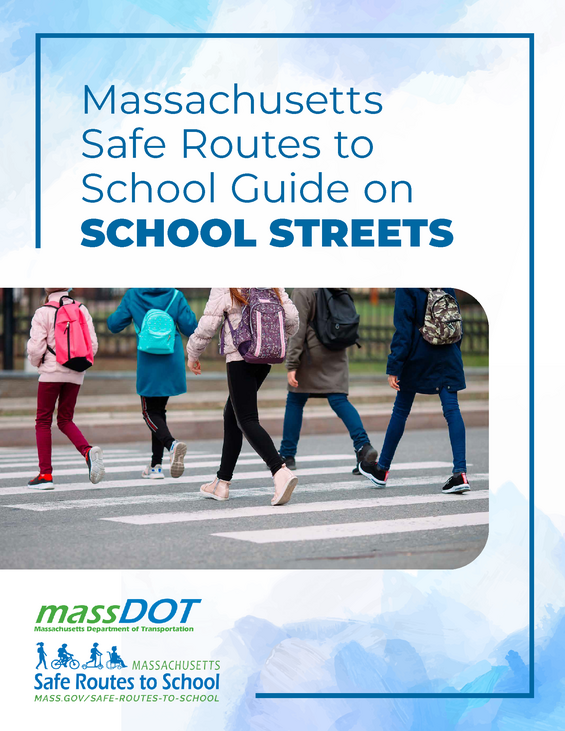
“School Streets” are a traffic calming tool, closing roads or roadway sections to vehicular traffic during school arrival and dismissal. This area then serves as a temporary pedestrian plaza where students, families, and staff can more comfortably navigate school arrival and dismissal while safely separated from through-traffic.
This guide introduces the concept, value, and process of implementing School Streets for schools in Massachusetts.
Mapping
SRTS can help with the creation of maps either before or after Arrival/Dismissal Observations and/or Walk/Bike Assessments. The different maps we can create are based on data we gather from schools. Types of maps include:
- Student radius maps
- Walkshed/bikeshed maps
- Walking School Bus/Bike Train maps
- Park, Walk, & Roll maps
- Circulation Plan maps

Dashboards
Safe Routes to School Program Dashboard
The SRTS Dashboard is a great way to follow your school’s engagement within the SRTS Program. You can see your school’s activities, event participation, arrival/dismissal observations, and more. The SRTS Dashboard is another step in keeping a foundation of equity and transparency as we provide support to students and schools across the Commonwealth.
MassDOT Municipal Transportation Dashboard
This MassDOT dashboard is designed to display a municipality's vehicular crash data through observing the pedestrian-involved, cyclist-involved, or vehicular crashes in the community or near a school. There is an ability to toggle crashes on and off within a .5 mile walkshed and 2-mile bikeshed
Statistics shown include crashes by mode such as vehicular-only, cyclist-involved or pedestrian-involved, crash time of day, crash time of year, weather conditions, severity by mode, and severity based on weather conditions. Select the municipality name and then the "Safety" dashboard.
Annual Partner Survey
Once a year, SRTS collects Program satisfaction data and ideas from our partner school, caregivers, and stakeholders in Massachusetts to better understand school and community needs. We are constantly striving to improve and adapt the Program to suit our partners’ needs in any way we can. Request to be added to our email list so you can provide your important feedback! Thank you for your participation!
Additional Links
- National SRTS Walkability Checklist
- Travel Tally Handout: Student surveys are conducted by teachers through a one-page datasheet based on student hand-raising in the classroom over a three-day period.