
The Task Force meetings were primarily focused on the main issues impacting the state’s long-term liabilities: excess capital gains, Stabilization Fund, pension liability, and disaster relief. Within each of those broader conversations, the Task Force was able to directly consider the legislative mandate:
- Excess Capital Gains Threshold
As noted above, the FY 2011 budget established a $1 B threshold for capital gains taxes available for the budget. Beginning in FY 2014, the threshold was increased annually to reflect the average annual rate of growth in United States GDP over the preceding 5 years based on the most recently available data published by the Bureau of Economic Analysis in the United States Department of Commerce.
Based on analysis reviewed by the Task Force, the original $1 B threshold was a reasonable starting place, based on historical collections at that time; however, the threshold has fallen behind actual economic and revenue growth for a few reasons.
First, the threshold remained flat at $1 B from FY 2011 to FY 2014. Second, the threshold uses a 5-year compound annual growth rate of GDP to adjust – meaning each adjustment is delayed in capturing critical economic data. Third, capital gains growth has outpaced GDP growth since the implementation of the threshold.
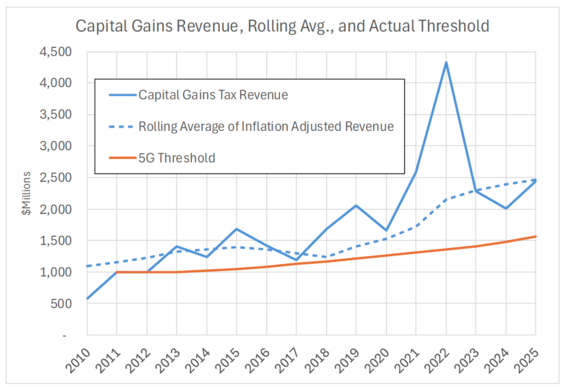
Capital gains tax revenue fluctuates significantly over time, including a sharp spike in 2022, while the rolling average and Section 5G threshold increase more gradually through 2025.
Source: Analysis by The Pew Charitable Trusts
Pew’s analysis suggests that the initial delay in regularly adjusting the threshold and the compound annual growth rate methodology used to adjust it have caused the threshold to lag economic and revenue growth. Therefore, this analysis indicates that a one-time $300 M to $600 M prospective upward adjustment to the threshold may be warranted.
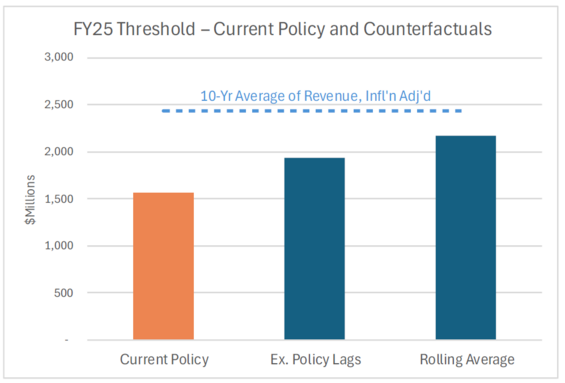
The chart shows the FY25 current policy threshold at about $1.6 billion, compared with roughly $1.9 billion under excluded policy lags and $2.2 billion under a rolling average approach. A dotted reference line marks the 10-year average of inflation-adjusted revenue at about $2.4 billion.
Source: Analysis by The Pew Charitable Trusts
- Excess Capital Gains Disbursement Percentages
As stated above, the current Section 5G policy transfers 90% of excess capital gains to the Stabilization Fund, 5% to the Pension Liability Fund, and 5% to the State Retiree Benefits Trust Fund. This has been an effective policy for building up the Stabilization Fund to historic levels. Excess capital gains transfers are the predominant financing mechanism for the Stabilization Fund – representing nearly 75% of the fund’s growth since the introduction of the Section 5G policy. Meanwhile, the Pension Liability Fund receives an annual pre-budget transfer, based on a triennial funding schedule (totaling $4.93 B in FY 2026), and the State Retiree Benefits Trust Fund receives an annual budgetary transfer (totaling $450 M in FY 2026).
Excess capital gains transfers are effectively supplemental for the Pension Liability Fund and the State Retiree Benefits Trust Fund, while it is the chief resource for building up the Stabilization Fund. Additionally, there is sense in primarily utilizing the Section 5G mechanism to build reserves, given the noted volatility on a year-to-year basis.
Capital gains taxes are extremely volatile. During strong economic times, collections tend to be strong, whereas they typically falter during economic downturns. Building reserves when the economy is strong is a good practice. Using capital gains as a more prominent method for funding pensions or retiree benefits could lead to challenges in meeting our funding obligations when the economy hits turbulence.
- Long-term Liability Best Practices
Budget Stress Testing
In its discussions, the Task Force coalesced around the importance of stress testing to best understand the state’s general fiscal resilience and ability to meet its long-term liability obligations. Stress tests are budgetary models that evaluate a given entity’s resilience to moderate or severe economic shocks, such as recessions.
According to Pew, at least 20 other states have implemented stress tests for their budgets to better understand their structural vulnerabilities, as well as the reserves necessary to manage an economic shock. While Massachusetts conducts informal comprehensive budget forecasting, a formal stress test, examining both revenue and spending scenarios, was discussed by the Task Force as a worthwhile addition to the state’s budgeting practices.
The Task Force also discussed the importance of establishing a reasonable fiscal toolkit for recessionary periods to ensure the state has a comprehensive response plan. This toolkit will ensure transparency and serve as a guide to state fiscal officials, the legislature, and constituents. While each economic downturn will look different, such a toolkit can help promote best practices and set reasonable expectations for the types of measures that should be prioritized, including the appropriate use of reserves.
Pension Liability Fund
The Commonwealth’s unfunded pension liability is funded via an annual pre-budget transfer. By statute, the state is required to reach full funding of the liability by FY 2040. Based on the recent funding schedules (increasing the annual transfer by 9.63%), the state is on track to meet this obligation ahead of the statutory deadline.
The Commonwealth has made significant progress in funding its pension liability, as demonstrated by two key factors identified by Pew and backed by the Public Employee Retirement Administration Commission, which oversees the state’s pension system. First, the state has achieved positive amortization, which measures whether member contributions are sufficient to meet current obligations and pay off outstanding liabilities. Second, the fund’s ratio of operating cash flow to plan assets has improved from -3.2% in FY 2014 to -1% in FY 2023. This factor demonstrates the plan solvency if investment returns underperform plan assumptions.
The table below highlights three main best practices amongst the states, identified by Pew. Notably, similar to the budget stress testing noted in the last section, 28 states have also implemented pension fund stress testing to identify potential risks and their funds’ ability to withstand various economic shocks.
| Policy Goal | Key Concept | Standard of Practice |
|---|---|---|
| Fiscal Sustainability | Net Amortization | Annual contributions under state policy are sufficient to reduce pension debt, also known as “positive amortization.” Stated policy goal for PERAC. Tracked by Moody’s “tread water” indicator. |
| Planning for Uncertainty | Risk Reporting | Routine stress testing to assess impact of investment risk on pension funding levels and the budget. 28 states have adopted. Recommended practice by National Association of State Treasurers (NAST). |
| Cost Predictability | Managing Contribution Volatility | Funding policy is designed to respond to economic shocks, avoiding unaffordable spikes in annual required contributions. Conference of Consulting Actuaries (CCA) and Government Finance Officers Association (GFOA) have outlined best practices for predictable funding. |
Pew also identified a creative pension liability financing mechanism being employed by other states called layered amortization. With layered amortization, legacy unfunded liabilities can be kept on the existing payment schedule, while losses or gains in subsequent years are assigned a new payment period, helping to keep pension costs more stable and predictable over time. This mechanism is recommended by the Conference of Consulting Actuaries and the Government Finance Officers Association and has been adopted more recently by peer states in Connecticut, Maryland and Minnesota.
- Stabilization Fund Best Practices
Deposits
Regarding funding policies for budgetary reserves, Massachusetts is relatively strong compared to other states. There is a wide range of methodologies used by states; however, Massachusetts is on a relatively short list of states that use a combination of year-end surpluses and dedicated revenue streams to build its reserve. Our volatility-based practice of dedicating excess capital gains is also a best practice, because it insulates the budget from unpredictability in collections.
| Deposit Mechanism (as of 2021) | States |
|---|---|
| All or portion of year-end surplus | Arkansas, Georgia, Kansas, Kentucky, Minnesota, Mississippi, Montana, New Jersey, New Mexico, New York, North Dakota, Ohio, Oklahoma, Oregon, Pennsylvania, South Dakota, Utah, Vermont, West Virginia, Wisconsin |
| Portion of total or special revenues | Alaska, California, Rhode Island, Wyoming |
| Tied to revenue or economic growth | Arizona, Idaho, Illinois, Indiana, Michigan, North Carolina, Tennessee, Virginia |
| Required minimum balance | Colorado, Florida, Iowa, Missouri, South Carolina |
| Combination | Connecticut, Delaware, Hawaii, Louisiana, Maine, Maryland, Massachusetts, Nebraska, Nevada, New Hampshire, Texas, Washington |
| No required payments | Alabama |
Sizing
Since FY 2011 when the Section 5G policy was first implemented, the Stabilization Fund has grown by 487%.
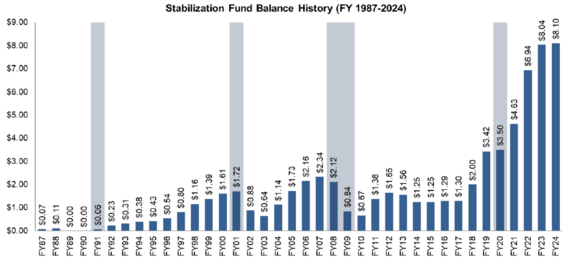
The Stabilization Fund balance fluctuated below $3 billion for most years from FY 1987 through FY 2018, then rose sharply from $3.42 billion in FY 2019 to $8.10 billion in FY 2024.
There have been several metrics used to demonstrate a well-funded reserve fund1
- The National Conference of State Legislatures previously recommended 5% of annual general fund expenditures.
- The Center on Budget and Policy Priorities has suggested 15% of annual general fund expenditures
- The Government Finance Officers Association makes its recommendation based on operating runway – suggesting approximately two months of general fund operating expenses (totaling ~16.7% of general fund expenditures).
Based on these metrics, Massachusetts performs well. Based on data from the National Association of State Budget Officers (NASBO) from FY 2024, Massachusetts had the third highest overall balance, representing 16.5% of General Fund operating expenses.2
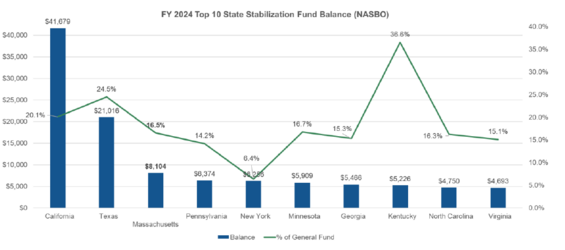
California and Texas had the largest stabilization fund balances in FY 2024, while Massachusetts ranked third at about $8.1 billion, equal to 16.5% of its general fund. Kentucky had the highest reserve as a share of general fund spending at 36.6%.
While the state performs well against typical standards, the Task Force discussed the importance of budget stress tests as a best practice to evaluate the Stabilization Fund’s appropriate size. It was noted that Massachusetts’ Stabilization Fund may be stretched further than other states’ reserves during a recession, given the import the state places on health care and education, amongst other priorities, and the costs necessary to preserve core services.
In addition, the Task Force noted that a one-size-fits-all rule for reserve balances does not account for each state’s relative revenue volatility, which can dramatically affect the impacts of an economic downturn.
Pew noted for the Task Force that peer states with models worth emulating include Minnesota and North Carolina. Both states use annual, statutorily required stress tests to automatically adjust their stabilization fund target balances.
Withdrawals
The Task Force also reviewed best practices around withdrawal policies. Massachusetts’ policies are relatively broad but require Legislative approval and an attestation of other tools being deployed before going to the Stabilization Fund. Eligible fund uses include:
- To make up any difference between actual state revenues and allowable state revenues in any fiscal year in which actual revenues fall below the allowable amount
- To replace the state and local loss of federal funds; or
- For any event which threatens the health, safety or welfare of the people or the fiscal stability of the commonwealth or any of its political subdivisions
Other states utilize more complicated processes before they can use their reserves. For example, New York employs a monthly economic index, using a series of labor statistics, that must decline for five consecutive months before a withdrawal is allowed. The Task Force discussed the benefit of the current, less restrictive policy for drawing on the fund but did agree that having more prominent best practices and guidelines for when to draw on the Stabilization Fund would be prudent. As mentioned previously, the Task Force also discussed the importance of establishing a reasonable fiscal toolkit for responding to recessionary periods. Again, this toolkit would be critical for ensuring a transparent response and serve as a guide for all parties involved in the fiscal decision-making process.
- Credit Rating Considerations
Each of Standard & Poor’s (S&P) latest credit rating adjustments for the Commonwealth have revolved around Section 5G and the Stabilization Fund.
In 2012, S&P upgraded Massachusetts from ‘AA’ to ‘AA+’ due in large part to the establishment of the Section 5G policy.
"We raised the commonwealth's rating in September of 2011, reflecting its ongoing progress in improving financial, debt, and budget management practices while implementing cost-control and reform measures associated with its long term liabilities. The upgrade also reflected the commonwealth's commitment to its stabilization fund…”3
In 2017, S&P downgraded MA bonds back to ‘AA’ due to continuously circumventing the Section 5G policy and therefore not building the Stabilization Fund. More important in this review than not building the Stabilization Fund was the fact that the state was not following its own fiscal policies.
“The downgrade reflects what we view as the commonwealth's failure to follow through on rebuilding its reserves as stipulated through its own fiscal policies aimed at mitigating the state's propensity for revenue volatility.”4
In 2023, S&P upgraded the state’s status back to ‘AA+’, citing good fiscal management and attention to reserves.
“The upgrade reflects our view that the Commonwealth’s commitment to strengthen its budget management practices supported by the state’s improved reserves and strong economy will be sustained through near-term recessionary pressures.”5
The Task Force discussed that, based on recent experience, it is critical that we are consistent with the policies that we implement to ensure sustainability. As it related to Section 5G, for example, the credit rating agencies viewed it unfavorably when the state used excess capital gains to consistently balance the budget while the Stabilization Fund was inadequate.
While the state has made significant progress in building the Stabilization Fund (primarily via the excess capital gains policy), it is still critical that we maintain good fiscal practices moving forward. Establishing standing multi-year budget forecasts and stress tests are examples of tools that can help the state better assess the needs of our reserves and long-term liabilities to avoid downgrades. Additionally, creating best practices and guidelines around the use of the Stabilization Fund would be another opportunity to demonstrate strong fiscal planning to rating agencies and help the state navigate future fiscal uncertainty.
- Other Relevant Fiscal Factors
Disaster Preparedness and Resiliency
One of the growing long-term liabilities that states must confront is the rising cost of natural disasters, exacerbated by the growing impacts of climate change. According to data gathered by the National Centers for Environmental Information, Massachusetts has experienced at least 45 disasters totaling $1 B or more in losses and damages across public and private entities since 1980. More concerning is that the frequency of these high-cost events has been increasing. Between 1980 and 1999, the state experienced 18 of these events; since 2020, the state has already experienced 14 such events.6
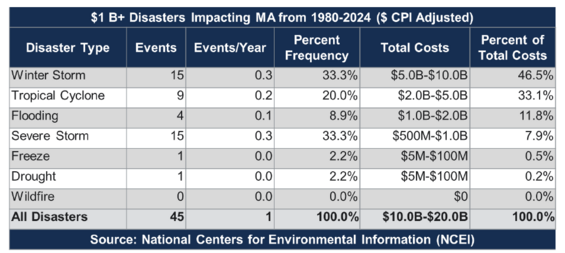
From 1980 to 2024, Massachusetts experienced 45 billion-dollar disasters with total costs of $10 billion to $20 billion. Winter storms and severe storms were the most frequent event types, while winter storms and tropical cyclones accounted for the largest shares of total costs.
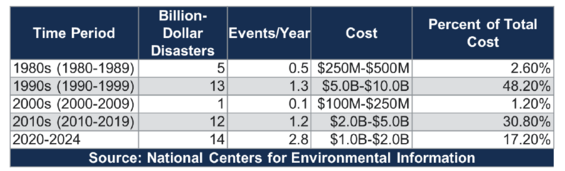
Massachusetts experienced 14 billion-dollar disasters from 2020 to 2024, averaging 2.8 events per year, compared with 13 events in the 1990s and 12 in the 2010s. The 1990s accounted for the largest share of total costs at 48.2%.
In the FY 2025 budget, the state took an important step to better prepare for increased natural disasters by creating a Disaster Relief & Resiliency Fund. Currently, the fund can receive funding transfers from the operating budget but otherwise does not have a permanent recurring revenue stream. In FY 2025, the fund was capitalized on a one-time basis via year-end surplus funds.
Given its relation to the Commonwealth’s long-term liability planning, the Disaster Relief & Resiliency Fund remains a strong candidate to receive a portion of any excess capital gains pursuant to Section 5G. The Governor’s FY 2025 budget proposal adjusted the excess capital gains distribution to add this fund, and there may be even more sense to the policy today given the uncertain future of the Federal Emergency Management Agency (FEMA).
In addition, the Task Force discussed the benefits of establishing a healthy balance to allow a portion of the fund to support proactive resiliency planning and projects to mitigate the impacts of natural disasters. According to research conducted by Pew, other states have elected to formulaically allow portions of their disaster funds to support resiliency. For example, Montana allows a portion of its wildfire suppression fund to support preparedness and mitigation activities if the balance of the fund exceeds 3% of its total general fund expenditures. Similarly, Utah allows the greater of $10 M or $3 M plus 10% of unspent deposits into its wildfire prevention fund to support fire prevention costs.