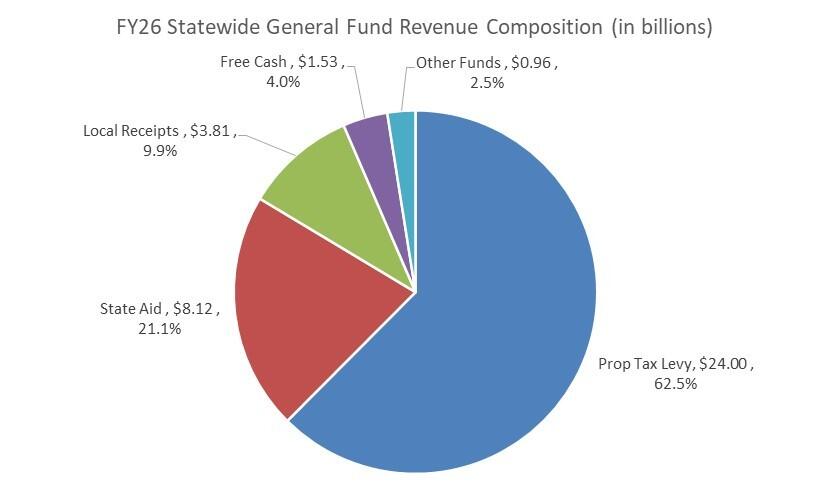
Local Receipts are defined as locally generated revenues, other than real and personal property taxes. Examples include motor vehicle excise, investment income, hotel/motel tax, fees, licenses/permits, rentals and charges. Annual estimates of Local Receipts are shown on Page 3 of the tax rate recapitulation sheet. As budgeted for FY2026, these total $3.81B statewide and comprise just under 10% of all General Fund revenue, as shown in the chart below (Offset Receipts, which total $23.2M statewide, are included as Local Receipts in this total).
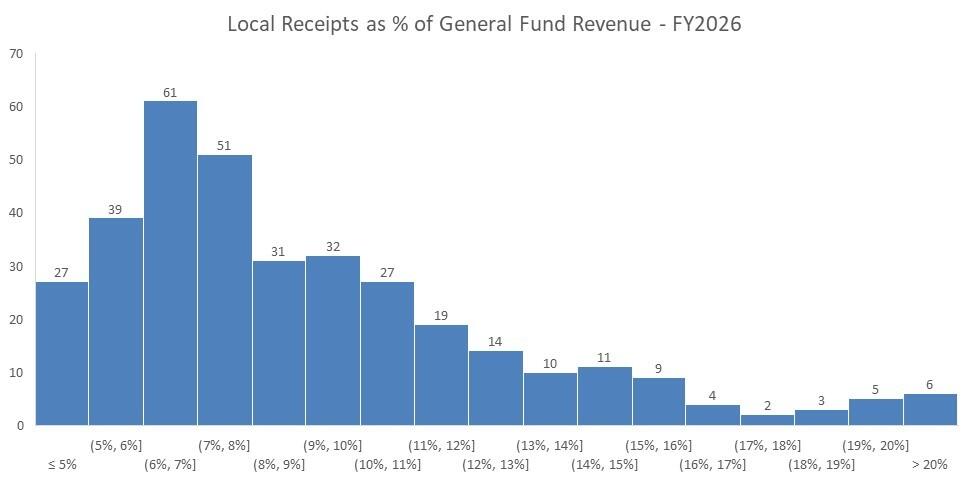
While in the aggregate Local Receipts comprise 9.9% of all General Fund revenues, the median for municipalities is 7.9%. The graph below depicts the distribution for all 351 municipalities (for the four municipalities without a tax rate set as of the writing of this article, FY2025 data was used) and shows that the largest concentration is in the 6%-7% and 7%-8% ranges. All of this data can be accessed on Category 4 of the Municipal Finance Trend Dashboard.
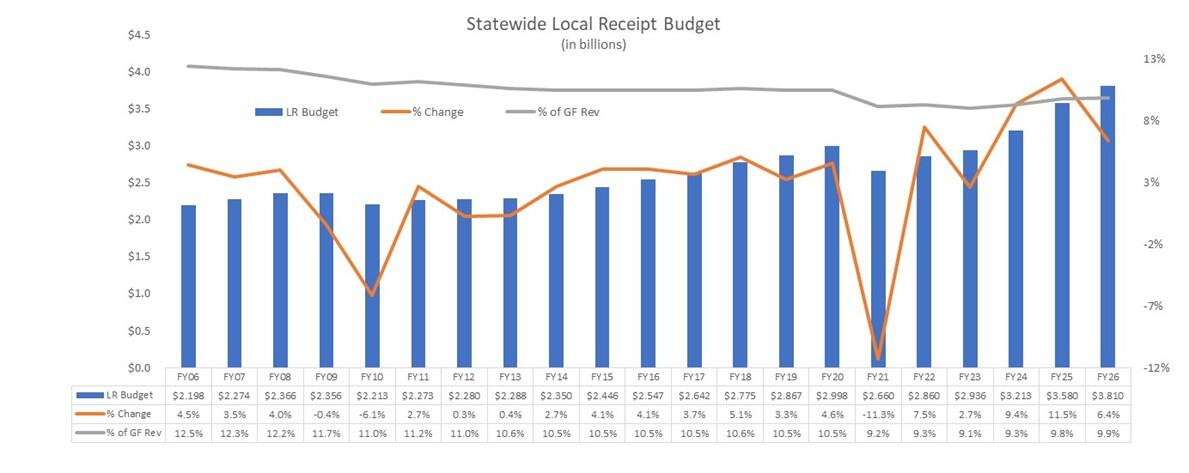
The $3.81B budgeted in FY2026 reflects an increase of $230M (6.4%) over FY2025. The graph below shows budgeted Local Receipts over the past two decades, the annual increase/decrease and what share of the General Fund budget they comprised. A few interesting trends appear:
- when the economy falters, so do budget estimates. Notice the decreases in FY10 (Great Recession) and FY21 (COVID-19).
- the percent Local Receipts comprise of all General Fund revenues has steadily decreased from 12.5% to 9.9% (some of this is due to municipalities changing how they account for Water/Sewer Charges and Other Charges from the General Fund to Enterprise Funds).
- after significant percent increases in FY2024 and FY2025, the increase in FY2026 was lower. (As we’ll see later, the increases in FY2024 and FY2026 were due, in large part, to Investment Income, which has benefitted from the elevated interest rate environment over the past couple of years caused by the Federal Reserve’s efforts to reduce inflation).
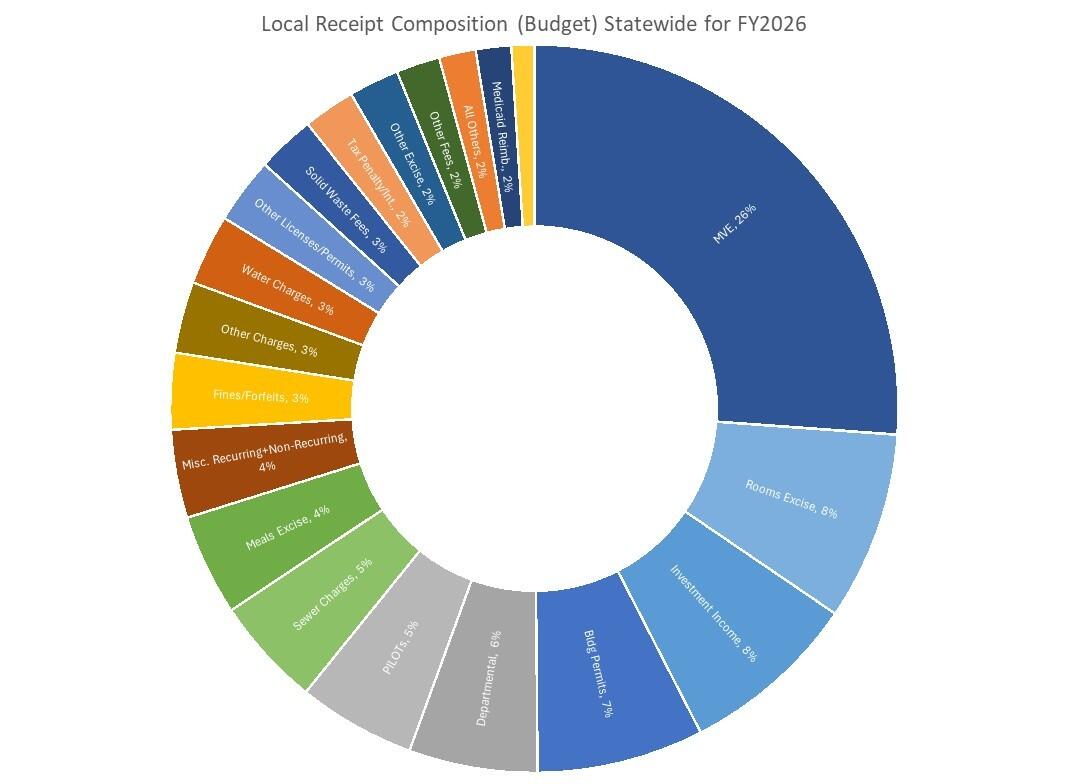
The graph below depicts the composition of budgeted Local Receipts and shows how the top 5 items are the Motor Vehicle Excise (MVE) ($991.1M, 26.1% of total), Local Option Rooms Excise ($313.9M, 8.3%), Investment Income ($300.5M, 7.9%) Building Permits ($280.9M, 7.4%), and and Departmental ($216.7M, 5.7%). For the vast majority of communities, MVE is the largest Local Receipt. In those approx. 70 municipalities where it isn’t the largest, those municipalities are either vacation destinations with local option taxes generating more revenue, they budget for water/sewer and/or recreation in the General Fund rather than in an enterprise fund or revolving fund, or they budget large amounts in the Miscellaneous Recurring or Miscellaneous Non-recurring categories.
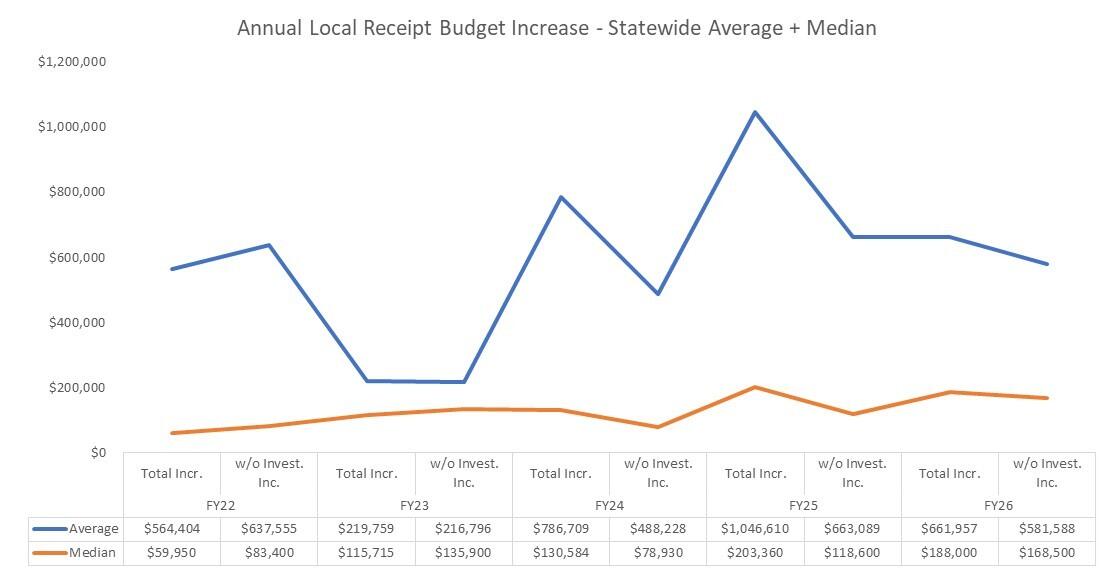
As previously noted, Investment Income has had a significant impact on Local Receipts. From a budgeting perspective, for both FY2024 and FY2025, nearly 40% of the increase in Local Receipts came from Investment Income. The graph below shows the impact in another way: without Investment Income, the average and median municipal increase in the Local Receipts budget in those two fiscal years was significantly lower than when Investment Income is added. Note how in FY2026 the difference with and without Investment Income is not as pronounced.
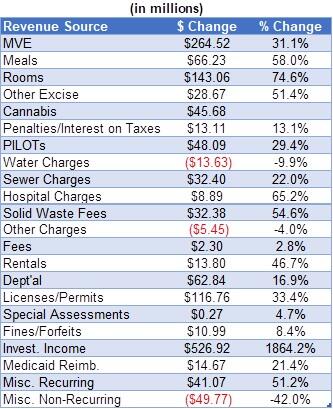
Turning to actuals, over the last decade (FY2016 – FY2025) there has been an increase of $1.4B (46.1%). The table below shows the drivers of the increase. Clearly, Investment Income has increased significantly, growing $527M (1864%) due to the elevated interest rate environment over the past couple of years caused by the Federal Reserve’s efforts to reduce inflation. Other drivers include MVE ($264.5M, 31.1%), Local Option Rooms tax ($143.1M, 74.6%) (driven, in part, to the implementation of the short-term room rental tax), Licenses/Permits ($116.8M, 33.4%) (driven by building permits), and Local Option Meals tax ($66.2M, 58%). It should be noted that the changes in Other Charges, Water Charges and Sewer Charges are impacted by some municipalities experience how they account for those sources from being General Fund revenue to Enterprise Fund revenue.
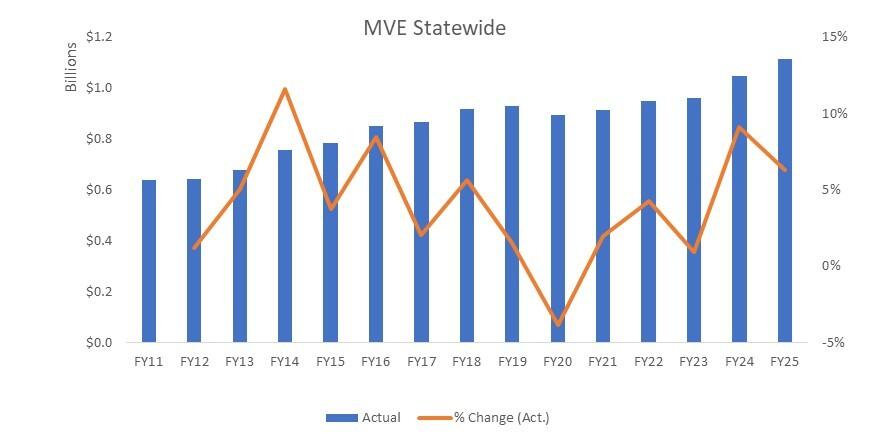
Motor Vehicle Excise trends are important because they represent the largest Local Receipt for most municipalities. Actual collections have recovered from a COVID-19 related dip, as FY2025 actuals were $219.9M (24.6%) higher than FY20.
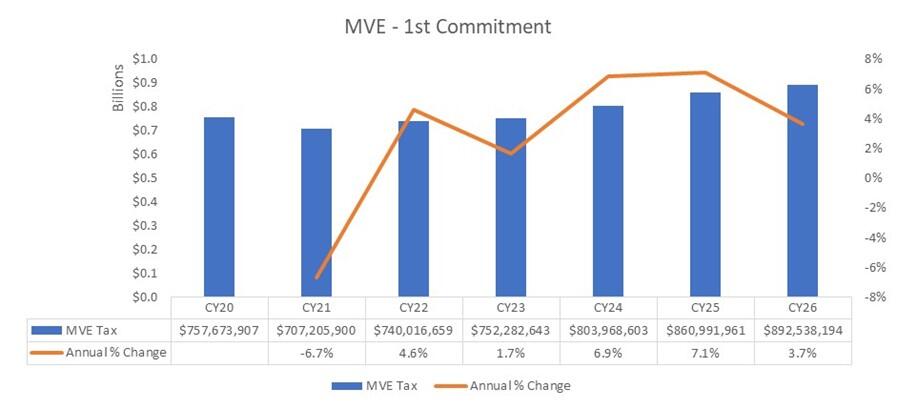
The first commitment of the calendar is the largest and makes up 70% - 80% of a municipality’s annual MVE collections. The next chart trends the first commitment over the past few years and shows how the last three fiscal years, including the current FY2026, have been strong.
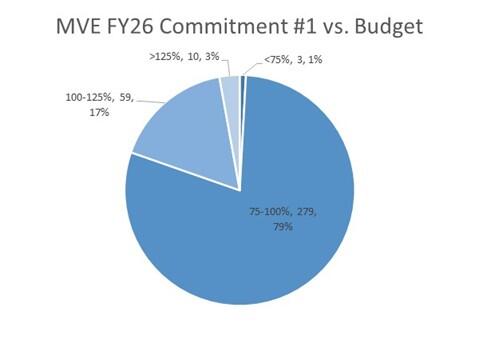
Using the FY2026 MVE estimates included on Page 3 of the Recap, the chart below shows how for all but three municipalities, the first commitment is equal to at least 75% of the budgeted amount. For 69 municipalities, the first commitment exceeds their budgeted amount.
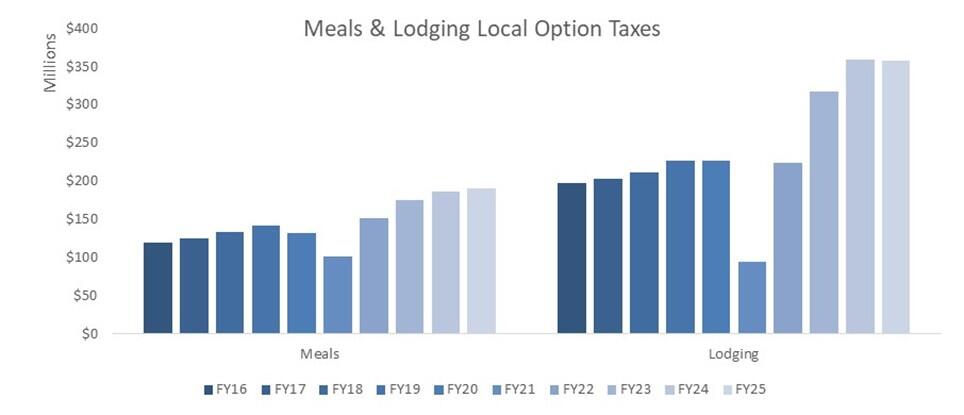
As noted above, Local Option taxes have contributed to growth in Local Receipts: since FY16, the Rooms tax has increased $159.6M (80.8%), in part, due to the implementation of the short-term room rental tax, which has added $66.7M, and the Meals tax has increased $71.3M (59.8%). It's interesting to look at the impact COVID-19 had on these important revenue sources. As shown in the graph below, after the COVID-related drop in FY21 (the first two quarters of FY21 were in CY20), these revenue sources have rebounded.
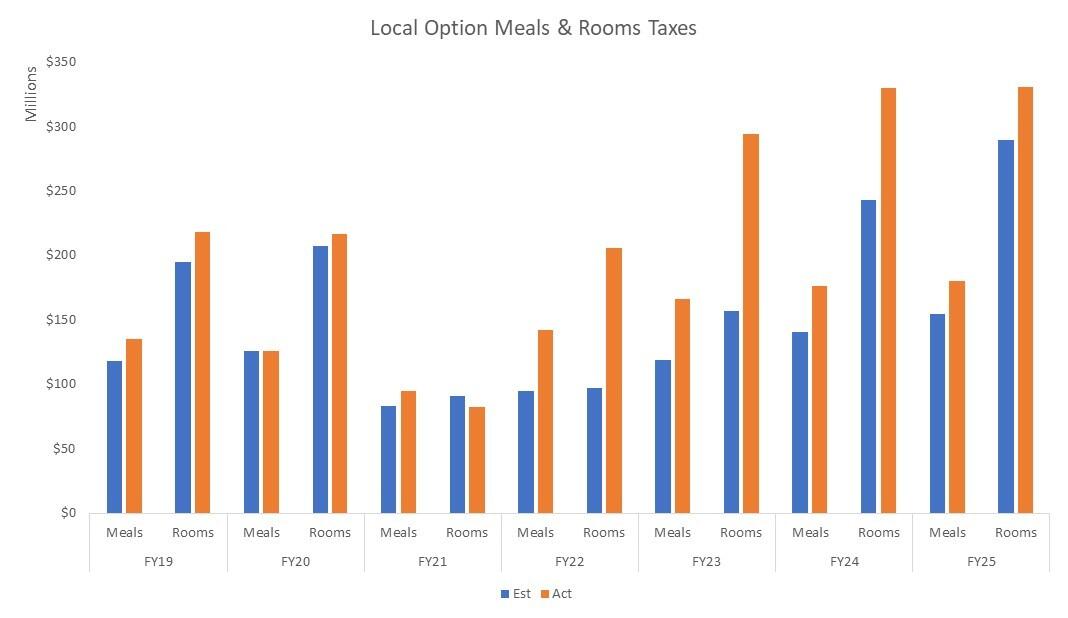
Related to COVID-19, in the aggregate municipalities have been conservative with their budget estimates for these two revenue sources. As shown in the graph below, actuals came in below budget in just one instance: FY21 Rooms ($90.6M estimated vs. $82.1M actual).
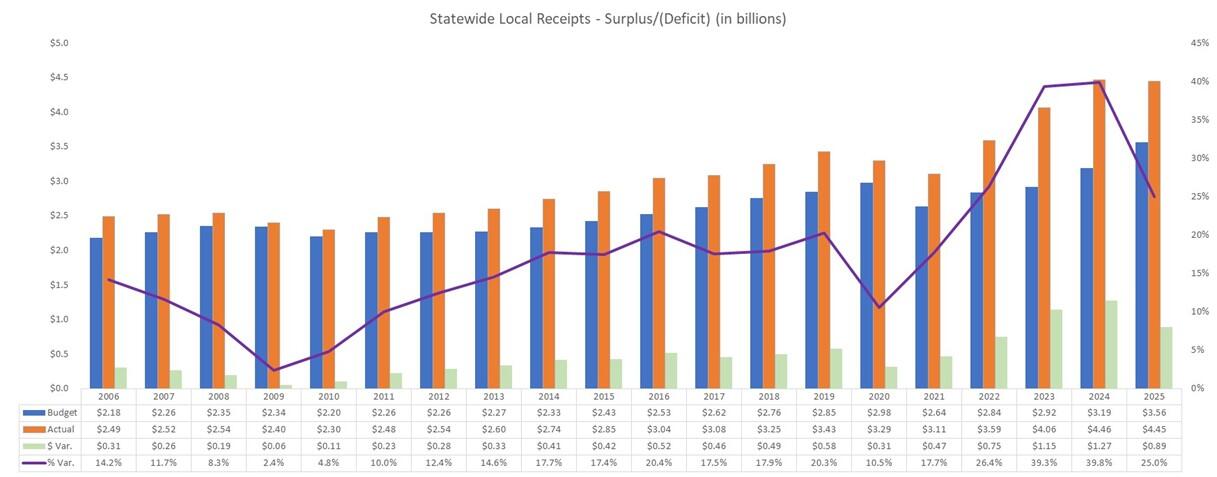
The next graph shows how actual Local Receipts compare to the amounts budgeted for the past two decades. Again, a few interesting trends present themselves:
- actual collections exceeded budget each year
- actual collections have increased nearly 80% during the duration of the data set
- actuals declined due to economic conditions (FY09-FY10 and FY21)
- the variance (or surplus) has grown over the past decade, growing from less than 15% of budget to 25%. The Investment Income experience previously mentioned has played a role in this.
- FY2025 was the first decrease in the overall surplus since the COVID-impacted FY2020
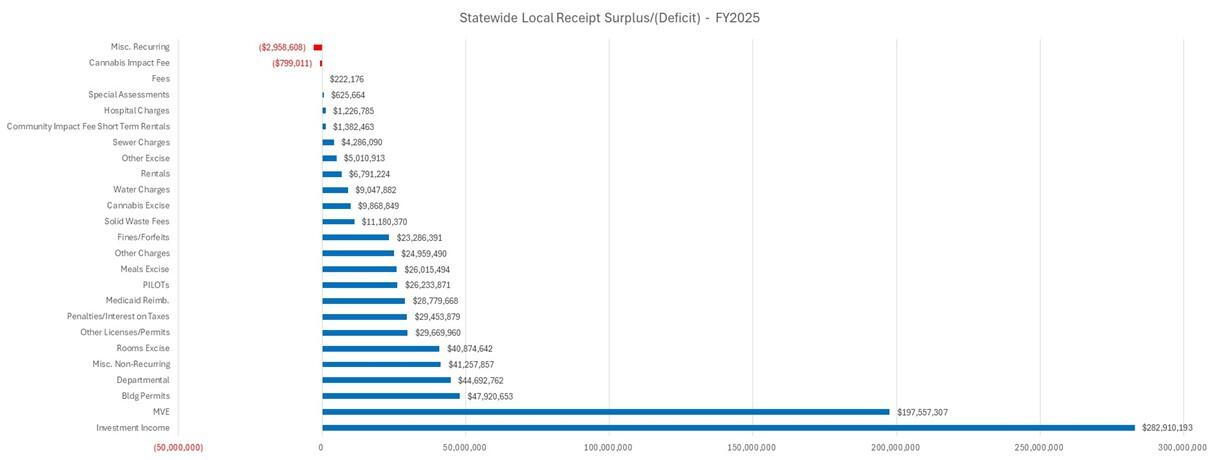
So where is the surplus coming from? Looking at the FY2025 $889M (25%) above-budget figure, the graph below shows that it was driven by Investment Income ($282.9M, or 104%, over budget), MVE ($197.6M, 21.5%), Building Permits ($47.9M, 16.8%), Departmental ($44.7M, 22.6%) and Misc. Non-Recurring ($41.3M, 150%). Where does the surplus go? It becomes part of undesignated fund balance, which ultimately becomes Free Cash once certified by the Division of Local Services (DLS).
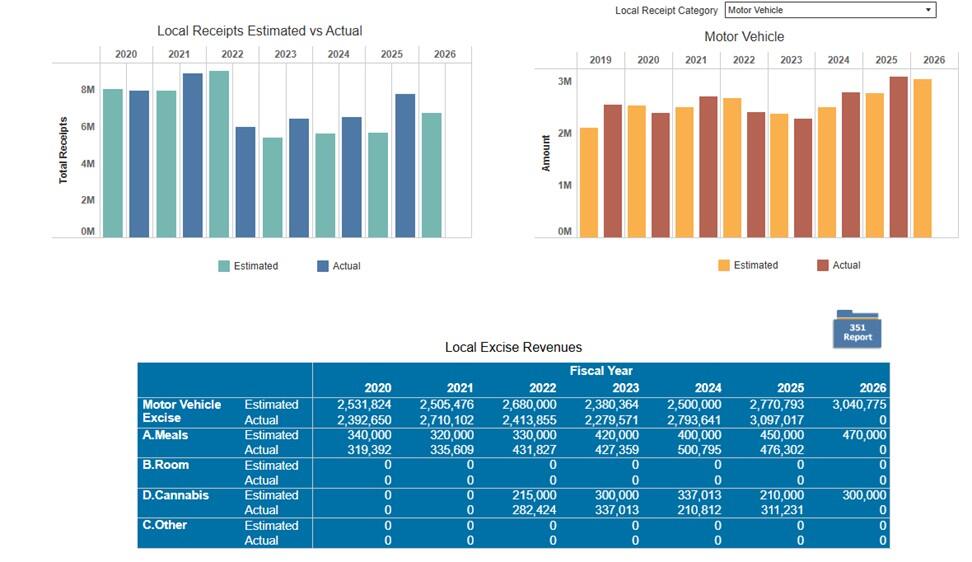
We have a great visualization called Trends in Local Receipts, a snapshot of which is shown below, that allows users to choose any municipality and see budget vs. actual trends. From this visualization you can click on the “351 Report” folder which takes you to the Local Receipt Estimate vs. Actual page where you can download this raw data going back to FY2003.
We continually strive to bring relevant and useful content to City &Town readers. Please email us with questions, comments, and suggestions for future topics at cityandtown@dor.state.ma.us.
Helpful Resources
City & Town is brought to you by:
Editor: Dan Bertrand
Editorial Board: Tracy Callahan, Sean Cronin, Janie Dretler, Jessica Ferry, Brianna Ortiz, Christopher Ketchen, Paula King, Jen McAllister and Tony Rassias
| Date published: | March 5, 2026 |
|---|