Author: Tony Rassias - Deputy Director of Accounts
This article reviews budgeted and actual local government General Fund revenue components used in the setting of FY2025 tax rates. They may be seen numerically and graphically for your community using Category Four of the Division of Local Services’ (DLS) Municipal Finance Trend Dashboard and in Data Visualizations. This article also provides local officials with recommendations and links for managing these components.
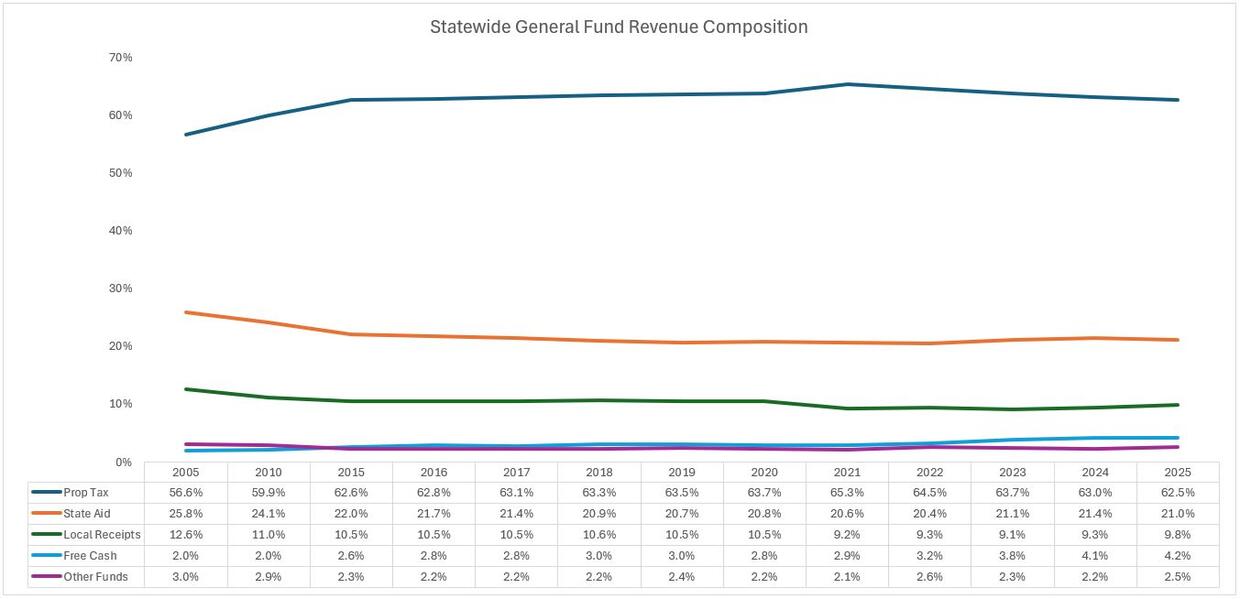
The local government revenue components focused on in this article are those reported on the Tax Rate Recapitulation form as belonging to the General Fund: Property Tax Levy, State Aid and Local Receipts and All Other, a category of various revenue sources, including reserves, that help support General Fund appropriations. Free Cash is pulled out from the All Other category to show it as its own revenue source. (Enterprise fund revenues and Community Preservation Act revenues are not included in this article.) The following graphs show these components statewide in total dollars and by percent of total budget to highlight composition changes by category.
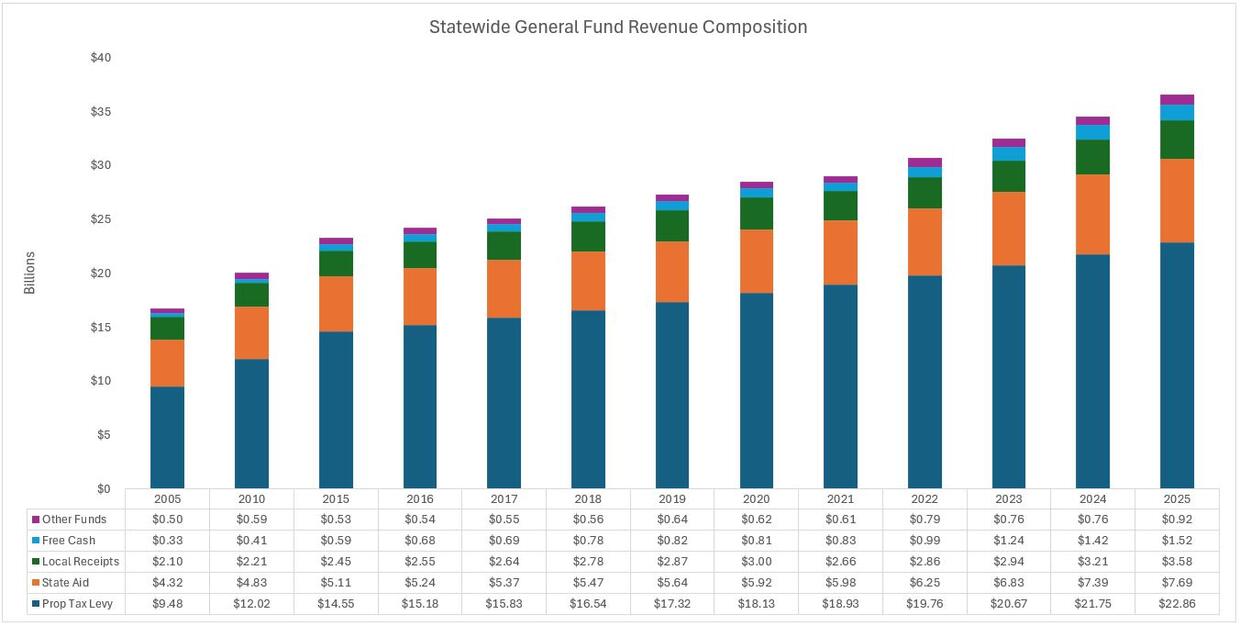
The Tax Levy (FY2025 - $22.8 billion, 62.5% of total)
The tax levy on real and personal property is the net amount remaining to fund the community’s budget after all other revenue components have been applied to support that budget. This tax is by far the greatest revenue component in almost every Massachusetts community. Over the past two decades, property taxes have grown from $9.5B to $22.8B; over the same period, as a percent of total General Fund revenue, it has grown from 56.6% to 62.5%. The statewide percentage reliance on the tax levy decreased between FY2024 and FY2025 from 63% to 62.5%. Details reveal that between these fiscal years, the tax levy as a percentage of all General Fund revenues decreased in 175 of 347 communities reporting to date. For those 175, further details show that a combination of Local Receipts and All Other, or All Other alone, were used in most cases to fill the revenue gap left by the Property Tax.
For all communities, the property tax levy is affected by (a) the limitations of Prop 2½ and (b) by the collection of unpaid property taxes or “outstanding receivables.” Outstanding receivables result in a revenue shortfall and are a negative factor in calculating spendable surplus, or “free cash,” place a fiscal stress on a community’s cash flow and add a further stress on other revenue components to compensate for the shortfall they create.
Recommendation
The greater a reliance on the property tax to balance the municipal budget, the greater the emphasis on (a) maximizing the levy’s Prop 2½ potential and (b) collecting Property Tax outstanding receivables. DLS offers videos and tips on numerous facets of Proposition 2 ½ in the Training & Resource Center, including how to maximize the tax levy’s potential by properly calculating and reporting new and revised growth and, if sought, how to present an override or exclusion vote to taxpayers. In addition, the previously mentioned Municipal Finance Trend Dashboard includes various Property Tax related metrics, including levy by class, new growth, excess capacity and average single family tax bills. DLS also offers collectors and treasurers guidance on enforcing collections and the tax taking process and the effects of non-payment of property taxes on free cash.
State Aid (FY2025 - $7.7 billion, 21.0% of total)
State aid is received mostly from the “cherry sheet,” named after the cherry-colored paper it was once printed on. It is the Commissioner of Revenue’s notification of estimated state aid and assessments that are used in calculating the annual tax levy later in the fiscal year.
Budget officials rely on estimates included in the Governor’s budget recommendation to the State Legislature when preparing their local budgets, but the cherry sheet is not official until the final State budget is approved. Cherry sheet revenues include formula driven distributions, incurred cost reimbursements and specific expenditure offsets. For FY2025, 12 aid items were funded, with approximately 95% of the total coming from Chapter 70 public school funding aid and Unrestricted General Government Aid (UGGA).
Cherry sheet revenues are distributed net of cherry sheet assessments that totaled $1.4 billion in FY2025 and included the county tax, charter school assessments, state assessments for services such as the MBTA, and certain other charges. Follow this meaningful link to review trends in Cherry Sheet aid and assessments by program.
Over the past two decades, State Aid has grown from $4.3B to $7.7B; over the same period, as a percent of total General Fund revenue, it has decreased from 25.8% to 21%. The Statewide percentage reliance on State Aid decreased between FY2024 and FY2025. Details reveal that between FY2024 and FY2025, State Aid as a percentage of all General Fund revenues decreased in 215 of 347 communities reporting to date, remained the same in eight and increased in 124. Further details revealed that this revenue source exceeded their Property Tax levy in 18 communities.
Recommendation
State Aid is dependent on many factors including economic indicators and the state’s economic health. Since much of this revenue is provided by distribution formulas over which the local government has no direct control, emphasis must be placed on amounts over which the local government does have control by completing the appropriate form(s) for receipt of State Aid reimbursements.
Estimated Receipts (FY2025 - $3.6 billion, 9.8% of total)
All funds received by a city or town per G.L. 44, § 53 belong to the general fund unless re-directed by law to another fund. Redirected funds are usually dedicated for special purposes but may be appropriated for general operating expenditures if allowed by law, thereby reducing the General Fund’s financial burden.
Local Receipts include motor vehicle excise (MVE), meals and room excises, fines and forfeits, fees, licenses and permits, other departmental receipts, penalties and interest on taxes and excises and investment income. They vary greatly in amount among communities and are normally based on actual amounts received in the current fiscal year adjusted by reasonably expected increases or decreases.
Earlier this month, City & Town published Understanding and Analyzing Local Receipts, an excellent presentation filled with charts and tables revealing statewide Local Receipt estimates and actuals up to FY2025. Actual FY2025 receipts will not be known until later this calendar year when FY2026 tax rates are being set. Interesting to note from the article was the consistency of Motor Vehicle Excise, the recent surge of Investment Income and the importance of Building Permits and Meals/Room excise taxes. Also, make sure to check out the Trends in Local Receipts dashboard.
Over the past two decades, Local Receipts have grown from $2.1B to $3.6B; over the same period, as a percent of total General Fund revenue, they have decreased from 12.6% to 9.8%. Some of this is due to municipalities changing how they account for Water/Sewer Charges and Other Charges from the General Fund to Enterprise Funds.
Recommendation
Local fee structures should be reviewed annually as part of the budget process to ensure that they are set at levels that most accurately cover costs associated with the service for which the fee was assessed. This revenue source should be budgeted conservatively and municipalities should not simply take last year’s actual and use it, as changes in the overall economy could impact that amount. Their estimation requires a strong financial team working together. Such a team:
- may include the CEO, CFO, accountant, assessor, treasurer, collector, clerk and school business manager
- can serve as a forum to review the community’s fiscal status
- can identify critical junctures and offer strategies to deal with anticipated fiscal events and areas of concern
- can enhance lines of communication
It should be noted that, along with unspent appropriations from operations, surpluses in Local Receipts are positive factors in the calculation of Free Cash.
Free Cash (FY2025 - $1.5 billion, 4.2% of total)
Free Cash is a revenue source that results from the prior fiscal year’s operations and can only be used after certification by the Bureau of Accounts (BOA). Once certified, it may be appropriated by majority vote of the community’s legislative body for any lawful purpose. It can also be appropriated for a specific expenditure or to reduce the tax levy.
Over the past two decades, the use of Free Cash has increased from $334M to $1.5B; over the same period, as a percent of total General Fund revenue, it has increased from 2% to 4.2%. Make sure to check out Category 1 of the Municipal Finance Trend dashboard and the Free Cash Use dashboard for additional data related to free cash.
All Other (FY2025 - $916M, 2.5% of total)
All Other revenue components are not otherwise categorized and include the general stabilization fund, specific reserve funds, declared Overlay surpluses and budget transfers.
The general stabilization fund, the largest All Other component, may be appropriated for any lawful purpose and requires:
- a two-thirds vote of the community’s legislative body to create the Fund
- a majority vote of that body to deposit into the fund and
- a two-thirds vote of that body to expend from the fund
A special purpose stabilization fund also requires a two-thirds vote of the legislative body to create the fund, a majority of that body to deposit into the fund, but only a majority vote to appropriate from the fund. Special purpose stabilization funds may be appropriated for a particular purpose, although that purpose may be amended by the community’s legislative body. Details for FY2025 revealed that Stabilization funds that were identified represented $293.7 million or 32% of the All Other revenue component.
Over the past two decades, these funds have increased from $504M to $916M; over the same period, as a percent of total General Fund revenue, they have decreased from 3% to 2.5%.
Comparing Revenue Components to Inflation
The final table looks at the growth of budgeted revenue components compared to inflation over the past ten fiscal years.
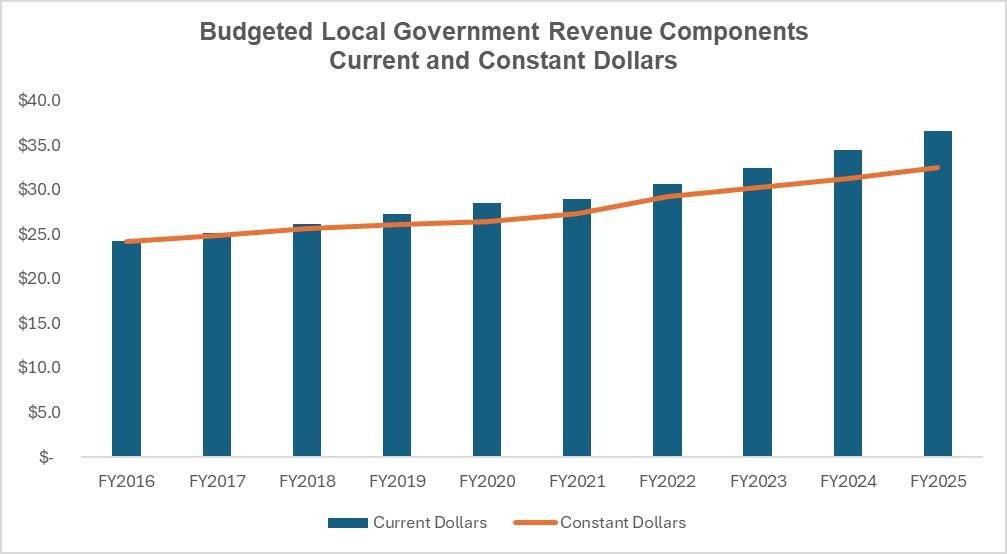
Details for the period shown in the above graph reveal that current dollars (actual) grew by 51%, from $24.2 billion to $36.6 billion, while in constant dollars (inflation adjusted) grew by 34%, from $24.2 billion to $32.5 billion. In effect, for the period shown, the cost of running local government operations in current dollars from available revenue components increased at a greater pace than the rate of inflation in constant dollars.
Helpful Resources
City & Town is brought to you by:
Editor: Dan Bertrand
Editorial Board: Tracy Callahan, Sean Cronin, Janie Dretler, Jessica Ferry, Emily Izzo, Christopher Ketchen, Paula King, Jen McAllister and Tony Rassias
| Date published: | April 17, 2025 |
|---|