Sediment mapping is the process of determining the character of the surface of the seafloor and includes mapping the relative quantities of mud, sand, gravel, cobble, and boulder. CZM's Seafloor and Habitat Mapping Program collects data on seafloor sediment—either directly through field work or from published reports—and works with partners such as the U.S. Geological Survey (USGS) Woods Hole Coastal and Marine Science Center to interpret these data. When used in conjunction with acoustic data (e.g., sonar data), scientists can create maps showing regions of the seafloor that have similar characteristics. CZM uses these data to help develop potential habitat maps, identify and evaluate areas for protection, and inform decisions about how and where to best site new ocean development.
This page provides information on the following CZM sediment mapping activities:
- CZM-USGS Seafloor Mapping Cooperative
- Seafloor Sediment Database
- Seafloor Sediment Classification System
- USGS Seafloor Sediment Interpretive Mapping
CZM-USGS Seafloor Mapping Cooperative
In 2003, CZM and the USGS Woods Hole Science Center initiated a Seafloor Mapping Cooperative to jointly address the need for data and information characterizing seafloor resources. The goal of the cooperative is to comprehensively map the bathymetry (water depth) and geology of the seafloor inside the 3-nautical-mile limit of Massachusetts waters and in adjacent federal waters.
As of 2012, the cooperative has mapped 2,200 square kilometers of Massachusetts marine waters and has published or is preparing to release these data as USGS Open-File Reports and Data Releases. Geophysical data, including bathymetry, acoustic backscatter (a measure of seafloor hardness and roughness), and seismic-reflection profiles (pictures of sub-surface sediment layers), have been collected in these areas. In addition, seafloor sediment samples and photographs/videos of the seafloor were gathered to validate the geophysical data. These data have also been used to create interpretive data products such as maps of seafloor bottom types, seafloor sediment depth to bedrock, and physiographic zones (a term used by geologists to define regions of the seafloor based on morphology and sediment types).
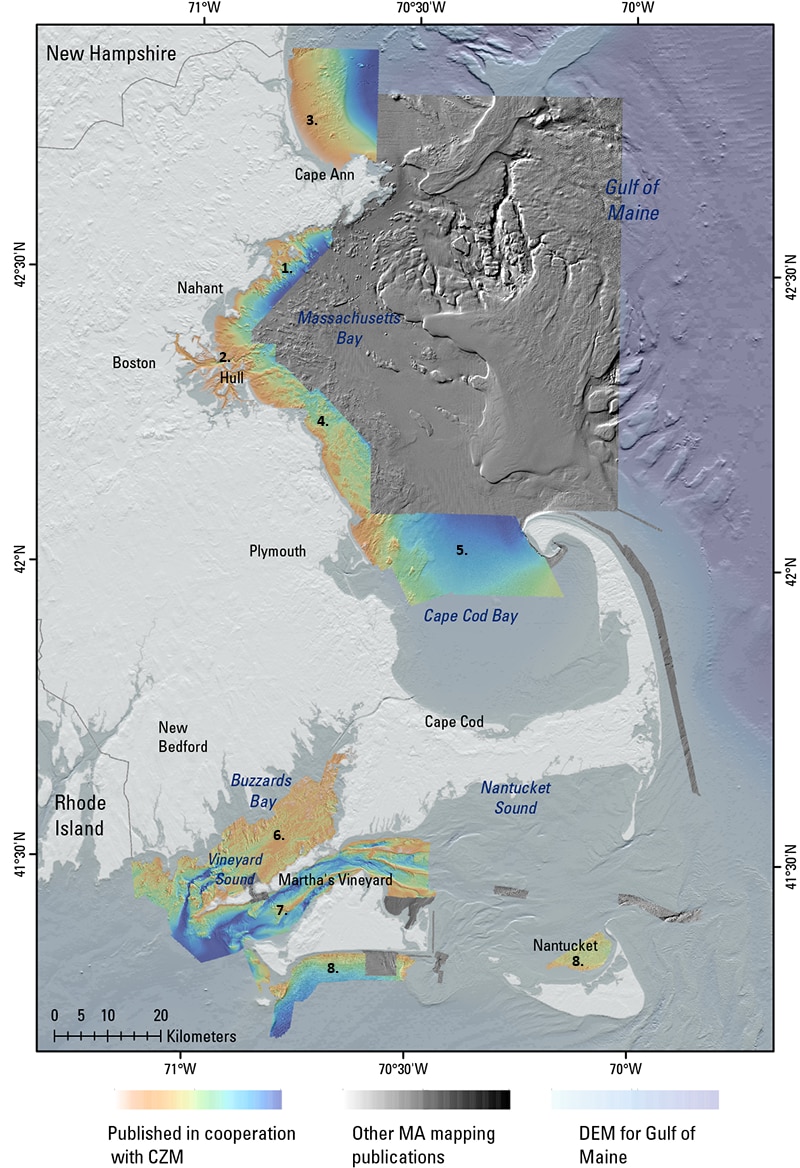
Areas mapped by the CZM-USGS Seafloor Mapping Cooperative from 2003-2015. Completed areas and dates of publication of USGS Open-File Reports are: 1) Nahant to Gloucester (2006), 2) Boston Harbor and Approaches (2006, 2013), 3) Cape Ann to Salisbury Beach (2009), 4) Duxbury to Hull (2010, 2013), 5) Northern Cape Cod Bay (2010, 2013), 6) Buzzards Bay (2012a, 2012b, 2013, 2014, 2015a, 2015b), 7) Vineyard Sound (2012, 2013, 2014, 2015), and 8) South of Martha’s Vineyard and north of Nantucket (2016).
The USGS Geologic Mapping of the Seafloor Offshore of Massachusetts website contains brief descriptions of the mapping projects and links to online versions of the Open-File Reports, Data Releases, and geographic information system (GIS) data for the study areas.
Seafloor Sediment Database
Thousands of seafloor sediment samples have been collected in Massachusetts marine waters by several different data providers. Recognizing the value of having these separate datasets stored in a consolidated database, the Massachusetts Division of Marine Fisheries (MarineFisheries), in collaboration with CZM, combined these data into a comprehensive database of seafloor sediment grain-size data for Massachusetts. This database includes sediment samples from USGS's usSEABED dataset, CZM-USGS Seafloor Mapping Cooperative, MarineFisheries surveys, U.S. Environmental Protection Agency (EPA) National Coastal Assessment, Massachusetts Water Resources Authority (MWRA), National Oceanic and Atmospheric Administration (NOAA) National Ocean Service, research surveys conducted by CZM/MarineFisheries/USGS on the EPA's Ocean Survey Vessel (OSV) Bold, and many others. The Massachusetts seafloor sediment database is constantly being augmented and currently contains nearly 50,000 points within a 10-kilometer radius of the Massachusetts coastline. For more information on the methods used to create the database, please see the MarineFisheries Technical Report TR-45: Seafloor Sediment Composition in Massachusetts Determined Using Point Data (PDF, 2 MB). To download the database, please visit the NOAA National Geophysical Data Center.
Seafloor Sediment Classification System
Sediment grain-size data can be classified using a number of different classification schemes, such as those developed by Folk, Shepard modified by Schlee, UKSeaMap, or more recently, NOAA’s Coastal and Marine Ecological Classification Standard (PDF, 8 MB) (CMECS). CZM is currently using a classification scheme first published by Barnhardt et al. This classification scheme is well suited to CZM’s program needs largely because of its straightforward utility in communicating the nature of the seafloor sediment (e.g., the first letter of the class is the majority grain-size component and the second letter is the minority component) and because of its capacity to readily identify areas of “rock” (cobble and boulder), a substrate class that is mapped and protected as Hard/Complex Seafloor “Special, Sensitive, or Unique” habitat in the Massachusetts Ocean Management Plan.
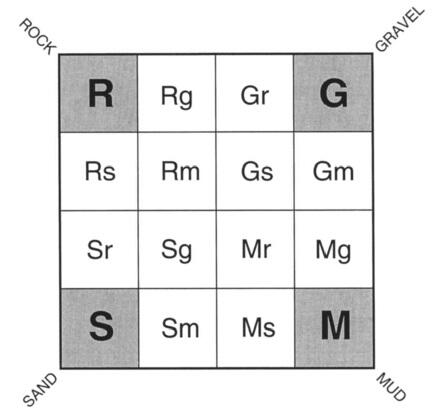
CZM uses the Barnhardt et al. (1998) seafloor sediment classification scheme. The four corner classes have ≥90% of that particular sediment type. To create composite classes, the first letter is the majority grain-size component of the seafloor sediment and the second letter is the minority component.
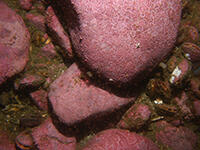
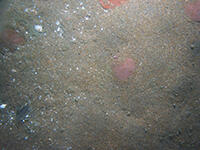
Examples of the different seafloor types found in Massachusetts ocean waters are provided below:
| Rock | Rock with Sand | Gravel |
|---|---|---|
| Sand | Sand with Mud | Mud |
Click to open full size image (PDF, 1 MB). | 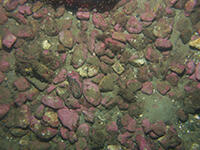
Click to open full size image (PDF, 2 MB). | 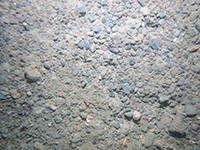
Click to open full size image (PDF, 1 MB). |
Click to open full size image (PDF, 1 MB). | 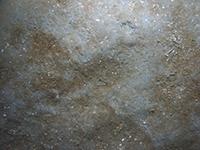
Click to open full size image (PDF, 1 MB). | 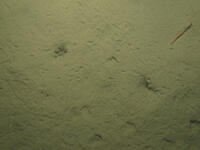
Click to open full size image (PDF, 1 MB). |
USGS Seafloor Sediment Interpretive Mapping
As part of the CZM-USGS Seafloor Mapping Cooperative, USGS is delineating areas of similar seafloor sediment texture for much of Massachusetts marine waters. Using several datasets, including (A.) the Massachusetts seafloor sediment database (which contains grain-size data for thousands of locations), (B.) detailed bathymetry (which can be used to derive seafloor features such as crests, plains, and basins), and (C.) acoustic backscatter (which can be used to estimate the seafloor hardness), USGS staff are creating an interpretive map of substrate types (D.). Sediment maps are classified using the Barnhardt et al. (1998) scheme in which the dominant sediment type is denoted by a capital letter and the minority sediment type, if there is one, is denoted by a lower case letter. In the map below, the large blue swath in Cape Cod Bay is M for mud. The lighter blue to the left is Ms, mud with sand.
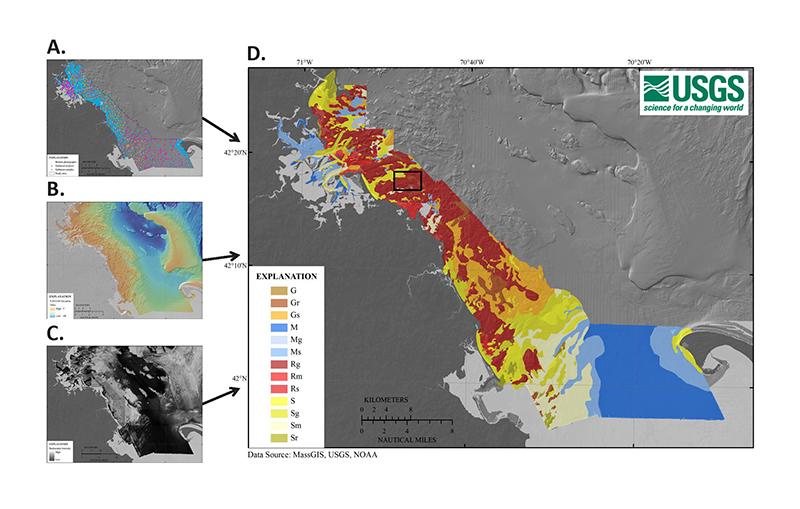
An example of how USGS uses (A.) sediment, (B.) bathymetry, and (C.) backscatter data to create seafloor sediment maps (D.) in Massachusetts (maps from USGS Open-File Report 2012-1157). The area mapped stretches from Provincetown to Nahant. Click to open full size image (PDF, 608 KB).