The CZM StormSmart Coasts Program developed the Sea Level Rise and Coastal Flooding Viewer to support the assessment of coastal flooding vulnerability for community facilities and infrastructure. The viewer includes interactive maps of flooding associated with static sea level rise scenarios (National Oceanic and Atmospheric Administration [NOAA]), dynamic future storm surge (Woods Hole Group), current worst-case hurricane surge (U.S. Army Corps of Engineers [USACE]), and areas within the Federal Emergency Management Agency (FEMA) coastal flood zones.
The following community facilities and infrastructure were mapped: airports, community health centers, commuter rail and subway stations, courthouses, dams, electrical generation facilities and substations, electrical transmission lines, energy facilities, fire stations, harbormaster's offices, hospitals, landfills, libraries, long-term care residences, police stations, port facilities, prisons, public colleges and universities, public water supply sources, schools, town/city halls, U.S. Coast Guard facilities, wastewater treatment plants, and water supply protection areas and wellheads. Some public facilities and infrastructure located inland of mapped coastal flooding areas are not included in the viewer.
The online viewer includes these sections:
- Introduction - The first tab in the viewer provides an overview of the tool with tips for navigating the maps.
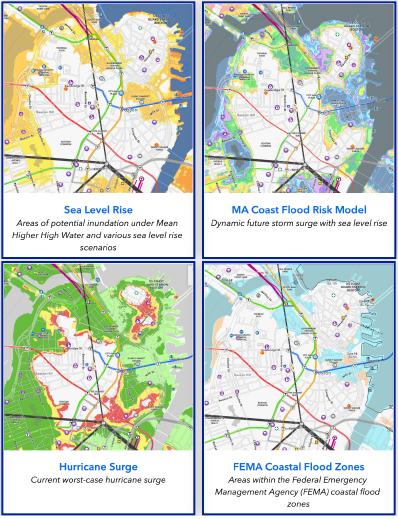
- Sea Level Rise - The interactive map in the Sea Level Rise tab shows NOAA’s prediction of coastal flooding above Mean Higher High Water (MHHW, the average height of daily highest tide) with six increasing levels of sea level rise up to six feet. This static “bathtub” model does not account for storm surge, waves, erosion, and other dynamic factors. See the Sea Level Rise Scenario figure (PDF, 155 KB) for a visual representation of the information depicted on the map. For information on sea level rise projections for Massachusetts, see Appendix B of the 2022 Massachusetts Climate Change Assessment (PDF, 2 MB).
- MA Coast Flood Risk Model (MC-FRM) - The interactive map and associated scenarios in the MC-FRM tab display extents and depths of flooding produced for 2030, 2050, and 2070. The future time horizons account for sea level rise due to continued high emissions of greenhouse gases and storm surges associated with coastal storms (hurricanes and northeasters).
- Hurricane Surge - The interactive map in the Hurricane Surge tab includes four worst-case scenarios of storm surge based on thousands of modeled combinations of hurricane intensity (Category 1-4), forward speed, track or direction, and other factors not including sea level rise. NOAA’s National Hurricane Center, in partnership with the USACE, uses the Sea, Lake, and Overland Surges from Hurricanes (SLOSH) model to calculate storm surge and map coastal areas with the highest degree of exposure for emergency management.
- FEMA Coastal Flood Zones - The interactive map in the FEMA Coastal Flood Zones tab displays coastal areas with a current 1% annual chance of flooding (AE and VE zones) and 0.2% annual chance of flooding. FEMA maps these high-hazard flood zones using historical data for frequency and severity of storm tides. This map does not account for sea level rise or future coastal storm conditions.
- About - The final tab summarizes the tool and provides links to related CZM resources and tools.
The community facilities and infrastructure shown in the viewer are identified with a symbol. Clicking on the symbol opens a pop-up box with the facility name and other pertinent information.
Launch the online viewer to access the interactive maps.
The viewer was designed as a general vulnerability assessment and planning tool. This product should not be used for permitting, legal, engineering, navigation, or surveying purposes. Site-specific assessments of elevations or boundaries (parcel, structure, or other) should be made by a certified survey professional.
Contact Information
For coastal shoreline and floodplain management questions, contact Julia Knisel at julia.knisel@mass.gov.
For mapping and data questions, contact Dan Sampson at daniel.sampson@mass.gov.