1. Transportation infrastructure such as roadways, bridges, and culverts are an area of primary conc
a. Chapter 90 Program
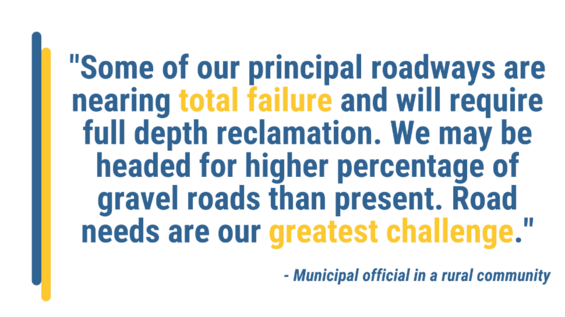
One of the areas of greatest concern among the surveyed communities is roadway maintenance. Respondents were asked to rate their roadways on an A to F scale; 27 rated their roads a C, 8 rated them a B, and 9 rated them a D. Notably, no respondent rated his/her community’s roads to be totally failing with an F rating, nor highly rated with an A rating.106 Comments from the respondents, however, indicate a different side of the story, noting their transportation infrastructure is not well-maintained. The following comment summarizes the perception of multiple town officials:
Forty responses included comments of this type, indicating deep needs for funds for paving dirt or gravel roads, fixing drainage problems associated with roadways, and addressing bridges and culverts. However, when we asked for information about cost sharing between the state’s Chapter 90 Program and municipal spending on roadways, we learned that, on average, communities obtained 63% of their roadway funding from the state and just 37% from local sources. There were seven communities that indicated that greater than 90% of their road maintenance comes from Chapter 90 funding, and two of the seven communities indicated that Chapter 90 funds account for their entire roadway maintenance budget.
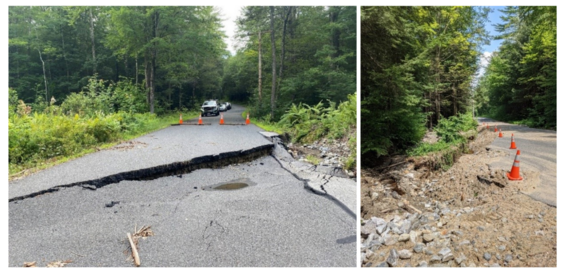
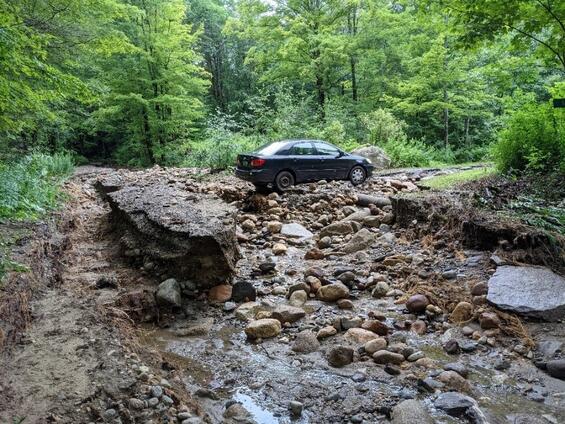
Damage to a road in Warwick (Franklin County) from a storm in July 2021 (left) and damage to Route 78 in Warwick (right). (Left photo courtesy of the Office of Senator Jo Comerford; right photo courtesy of Brian Snell, Warwick Selectboard member)
Although western towns rely on the Chapter 90 Program to help finance their roadways, they are disadvantaged by the allocation process set by the program. The funding allocation a community receives from the Chapter 90 Program is determined by a formula that uses weights based on population, employment (number of jobs within the town), and road miles to determine a final appropriation to a municipality. Currently the weights for the program are road mileage (58.33%), population (20.83%), and employment (20.83%).107 These weights tend to disadvantage smaller communities, which do not have a large population or employment base. Although many western municipalities have extensive roadway networks, their significantly smaller population and employment base adversely influence their Chapter 90 allocations. As shown below in Figure 15, the average Chapter 90 allocation per roadway mile in fiscal year (FY) 2021 in the western counties is lower than average across the state.108
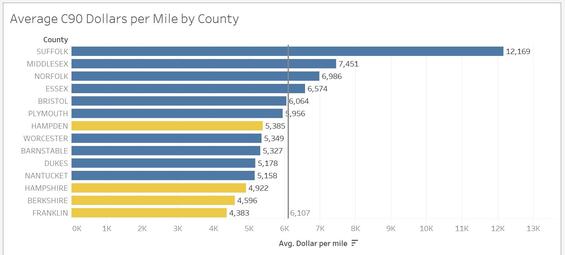
Figure 15—Average Chapter 90 Funds per Roadway Mile, by County, FY 2021
Furthermore, the Chapter 90 formula tends to heavily favor the city of Boston, in Suffolk County, as it has the highest population in the state, most road miles, and largest labor market, including many people who live outside the city yet work there. On average, this funding formula tends to allocate more funds into Eastern Massachusetts communities than into Western Massachusetts, as displayed in Figure 16.
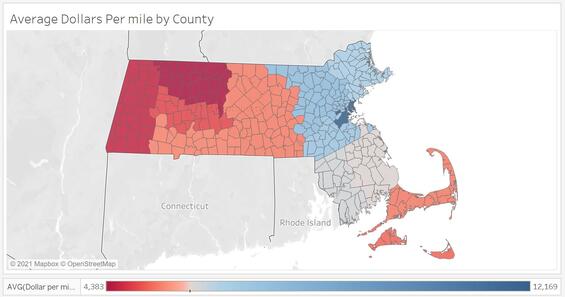
Figure 16—Average Chapter 90 Funds per Roadway Mile, by County, FY2021
This disparity in funding leads to roadways in Western Massachusetts crumbling because of a lack of maintenance; lessens the quality of transportation networks there; and lowers the quality of life because of the challenges of moving people, services, and goods. This pattern is seen in Springfield, by far the largest community in Western Massachusetts, with a heavy dependence on Chapter 90 funds for roadway maintenance. Additional context about Springfield’s infrastructure disparities and its comments are contained in Appendix E.
In addition, there are limited sources of funding for unpaved, dirt, and gravel roads available for Western Massachusetts communities, especially after major storms and floods in the region that wash out these roads. Unpaved roads are eligible for some Chapter 90 funding to repair flood and frost damage but not for routine maintenance.109 Municipalities can also use Small Town Road Assistance Program (STRAP) grant assistance to upgrade roads to better serve residents and promote economic development, but funding is more difficult to obtain.110
Damage to Chestnut Hill Road in Warwick (Franklin County) from a storm in July 2021. (Photo courtesy of Brian Snell, Warwick Selectboard member)
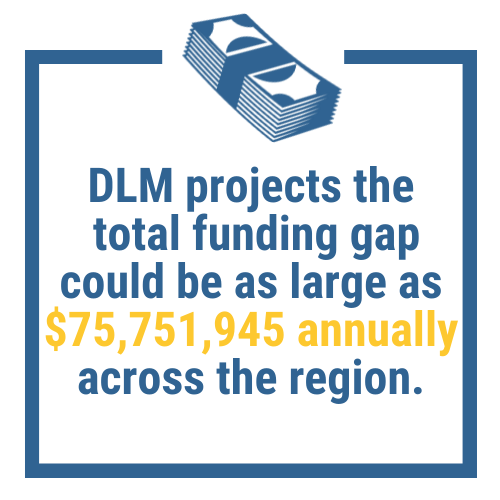
We also asked communities to assign a dollar figure to the gap between what they spend and what they perceive to be the amount needed to adequately maintain their roadways each year. Among the 44 respondents who answered this question, the median annual gap was $312,500. Pittsfield, which had the largest funding gap,111 indicated it would need $3.2 million each year to provide adequate roadway maintenance. The total annual funding gap among all respondents is $31,044,000. When this number is projected across all 101 communities based on population, DLM projects that the gap could be as large as $75,751,945 annually across the region.112 The Massachusetts Municipal Association, which has consistently advocated for a funding amount of at least $300 million annually,113 estimates that there is an annual total investment of $588,391,743 needed to have all roads across the Commonwealth brought to a state of good repair, meaning there is an annual funding gap of $388,391,743 between the current appropriation level and funding need.114
Deferred investment and chronic underfunding of the Chapter 90 Program has caused this gap to grow, and it will continue to do so without further investment from the state. Even when considering new programs such as the Municipal Pavement Program and the State-Numbered Road Program that may offer additional resources towards roadways, there is still a substantial gap between available resources and local need. A $300,000,000 Chapter 90 funding level will represent an important step towards meeting these needs.
MassWorks and STRAP
Other state-level programs focused on infrastructure development are stressed resources and have administrative and fiscal constraints that lessen their impact. In particular, STRAP, which helps build out roadway infrastructure, has a limit on its spending as a part of the larger MassWorks program. In the FY 2020 award round for these programs, the $9,183,000 in STRAP Program awards represented 13.48% of the total $68,118,000, with MassWorks awards making up the remaining $58,935,000 (86.52%).115 Western Massachusetts communities apply to STRAP at a higher frequency than those in other parts of the state. For example, in the FY 2020 award round, 25 (65.79%) of the 38 STRAP applications came from Western Massachusetts, while only 13 (34.21%) came from the rest of the state. Of the 9 STRAP awards distributed in FY 2020, Western Massachusetts communities received 5 awards.116 As seen below in Figure 17, targeted investments into smaller communities through STRAP are a fraction of the MassWorks total and are insufficient given the large gap between requests and awards.

Figure 17—FY 2020 MassWorks and STRAP Project Award Amounts

Figure 18—FY 2020 MassWorks and STRAP Project Award Amounts for Western Massachusetts
Bridges and Culverts
A particular challenge for communities are the numerous bridges and culverts in Western Massachusetts. For example, one road in Berkshire County has approximately 200 culverts, which dramatically increases the maintenance and replacement costs for the communities that maintain it.117 In comments from survey respondents, we were informed that, although many respondents were aware of state funding for small bridges and culverts, they felt that these resources were stressed and did not have enough funding to meet the need. For example, the maximum grant award from the Municipal Small Bridge Program ($500,000) constrains bridge projects from being fully funded at all stages, from design and permitting to construction. According to historical project data obtained by the Massachusetts Small Bridges and Culverts working group, construction expenses under the program have ranged between $300,000 and $1.2 million, and the median construction cost was $680,000 as of May 2019.118As one respondent stated,
The state has tried the small bridge and culvert programs. They would be more helpful if they had more funding. It can cost $50,000 - $100,000 or more to just engineer and permit a good sized culvert - then it can cost hundreds of thousands more to actually build. There just isn’t enough funding in these well-meaning, competitive programs to fund all the needed infrastructure in Western [Massachusetts].
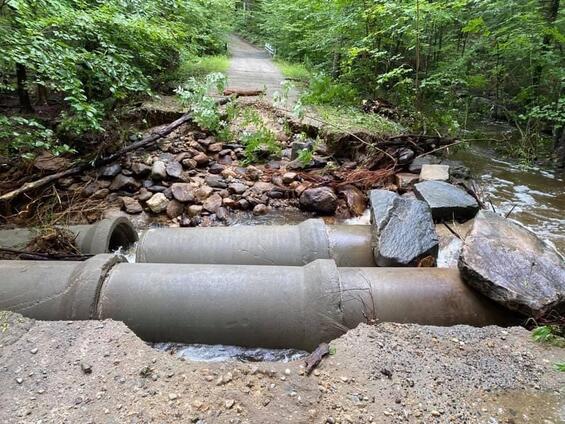
Flagg Road in Orange (Franklin County) after storms in July 2021. (Photo courtesy of the Office of State Representative Susannah Whipps)
Another program, the Culvert Replacement Municipal Assistance Grant Program from the Department of Fish and Game’s Division of Ecological Restoration, is also wholly inadequate to meet demand from communities. In FY 2021, for example, applications for the program totaled nearly $6.9 million.119 However, awards for the program in that fiscal year, as shown below in Figure 19, totaled $806,880. The five awards to Western Massachusetts in FY 2021 totaled $254,000, shown below in yellow.
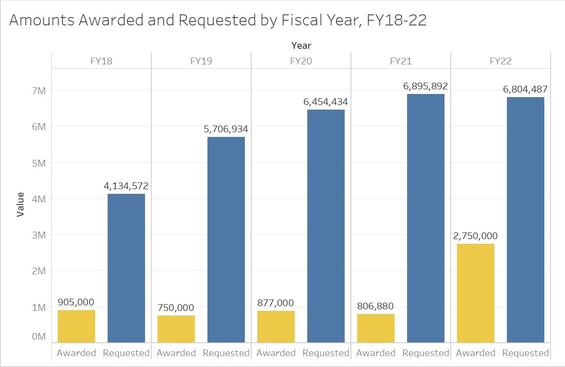
Figure 19—FY 2018–2022 Culvert Replacement Grant Awards and Requests.
The Nilman Road culvert in Buckland is a good example of a project that had difficulty securing sufficient funding from state sources. According to stakeholders, the Nilman Road culvert is in need of critical replacement before the upcoming winter, as multiple households at a dead-end road are required to cross the culvert, and large trucks and public safety vehicles are hesitant to cross it.120 Although the town was able to secure the maximum grant from the Municipal Small Bridge Program, officials are waiting for $625,000 in bonds to be released by the Commonwealth after being authorized in the state’s FY 2021 transportation bond bill.121 The town of Buckland is moving ahead with the project in order to avoid further deterioration or collapse of the culvert but may have to turn to short-term emergency borrowing if the bonds are not released.122
Transportation Improvement Project Program
Roadway, bridge, and culvert projects are particularly challenging for many small communities that do not have professional planning or engineering staff, making preparatory work such as studies, designs, permitting, and granting often unattainable. In Franklin County, for example, there are only three towns, out of all 26 communities, that have planning staff.123 Without professional staff members to provide technical expertise to help a municipality access state or federal funds, many projects are not pursued in order to limit the community’s financial risk in hiring experts to prepare a grant application. One survey comment illustrates this situation, stating:
In discussions with regional planning agencies, we discovered that there are actually not enough applications for available federal Transportation Improvement Program (TIP) funding, causing these funds to be diverted for county and state use instead.124 Regional planning officials attributed this lack of applications to design and technical requirements that many small communities do not have the capacity to meet, leading them to forego federal TIP funding to focus on maintenance of existing infrastructure.125 Currently, the Massachusetts Department of Transportation requires municipalities to fund design, engineering, and right-of-way costs for eligible TIP projects in order to demonstrate local commitment and buy-in. As TIP funding is a multiyear process, design requirements can change and many communities believe that it is not worth the risk in applying, investing in designs and studies, and having to change the designs as requirements shift. Communities may also not be willing to risk guaranteed infrastructure funding, such as Chapter 90 funds, on designs or studies for TIP funds that might not be provided. Planning officials also feel that funds from the Unified Planning Work Program, which provides resources to identify regional planning priorities on an annual basis, are not keeping pace with TIP funding, resulting in a situation where planning work is not available to unlock TIP funds.126
The complexity and inadequacy of these programs, as well as the intensive preparatory work in designs, studies, and engineering required to participate in them, diminish the value of these funds for communities and make them a less-than-attractive option for infrastructure development.
2. Continued investment in high-speed broadband is critical to the success of the region.
A consistent theme in discussions with stakeholders throughout the region is the inadequacy of broadband internet access. Fast and reliable broadband is necessary to support community efforts to amplify education and commerce and to spark job creation and population growth. Nationwide, during the 2019 coronavirus pandemic, as children studied from home and offices were closed, the availability of high-speed broadband became a focus of policymakers. In many of these communities, cellphone service is poor or completely unavailable and not a substitute for broadband.127 Stakeholders have shared anecdotes of families commuting to libraries, town halls, or private businesses to use wireless internet because their homes do not have access.128 However, the lack of population density in Western Massachusetts diminishes the incentive for private firms to supply a robust service. The Commonwealth’s initiative, the Massachusetts Broadband Institute (MBI), has provided funding for 53 projects, with 50 projects on track to be completed by the end of FY 2022. Of these, 26 projects are run through municipally owned networks.129
Because of the increasing centrality of the internet to modern life, many communities feel they must invest in broadband networks for their long-term survival.130 With total expenditures of over $100 million, including about $90 million in state and federal funding, the investment in broadband is significant.131 However, the rapid change in technology will require continued investment in parts of Western Massachusetts that present an uncertain return on investment for the broadband firms.
Under their agreements with MBI, private broadband firms have to provide service and assume risks for at least 10 years. MBI has determined that a broadband network generates revenue once 70% of consumers in a coverage area are on their network. Of the towns that have completed broadband projects, only one town is short of meeting this goal.132 However, because of the young age of these networks, it remains to be seen if significant financial investments are sustainable in the long term.
Although continued investments in broadband may alleviate some of these issues, concerns still exist over broadband speeds, as detailed in the “Situational Analysis” section of this report.133 Without broadband networks, communities would not be viable as places to live, start a business, or raise a family, threatening their survival.
3. Lack of infrastructure investment undermines businesses and economic development.
In conversations with business groups and state officials, DLM has learned that macro-level trends, such as lack of broadband and a nonspecialized workforce, contribute to issues with attracting businesses to Western Massachusetts.134 The lack of broadband access is a weakness for the materials manufacturers and suppliers that could benefit from infrastructure projects. Broadband connects them to supply chains, labor, and markets for their goods. Compounding this issue is a geographic disconnect in Western Massachusetts between jobs and workers, because of the dispersion of population and the distance between urban areas.135 Without local materials suppliers, contractors working on public infrastructure may source materials from Eastern Massachusetts or out of state, out of necessity or cost considerations.
4. Many communities have outdated municipal buildings that are in need of replacement or significant
Public Safety and Communications Facilities
Another notable area of concern amongst stakeholders and survey respondents are public safety buildings. Public safety buildings have both the highest (25 A’s and B’s) and the lowest (13 D’s and F’s) ratings on the survey. Breaking down the comments, the concerns are equally distributed between fire and police facilities, which need periodic updating as new technology emerges, making them costly expenses. Police stations require specialized equipment (such as suspect intake and transport) and spaces (such as evidence storage and training rooms). Over the years, fire equipment has become larger and frequently has outgrown space allotted to it. In some communities, a public safety facility may be almost 100 years old and therefore has long outlived its useful life.

The booking desk at the Pittsfield Police Department (Berkshire County). Note: Since this photo was taken in 2011, the hardware on the desk has been updated, but other conditions still remain. (Photo courtesy of the Pittsfield Police Department)
Most respondents identified a public safety facility in their municipalities in need of substantial renovation or replacement. One respondent noted,
These sentiments are common among respondents. At least 23 of the 45 respondents noted that facilities were too small, inadequate for their use, or were shared with other municipal offices such as administration or public works. Of the respondents, 15 shared that they had at least one fire or police facility that was recently constructed, in the process of construction, or nearing project approval. However, many of these communities also noted that, though they might have a new fire station, they had an inadequate police station, or vice versa. One typical comment noted that the fire station was “[too] small for trucks [and had no] bathrooms.” Other comments of this nature can be seen in Appendix D, which provides summary results from our survey as well as comments from the respondent communities.136
Respondents indicated that repair and renovation of public safety facilities cost approximately $16,720,549 each year.137 DLM projects, based on survey responses representing 41.09% of the population of Western Massachusetts, that it could cost as much as $40,689,359 annually to maintain or renovate public safety facilities across the entirety of Western Massachusetts.138
Compounding public safety facility issues are the varying states of police and fire communications facilities throughout Western Massachusetts. Some communities do not have any communication facilities because of weak information technology infrastructure, or they rely on other communities, such as Northampton, for their dispatching needs.139 Of the 45 responses, communities had mostly neutral or negative reviews of their communications facilities. Communities reported $2,500,000 in annual costs for repair and renovation of communications facilities, which, when extrapolated based on population, would be approximately $6,083,737 for the four western counties.140 This situation offers a major opportunity for the regionalization of dispatch services.
Public Works Buildings
A large share of respondents indicated that their public works facilities need to be replaced and/or to undergo major renovations because of building age and space issues. In our survey, 28 communities graded the status of their public works buildings as a C or below. Respondents identified problems with roofs; siding; heating, ventilation, and air conditioning (HVAC) systems; and storage space. For some communities, respondents indicated that public works buildings need to be replaced entirely and are in need of garage and administration space.
A few respondents indicated a need to update their transfer stations. One noted that his/her transfer station needed recapping, but this need has not been satisfied because of budget limitations. Another representative comment concerning these issues noted:
The Waste Water Treatment Plant [or WWTP] is in need of a major overhaul. Most of its systems are original, dating back to the 60s. Although there have been upgrades since then, overall the treatment facility has limited use of some of its components limiting its back up capacities, and therefore exposing it to risk in the event of a failure. The plant is in need of replacement/upgrade to bring the facility and its components up to speed in both technology and condition that will make it safe. Although the staff at our WWTP are extremely resourceful and skilled at making repairs, they can only do so much, and the time has come for a major rehabilitation expected to cost around $4 [million].
Among the communities that responded to the survey, annual expenditures for repair and renovation of public works facilities totaled approximately $41,813,175.141 Based on this figure and the population of respondent communities (41.09% of the regional population), DLM projects that the total annual expenditures on public works facilities for all four counties will cost approximately $101,752,118.142
However, $30,000,000 of the $41,813,175 total came from Great Barrington, representing a significant outlier in the data. Without Great Barrington included, the figure drops to $11,813,175. A projection based on the population of respondent communities, excluding Great Barrington (38.99% of the regional population), results in an annual figure of $30,300,133 for the 101 communities of Western Massachusetts.143 Of the 7 communities that indicated a need for replacement of these facilities, the total cost is projected to be $56,000,000.144
Administrative Offices and Other Facilities
Administrative office buildings continue the survey response pattern of a plurality of communities giving the status of their buildings mixed ratings, mostly rating facilities with a C. Many of these buildings are older or repurposed and are experiencing issues as a result of deferred maintenance. Frequent concerns raised for administrative buildings include HVAC systems, lack of office and storage space, and Americans with Disabilities Act compliance. Across the 45 respondents, representing 41.09% of the regional population, annual costs for repair and renovation of administration buildings total approximately $25,195,900, or a projection of approximately $61,314,076 across Western Massachusetts based on population.145
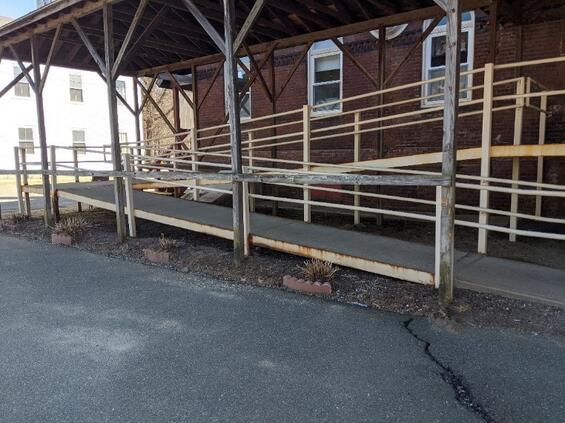
Rusting condition of the ramp at the Deerfield Regional Senior Center (Franklin County). (Photo courtesy of the Town of Deerfield)
The gap in funding has led to situations where buildings are becoming less useful. For example, in one community, the response indicated that “[radon] in the basement has rendered the space unusable for offices. [It is] just used as storage. [The] building foundation has leaks.”146 As illustrated in other comments, administrative buildings may be multipurpose in use, but not in design; some town halls also host police departments, libraries, and communications facilities. Like other forms of municipal infrastructure, administrative buildings are occasionally the subject of bond authorizations or legislative appropriations to fund capital projects, rather than having a dedicated revenue source.147 However, for these more general-use facilities, there are limited revenue sources that could help with capital improvements. One comment that details common issues shared, “The Town Hall is in satisfactory shape, but needs a new HVAC system and windows, as well as some other deferred maintenance typical for a 25 year old building.”
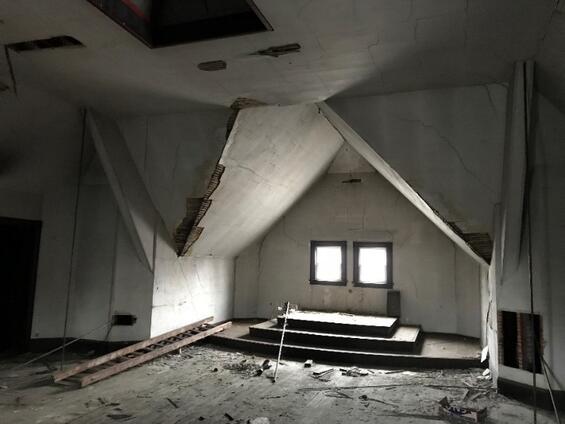
Deteriorating conditions of the attic space at the Deerfield Regional Senior Center (Franklin County). (Photo courtesy of the Town of Deerfield)
Other buildings have similar issues. Libraries and Council on Aging facilities in Western Massachusetts, for instance, are also more likely to be older and require accessibility modifications, HVAC updates, roof repairs, or other space needs. Library spaces range from a structure built in 1872 to a “tiny room in Town Hall,”148 according to one comment. Spaces for Council on Aging facilities across the region are also uneven—ranging from brand new facilities to shared spaces inside aging town halls. Eleven communities have their Council on Aging facilities inside their town halls.149
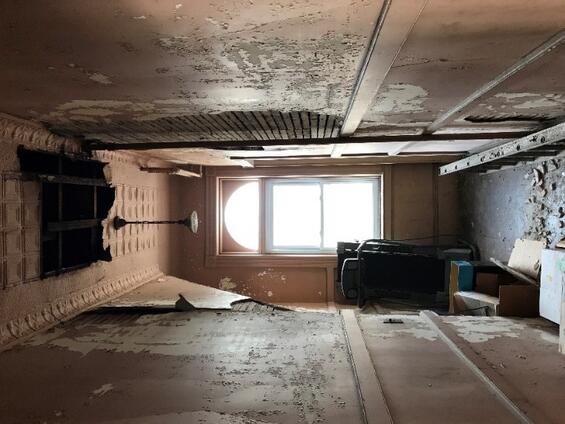
Deteriorating conditions of the upper floors of the Deerfield Regional Senior Center (Franklin County). (Photo courtesy of the Town of Deerfield)
Many libraries are also historic buildings, and there are limitations on repairs and renovations that can be made without changing the historic nature of the structure.150 Annual costs to repair and renovate libraries among respondent communities total $6,661,175. DLM projects, based on the 41.09% population represented amongst respondents that total annual library expenditures for Western Massachusetts will cost at least $16,209,931.151 Similarly, Council on Aging facilities would need $161,675 for renovation and repair amongst respondent communities, which would put a projection, based on the population of all western counties, at $393,436 annually.152 There is already some support for library facilities through the Massachusetts Board of Library Commissioners (MBLC), as detailed in the Situational Analysis section of this report. One comment that displayed a common sentiment among respondents noted that the “library needs a new roof and some heating system work that will be costly, and it is a historic building so all work is expensive and deferred.”153
Our survey also identified other municipal facilities that may need renovation and/or repairs in other communities. Necessary repairs included roof replacements, bathroom renovations, and infrastructure upgrades in recreation buildings, field houses, outdoor pavilions, and beach facilities. Communities’ garages, community centers, town museums, and armories are also among other municipal facilities in need of repair. Among these other facilities, expenditures for annual repair and renovation totaled $14,543,072. DLM projects that annual expenditures would be at least $35,390,482 across all communities in Western Massachusetts based on population.154
5. There is a lack of formalized support for most municipal buildings.
For most categories of municipal infrastructure, there is a lack of dedicated support from state or federal sources. The federal government made funds available in the late 1980s and early 1990s for public safety buildings. As mentioned earlier, the US Department of Agriculture (USDA) has a grant program for essential municipal structures in rural communities, but eligibility is restricted to the smallest, neediest municipalities, and grant awards do not cover all project expenses.155 At the state level, funds are sometimes made available for different municipal building projects through legislative appropriation, though these funds are only a few million dollars for individual communities.156 Funds for project design or construction are also included in state bond authorizations, such as the $1 million provided for the town of Heath in 2018.157 However, bonds authorized by the Legislature are not always issued by the Governor, and bond bill earmarks do not always receive funding. Additionally, these combined funding sources are insufficient to meet municipal needs. The concern of stakeholders in Western Massachusetts regarding their facilities reflects the limited resource base available for them and results in facilities that are too small, in various states of disrepair, and inadequate for modern municipal needs. Outside of school buildings, which have support from the Massachusetts School Building Authority, and libraries, which are supported by MBLC, there are no dedicated resources for municipal buildings. Bond authorizations and legislative appropriations provide some resources when funded but are unreliable and dependent on legislative and gubernatorial approval.
| Date published: | October 5, 2021 |
|---|