1. Infrastructure and Quality of Life
Poorly maintained roads, water main breaks that damage property and inhibit traffic, municipal buildings with leaking roofs and poor ventilation, and police and fire facilities inadequate for helping the public or maintaining safety—these are all examples of challenges caused by inadequate investment in public infrastructure. There is a recognized relationship between the equitable distribution of high-quality public infrastructure and the improvement of living standards. The investment itself acts as a direct economic stimulus and counteracts potential harms that come from lack of infrastructure development, such as lower productivity and reduced economic efficiency.4 According to the American Society of Civil Engineers, failure to properly invest in infrastructure could cost the national economy up to $4 trillion in gross domestic product by 2025 and reduce household income by up to $3,300 annually through the 2020s.5 A lack of infrastructure investment can also have cascading effects, such as power outages because of lack of electric infrastructure maintenance, lack of access to clean drinking water because of environmental hazards, and increased traffic congestion and automobile accidents because of poor traffic management and transportation investments.6
Such harmful effects are already being seen in Massachusetts. As noted in a 2020 report from the Massachusetts Small Bridges and Culverts working group, many small bridges and culverts are in a state of crisis.7 A state of disrepair among these structures, many of which are over five decades old, now contributes to “local flooding of roadways, public buildings, residences and businesses.”8 Additionally,
Flooding or failure of these structures also disrupts access for emergency services and can cause socio-economic impacts due to transportation disruptions. Access to businesses and schools as well as limited ability to transport goods and services quickly cause economic impacts.
Potential solutions outlined in that report, such as expanding technical assistance grants or providing financing options, all require investments in infrastructure to alleviate potential harms to Massachusetts residents.9
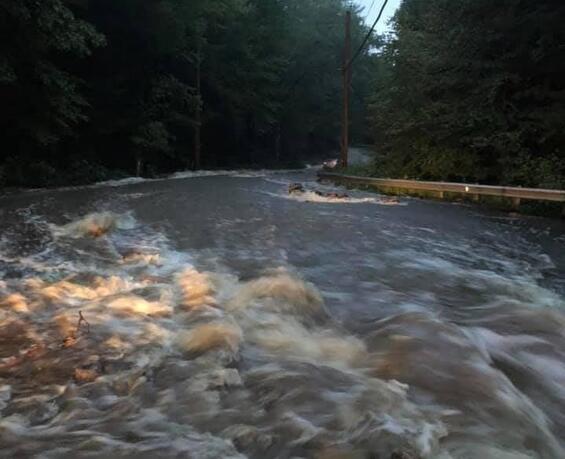
Flooding that occurred as a result of a July 2021 storm on Doane Hill Road in Royalston (Worcester County).
(Photo courtesy of the Office of State Representative Susannah Whipps.)
The American Society of Civil Engineers regularly issues scorecards assessing public infrastructure in an effort to raise awareness around infrastructure deficiencies. Its Massachusetts Infrastructure Report Card[1] notes the following:
Driving on roads in need of repair in Massachusetts costs each driver $620 per year, and 9% of bridges are rated as structurally deficient. Drinking water needs in Massachusetts are an estimated $12.2 billion. At least 328 dams are considered to be high-hazard potential. The state’s schools have an estimated capital expenditure gap of $1.39 billion. This deteriorating infrastructure impedes Massachusetts’s ability to compete in an increasingly global marketplace.
Without proper infrastructure maintenance and development, which is severely hampered by municipal finance restrictions, there are clear negative effects for businesses, residents, and households that devalue the quality of life in Massachusetts.
2. Municipal Finance in Massachusetts
General Principles
Municipal finance in Massachusetts is substantially governed by state-level laws and regulations that restrict municipal taxation. Proposition 2½, instituted in the early 1980s, is the most important law for municipal finance, as it places limits on how much tax revenue can be extracted from property wealth, even though property taxes are often the largest source of revenue for a municipality. Municipalities are further restricted to local-option and excise taxes that have been authorized by the state, such as restaurant meal taxes or vehicle excise taxes.11
A notable exception to these limits is new property growth, which can provide tax revenue above the limits of Proposition 2½.12 However, most new growth in Massachusetts since the Great Recession has been concentrated in the Greater Boston area, and there is very little, if any, property wealth growth in Western Massachusetts.13 This property effect is derivative of the real estate market; as more people look to work and live in the Boston area, properties there increase in value, while areas losing population in Western Massachusetts experience stagnation or a decline in value. This situation has led to a tale of two Commonwealths: one that is wealthy and growing, and one that is stagnating, or worse, caught in a downward spiral.
Since the economic pain of the Great Recession in 2008, the Massachusetts economy as a whole has grown by almost 50%.14 Yet, the four counties of Western Massachusetts have not experienced the booming recovery that is ongoing in the Greater Boston region. For example, the city of Boston had an 88.5% increase in total assessed property values between fiscal year (FY) 2010 and FY 2019. In Springfield, one of the metropolitan anchors of Western Massachusetts, growth was only 17.4% over the same period.15 As can be seen in Figure 1 below, in most Western Massachusetts communities there was either slight growth or negative growth in property assessments during this period. As municipal finance in Massachusetts is largely dependent on property taxes, stagnant or declining property values undermine a municipality’s capacity to raise revenues and increase investments in education, public safety, or infrastructure.
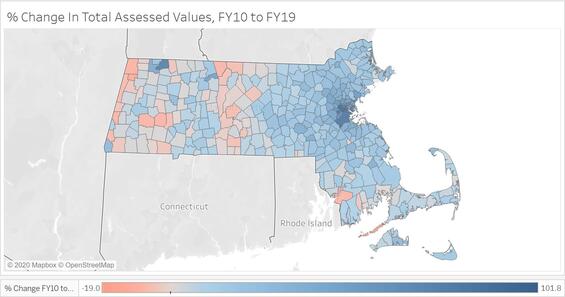
Figure 1—Percent Change in Total Assessed Values FY 2010 to FY 2019
Without new growth, and absent an override vote by the community, Proposition 2½ forces communities to stay at a 2.5% total tax levy increase on assessed properties and, therefore, face a set of difficult decisions in balancing current service needs with longer-term investment. Additionally, most municipalities with residential tax rates higher than $20 per 1,000 of value are located in Western Massachusetts and many are approaching the $25 ceiling. Worse yet, in FY 2021, five Western Massachusetts municipalities (Holyoke, Pittsfield, Shutesbury, Wendell, and West Springfield) were at their levy ceiling and could not vote for a Proposition 2 ½ override.[1] This situation is an indication of deeper challenges in demographics and economics that have a real impact on municipal spending and capital investment.
3. Underlying Socio-Economic Issues in Western Massachusetts
Aging Population
Over the past decade, Massachusetts has undergone a shift in demographics that has greatly benefited eastern cities and towns. A particular demographic problem experienced in Western Massachusetts is the phenomenon of aging communities, where people age in place and younger people migrate out. As communities age, their residents may be unable to continue working and become more dependent on social support services.
The median age in Massachusetts, based on census data, is 39.5 years old, whereas in most Western Massachusetts towns, the median age is 50 or higher.17 Alford, on the Western border of Massachusetts, has a median age of 63.1 years.18As shown in Figure 2, this demographic situation has contributed to comparatively older western counties, while eastern counties are slightly younger. Suffolk County, which contains the city of Boston, is the youngest with a median age of 36.3 years.
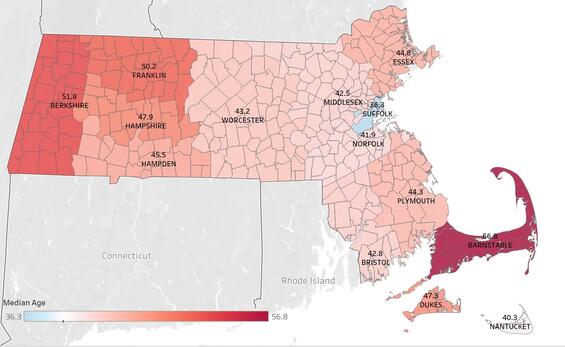
Figure 2—Map of Median Age by County
This problem is further compounded by population changes in the Commonwealth. Based on data from the Department of Revenue, Boston experienced population growth of 11.93% between FY 2011 and FY 2021.19Most communities in Western Massachusetts experienced population loss during this time, as much as 36.96% in Hancock, or had almost no population change, as can be seen in Figure 3 below.
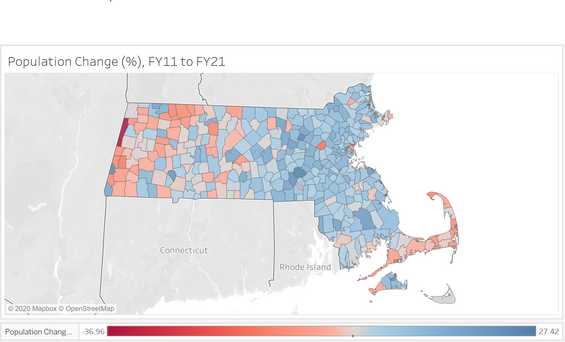
Figure 3—Population Change from FY 2011 to FY 2021
This depopulation trend is increasingly important—as communities lose residents and their remaining population ages, there will be fewer working-age people available to support the local economies on which municipal budgets rely. This situation has the potential to lead to decreased services and intercommunal connections for seniors during a stage of their lives when they will need those services and supports the most.
Small, Dispersed Communities
The issue of declining population is further complicated by the geographic challenges of Western Massachusetts. In Berkshire, Franklin, Hampshire, and Hampden counties, there are approximately 829,000 residents, spread amongst 101 communities covering 2,850 square miles.20 By comparison, Suffolk County has approximately 800,000 residents in four municipalities covering 61 square miles.21 The complications associated with distance between population centers in Western Massachusetts hamper infrastructure development, as more road miles have to be maintained, longer wires have to be run, and more buildings have to be kept up for the small amounts of people scattered amongst the foothills of the Berkshire Mountains. This issue is more acute in Hampden County, which houses most of the larger population centers in Western Massachusetts, as detailed below in Figure 4.
Figure 4—10 Largest Communities in Western Massachusetts
|
Municipality |
County |
2018 Population |
|---|---|---|
|
Springfield |
Hampden |
155,032 |
|
Chicopee |
Hampden |
55,582 |
|
Pittsfield |
Berkshire |
42,533 |
|
Westfield |
Hampden |
41,680 |
|
Holyoke |
Hampden |
40,358 |
|
Amherst |
Hampshire |
39,503 |
|
Agawam |
Hampden |
28,854 |
|
West Springfield |
Hampden |
28,747 |
|
Northampton |
Hampshire |
28,726 |
|
Ludlow |
Hampden |
21,478 |
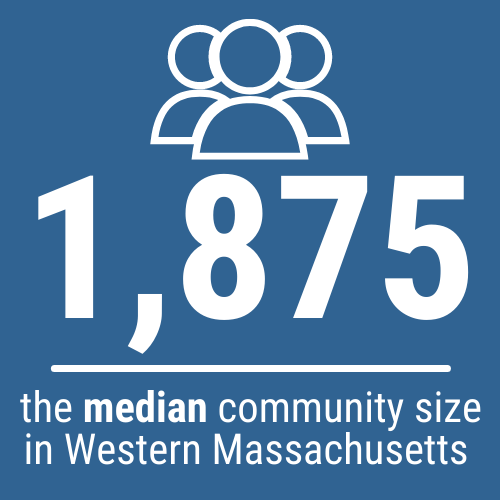
As shown above in Figure 4, Springfield is an anomaly in Western Massachusetts, being almost three times larger than the next largest community. In fact, the median community size in Western Massachusetts is 1,875 residents. Therefore, 50 out of 101 communities in the region have a population below this median, and 67 have a population of 5,000 or fewer.22 Of those 67 communities, 25 are in Berkshire County and 22 are in Franklin County.
These demographic issues impact municipal operations in various ways, but most pertinent are the shrinking municipal revenues caused by these changes. Limited state and local revenues result in a lack of development in critically needed infrastructure, which further perpetuates negative demographic and economic trends.
Shrinking Workforce
Further exacerbating the issue of a declining and aging population are changes to the labor base of Western Massachusetts. Between 2010 and 2020, Franklin County was the only Western Massachusetts county that saw positive growth in its workforce-eligible population, but the increase was only of 30 people. During the same time frame, Hampshire County lost 4,762 workers; Hampden lost 8,711; and Berkshire lost 11,988. Overall, the four counties faced a net loss of 25,431 persons from the labor force.23 Contrast this situation with similarly-sized counties elsewhere in Massachusetts, such as Essex County, which gained 22,653 workers; Norfolk County, which gained 8,221 workers; and Suffolk County, which gained 63,523 workers.24 Between 2010 and 2020, 7 out of the 10 communities that saw the biggest losses in their labor force were in Western Massachusetts counties. As shown below in Figure 5, there were greater negative changes in the labor-force growth rate in Western Massachusetts and Cape Cod than in other parts of the state.25
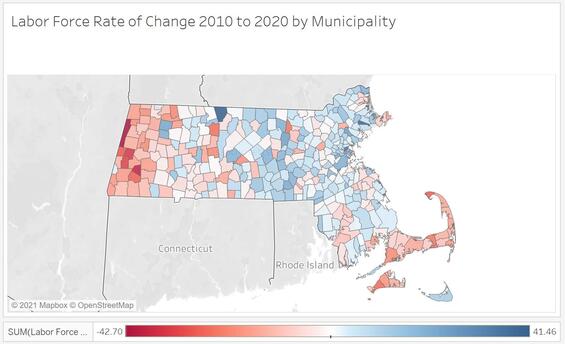
Many communities have seen their labor force shrink enormously, such as Lenox, which saw a loss of 949 people, or 34.62% of their labor force.27 This declining employment is also an indication of a shrinking commercial and industrial base in Western Massachusetts.
Smaller School District Enrollments
Another area emblematic of the demographic changes occurring in the Commonwealth is school district enrollment. In the 2018–2019 school year, approximately 1,007,000 students attended K-12 schools in Massachusetts.28 Almost all communities in the state had relatively flat growth in enrollment from the 2011–2012 school year to the 2018–2019 school year, and a large number also saw reduced enrollments. As shown below in Figure 6, shrinking enrollments are a clear issue in Western Massachusetts communities, with most declines falling below the statewide median of -4.18%.
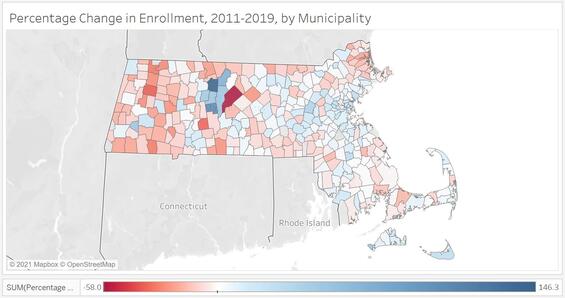
Overall enrollment in the median Western Massachusetts community shrank by 11.26%.30 With shrinking enrollment, communities are faced with the challenges of closing schools, regionalizing services, and increasing costs relative to the number of students they aim to educate. All of these developments illustrate a demographic phenomenon of children and families leaving Western Massachusetts, resulting in an aging population without a younger population base to replenish or support it.
Lack of New Property Value Growth
Without population to support it, new development does not occur in some municipalities, restricting the growth in taxable value. In FY 2021, most new growth has been concentrated in the eastern part of the state, particularly in Boston. Boston netted $6.3 billion in new growth revenue, while the 101 municipalities in the four western counties, combined, only took in $1.17 billion, as shown in Figure 7.31
Individually, these counties were all below the median in new growth, showing their lower levels of property development. Residential new growth in these counties was also lower than in other parts of the state.32
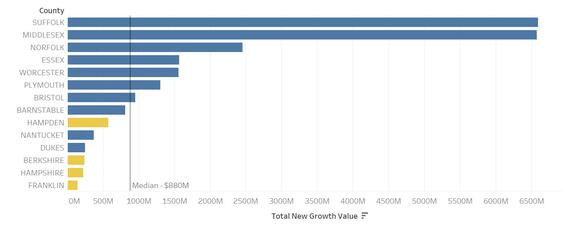
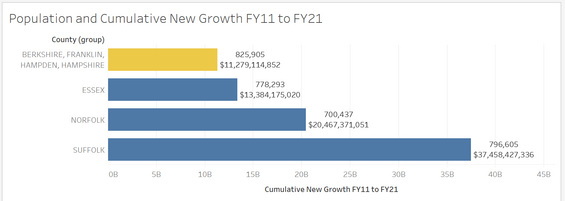
As shown below in Figure 8, between FY 2011 and FY 2021, the four westernmost counties’ cumulative growth was not even close to that of similarly populated counties in the eastern part of the Commonwealth.33 Importantly, this figure does not include the close to $1 billion in new growth that Springfield (Hampden County) could add from its casino, if it did not have a payment in lieu of taxes (PILOT) agreement in place, thus removing that property from the tax rolls.34 Even with that billion dollars included, the western counties would still remain $1.1 billion below Essex County in cumulative new growth.35
4. Infrastructure Problems
Broadband Internet Connectivity
In the Division of Local Mandates’ (DLM’s) conversations with stakeholders such as municipal and state officials, business groups, and educators, the lack of broadband has repeatedly been mentioned as an impediment to improving the quality of life in Western Massachusetts. Slower internet speeds have far-reaching implications: businesses cannot efficiently reach markets and supply chains; schoolchildren cannot readily access online resources or their remote-learning classrooms; and consumers face slow speeds that hinder their access to information, goods, and services. In recognition of the impacts of lack of broadband access and the centrality of the internet to modern life, the Commonwealth has invested a significant amount of time and resources into developing broadband infrastructure in Western Massachusetts. The Massachusetts Broadband Institute (MBI), a division of the Massachusetts Technology Collaborative, has assisted 107 communities by its “Middle Mile” program, which connects almost 1000 community institutions, such as schools, town halls, and other municipal buildings, to the internet.36
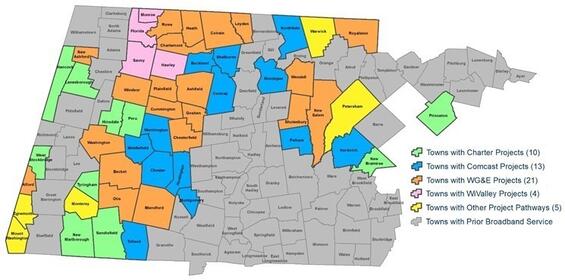
MBI has identified 53 unserved or underserved communities in Western and Central Massachusetts, and to date has helped to develop broadband with state funding in all but 9 communities. This work includes assisting some communities in developing a municipally provided network and working with private providers such as Comcast to serve others. Under the terms agreed upon between MBI and private providers, the private provider has to supply service for at least 10 years and assume associated risks, such as installing new connections or replacing transmission poles.37 According to MBI’s estimates, all communities will have access to broadband by the beginning of 2023.38 Figure 9 below shows the project provider for the 53 communities being assisted by MBI, including those with private partners such as Charter or Comcast, those with municipally provided networks through Westfield Gas & Electric, and others.
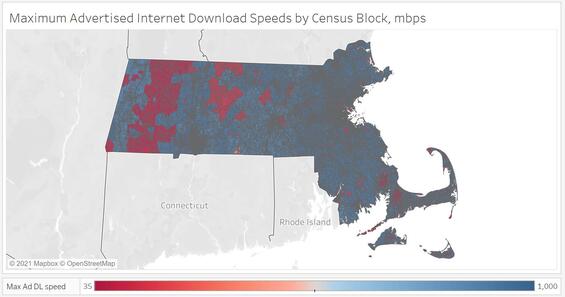
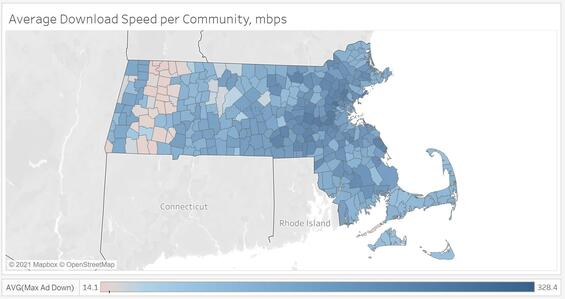
Despite significant state investment, there are still inequities in broadband speeds between Western and Eastern Massachusetts, as can be seen by census block in Figure 10 and by municipality in Figure 11 below. One measure for internet speed is the maximum advertised download speed in megabits per second (Mbps), which is the internet service provider’s advertised download speed. This measure differs from the actual download speed, which can be slightly faster or slower than the advertised speed in real usage depending on local conditions, making advertised speed a more useful metric to evaluate different cases. In Massachusetts, the average advertised download speed is 191.2 Mbps.40 Among some Western Massachusetts communities however, the speeds are significantly slower. For example, Windsor has average speeds of only 14.1 Mbps.41 Franklin County as a whole sees average speeds of 109.7 Mbps, the slowest for any county in the state, though this situation may improve as some communities build out municipal fiber networks. However, this speed and access will come at a cost. Despite state and federal funding, the towns that built municipal fiber networks have made significant local investments to bring last mile broadband to their residents. This includes outstanding bonds through programs such as the State House Notes Program. Many municipalities felt this financial risk was their only option recognizing that lack of broadband makes economic development and reversal of declining population trends impossible.42
Transportation
Among the most common concerns that DLM heard from stakeholders is the poor state of transportation infrastructure in Western Massachusetts, particularly roadways, small bridges, and culverts.43 One obstacle to municipal officials improving transportation infrastructure is the lack of professional staff, such as engineers and planners, in smaller towns. Federal transportation programs often have a several-year waiting period before funds are released, and in the intervening time period, project requirements may change, requiring the community to start anew. By choosing not to commit money to designs, studies, and experienced professionals, many communities defer necessary repairs and maintenance that would be unlocked by greater funding, to focus instead on immediate, minor infrastructure issues. In time, this situation has the effect of producing large and costly maintenance backlogs.
Damage to a road in Warwick (Franklin County) as a result of a storm in July 2021.
(Photo courtesy of the Office of Senator Jo Comerford)
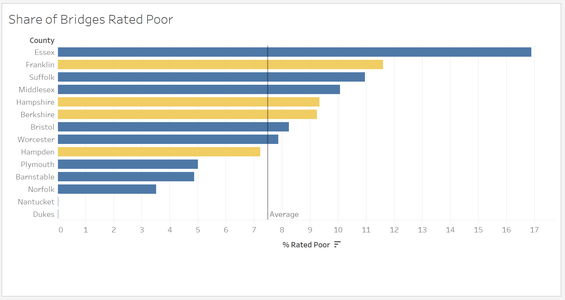
In discussions with stakeholders, DLM has identified small bridges and culverts as monumental issues for municipalities to overcome. In some cases, bridges are cordoned off and left to fail so they can qualify for emergency replacement, rather than going through a costlier renovation to modern engineering and environmental standards.44 Based on data from the Federal Highway Administration (FHWA)’s National Bridge Inventory, Massachusetts has 5,210 bridges owned by local and state government. Of these, 1,321 are rated in “good” condition, 3,418 are rated “fair,” and 471 are rated “poor,” using a 7-point-scale performance metric designed by FHWA for bridge condition.45 This scale rates the structure of bridges on a number of criteria, including how much of the surface is cracked, how much of the surface is “rutted” based on usage, and how much the structure has “faulted” or moved in inches from its original position.46 Of the 1,432 bridges in Western Massachusetts (27.48% of the state’s total), 61.96% are rated as “fair” and 9.35% as “poor.”47 As shown below in Figure 12, 3 of the 4 Western counties have a share of bridges rated “poor” that is higher than the state’s average of 7.48%.
Public Buildings
One area that is a prominent cause of concern for legislators is funding for public safety buildings. In many Western Massachusetts communities, police and fire departments have had to deal with inadequate buildings because of a lack of funding. For example, in Pittsfield, the current police station is housed in a building from 1939 and does not have space for police vehicles, classrooms, or conference meeting rooms adequate for required training purposes. A 2014 study of the Pittsfield Police Station conducted by Kaestle Boos Associates noted, “There is currently no State and Federal mandated sight and sound separation between male, female and juvenile processing and holding facilities.” The Pittsfield Chief of Police also stated, on September 23, 2021, “With the boiler issues we had this winter, it is unlikely this facility will be able to house prisoners next year without major heating renovations.” Replacement of this facility is estimated to cost around $50 million.48
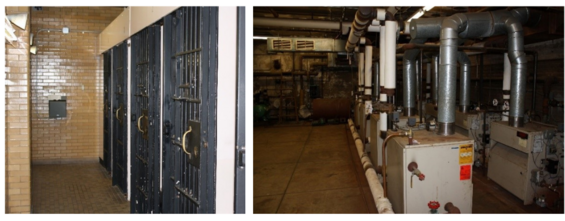
The holding cells (left) and boiler room (right) at the Pittsfield Police Station (Berkshire County) taken in 2011 that still reflect the current conditions of today. (Photos courtesy of the Pittsfield Police Department)
Many public buildings in these areas are not compliant with the Americans with Disabilities Act (ADA), and there is significant investment needed to ensure their compliance with this law. One municipal official raised issues with ADA compliance, stating, “The entire building is in need of accessibility upgrades to meet ADA standards, the windows need to be replaced, [and] the holding cells are not adequate to meet the needs of the Police [Department]. The [heating, ventilation, and air conditioning] systems need to be replaced.”49 Public safety infrastructure is not supported by state grants or loans and instead is paid for by municipal capital spending and rare earmarks in state appropriation or bond bills. There is a small federal loan and grant program that is administered by the US Department of Agriculture (USDA) that allows renovation and replacement of public safety and other facilities, but eligibility is restricted to the small, low-income rural municipalities and does not cover all project expenses.50
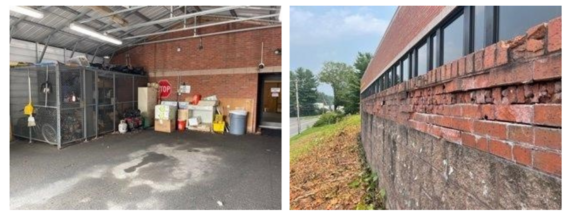
Recent images of the Greenfield Police Department (Franklin County) depicting the lack of storage space and the need for infrastructure repairs. (Photos courtesy of the Office of Greenfield Mayor Roxann Wedegartner).
5. Existing Infrastructure Funding Sources
Funding for infrastructure comes from many different state sources, such as direct appropriations, grants, bonds, and loans.51 For municipal buildings, a very small amount of state funds goes towards their repair or replacement, with most of the money coming from direct budgetary appropriation by the municipality. State funds are provided based on ad hoc appropriations decisions by the Legislature, typically through earmarks and not through applications or competitive processes, providing obstacles for municipal planning. Some appropriations can be planned for, such as Chapter 90 roadway funding, yet even this funding is determined by characteristics such as road miles, employment, and population.52 As Western Massachusetts has many roadway miles, but fewer people and jobs, municipalities in the region do not get monetary relief in amounts close to their infrastructure needs. This situation results in stark trade-offs among critical infrastructure needs and scarce local resources. This section is summarized in Appendix H.
Broadband Internet and Communications Infrastructure
Chapter 231 of the Acts of 2008 allocated $40,000,000 to MBI to build broadband infrastructure up to the last mile,53 with the last mile built and operated by private entities.54 In 2011, the federal government passed the American Recovery and Reinvestment Act in response to the Great Recession, and Massachusetts received $45,400,000 for investment in expansion of broadband.55 This amount was matched by $44,300,000 in state funds for a total of $89,700,000. Complementing the 2008 legislation, Chapter 257 of the Acts of 2014 also allocated $50,000,000 to MBI for last mile connectivity to be constructed by the state.56 Other awards have come from the Federal Communications Commission and the Last Mile Program run through the Massachusetts Technology Collaborative and MBI.57
Chapter 90 Program
The Chapter 90 Program provides state funding to municipalities for roadways, bridges, bikeways, sidewalks, and other transportation improvement projects as defined in federal law.58Although the program is funded at $200,000,000 annually, and was recently reauthorized at this amount in the most recent Chapter 90 appropriation,59 groups such as the Massachusetts Municipal Association advocate for funding to be set at $300,000,000 each year. These groups also advocate for multiyear funding for better roadway maintenance planning.60 In FY 2020, the Massachusetts House of Representatives initially endorsed a $300 million funding program; however, because of revenue uncertainty from the 2019 coronavirus pandemic, this amount was reduced to $200 million.61 In addition to the $200 million in funding for the Chapter 90 Program in FY 2022, this legislation included provisions that increased bond caps by $25 million each for various competitive grant programs involving traffic congestion mitigation, transit-supporting infrastructure, bus transportation, electric vehicle infrastructure, and enhancements to rail and transit stations.62 However, these competitive grants address the needs of urban and suburban areas, rather than the rural communities that predominate across Western Massachusetts.
Municipal Small Bridge Program
Created in 2016 and administered by the Massachusetts Department of Transportation (MassDOT), the Municipal Small Bridge Program has assisted municipalities in replacing or preserving bridges between 10 and 20 feet in length. The program, which was funded through MassDOT’s capital improvement program and bonding authority, ran from FY 2017 to FY 2021.63 It allowed municipalities to receive up to $500,000 per year in aid for maintenance or replacement of municipally-owned bridges, covering up to 100% of the total design and construction costs of eligible projects.64 Municipalities receiving program aid were responsible for handling the projects from design through construction, including securing all environmental permits and rights of way and coordinating with utility companies as needed.65 In total, the program awarded $45.5 million in funding to 102 projects in 80 municipalities over several years.66 In the most recent grant round in 2020, $6.3 million aided 27 communities, of which $3.1 million benefitted communities in Western Massachusetts.67 The program has been reauthorized with a bond cap of $95 million (an increase of $25 million from its previous authorization) and now includes culverts in addition to small bridges. While the Legislature sets a bond cap, it is up to the state administration to decide how much money is actually spent against the capital investment plan. MassDOT intends to continue to fund the program at the $10 million per year level in FY 2022, based on legislative authorization to issue bonds over the next five years.68
Municipal Pavement Program
In 2020, the state’s transportation bond bill created a Municipal Pavement Program with bonding authority of up to $100 million.69 This new program is designed to focus on municipally owned portions of state numbered routes and would provide partnerships and grants to communities to repair and replace municipally owned pavement. In FY 2022, this program has been funded at $15 million.70
State-Numbered Road Program
In the 2020 transportation bond bill, the Legislature also authorized up to $100 million in bonding authority for a State-Numbered Road Program.71 This program is designed to provide partnerships and grants for state-numbered routes under state or local ownership that do not benefit from federal highway funding, inclusive of study and design costs. In FY 2022, this program has been funded at $30 million.72
Municipal Vulnerability Preparedness Program
In 2016, the Executive Office of Energy and Environmental Affairs created the Municipal Vulnerability Preparedness (MVP) Program to encourage communities to plan for climate change resiliency. This program provides grants at a 25% municipal match, including planning grants to cities and towns certified as MVP communities, as well as action grants to allow communities to conduct projects such as culvert upgrades and improving flood resilience.73 In recent years, this program has provided almost $2 million to Western Massachusetts for culvert improvements and replacements.74
Culvert Replacement Municipal Assistance Grant Program
Beginning in 2017, the Department of Fish and Game’s Division of Ecological Restoration (DER) began offering the Culvert Replacement Municipal Assistance Grant Program to replace undersized or degraded culverts on public ways owned and maintained by the applying community in areas of high ecological value.75 The projects must be in proximity to important wildlife habitats and reconnect upstream and downstream habitats by removing barriers to wildlife passage.76 Individual awards range from $25,000 to $200,000, depending on the project phase and work proposed.77 In FY 2021, this program was funded at $806,880,78 a decrease from the program’s highest allocation of $932,000 in FY 2020.79 DER also provides technical assistance to municipalities and conducts trainings on the replacement process. Municipalities can apply for only one culvert or bridge project in a grant round through this program and must commit to managing the project.80 There are no required municipal funding matches for this program, making it an attractive option for a community to replace eligible infrastructure.
Massachusetts Board of Library Commissioners
Funding for municipal buildings also comes from the Massachusetts Board of Library Commissioners (MBLC). This agency provides grants that can be used for the planning, design, or construction of libraries across the Commonwealth. Currently, the agency has a $20 million annual cap on bonding it can access to fund grants, allowing it to award funds to only one or two projects in a given year. There is also a project waiting list of approximately 33 projects, representing a years-long backlog.81 These projects are funded over a five-year period. As detailed below in Figure 13, this program allows the state to cover 30% to 60% of project cost based on size.82
Figure 13—State Share of Library Project Costs
|
Eligible Cost |
Incremental State Share |
|---|---|
|
First $3,000,000 |
60% of amount up to $3,000,000 |
|
$3,000,000–$6,000,000 |
45% of amount between $3,000,000 and $6,000,000 |
|
$6,000,000–$15,000,000 |
40% of amount between $6,000,000 and $15,000,000 |
|
$15,000,000 and up |
30% of amount above $15,000,000 |
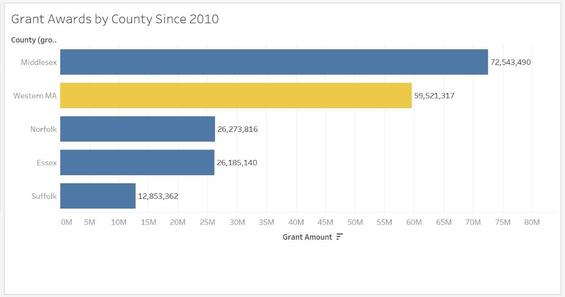
There is also a need-based factor percentage, on top of the above state-shared project portion, that is used to provide up to 15% in additional funds to a municipality.83 As part of its grant criteria, MBLC considers awards through a lens of geographic diversity. These criteria have given the four counties of Western Massachusetts a considerable amount of funding, comparable to counties with similarly sized populations, as seen below in Figure 14.84
MassWorks and Small Town Road Assistance Programs
Across the Commonwealth, MassWorks is a popular infrastructure program. This program provides competitive grants for capital funding to be used in infrastructure projects that support housing or economic development. MassWorks was created in 2011 by combining seven different economic development programs into one with a focus on projects that create housing or jobs. There are no caps on MassWorks awards, but in the review process, equitable distribution of funds across the Commonwealth is taken into consideration.85 MassWorks has a bond cap of $100 million, although approximately $70 million to $80 million is spent in any given year because of project delays and amendments, which require some funds to roll over.86 Since 2015, 219 grants have been awarded to 141 communities, investing $456 million to support infrastructure.87 A particularly useful aspect of the program is debriefing with each community after the grant round, which includes feedback on grant applications to assist communities in the future.88
MassWorks also makes roadway funding available to towns of under 7,000 persons through the Small Town Road Assistance Program (STRAP). The MassWorks enabling statute requires at least 10% of annual funding to go towards STRAP projects, which rely on public health and safety concerns rather than housing or jobs like the traditional MassWorks program. Unlike MassWorks, however, there is a cap of $1 million in STRAP funding for a particular project.89 Due to demand, STRAP is a stressed resource. In the most recent MassWorks grant round, there were 100 applications, 38 of which were for STRAP and nine of which were funded.90
Comments from municipal officials indicated that navigating state funding programs is complex and presents a barrier to applying for needed funds. Small towns have few or no professional staff members to fill out applications and handle paperwork.91 At the beginning of 2021, MassWorks and other economic development funding sources were rolled into a “Community One Stop for Growth” program administered by the Executive Office of Housing and Economic Development,92 which aims to reduce redundancy in applications and help match community goals to funding sources; municipalities report, however, that the application process remains onerous.93
Massachusetts Historical Commission
The Massachusetts Historical Commission has funds available for the preservation of sites listed in the State Register of Historic Places through the Preservation Projects Fund. These funds are limited in scope and amount; however, the 2021 grant round is funded at $800,000.94 Costs for routine maintenance are not allowable under this program, but costs related to structural preservation, building code compliance, accessibility where historic fabric is directly involved, and interior restoration based on historic evidence are eligible.95 Funding requests range from $5,000 to $30,000 for predevelopment projects, and from $7,500 to $100,000 for development or acquisition projects.96 Though small in amount, funding for protection of historic sites is one available option for eligible properties.
Qualified Bond Program
The state also offers the Qualified Bond Program, which is administered by the Municipal Finance Oversight Board (MFOB) chaired by the State Auditor. Under this program, MFOB considers applications from municipal governments to use the Commonwealth’s bond rating to borrow money at a lower interest rate than the community could secure on its own, allowing municipal governments to save money over the term of a bond.97 Since the creation of the program in 2013, MFOB has authorized upwards of $727,105,133 in bonds for eight communities in Western Massachusetts: Greenfield, Holyoke, North Adams, Orange, Palmer, Pittsfield, Springfield, and Westfield. Although it is infrequently used by smaller, rural municipalities, this program sees continued use by larger, urban communities and regional school districts.
Transportation Improvement Program
The Transportation Improvement Program (TIP), largely funded by the federal government, is administered by regional planning agencies, which have to establish transportation improvement plans covering multiyear periods. These plans include funding targets, which are focused on alleviating congestion, reducing emissions, and bringing infrastructure up to a state of good repair.98 As noted in the Rural Policy Advisory Commission’s 2019 Rural Policy Plan, many communities struggle to pay for design studies to advance projects to a point at which they can be submitted to TIP for funding. Because TIP funding targets are set based on a formula that emphasizes population and employment, Western Massachusetts often has lower TIP funding targets, and projects in that region are therefore given less priority than those in the Boston area, which have loftier goals to reduce emissions and alleviate congestion.99 Federal funding is therefore slow to come to Western Massachusetts projects, because of both the competition and the large upfront planning costs.
Community Development Block Grant Program
Another important source of dedicated state-administered funds for municipalities comes from the Community Development Block Grant (CDBG) Program. This federally-funded program awards grants to communities to meet a broad range of goals, including infrastructure development.100 These funds are awarded directly to “entitlement communities” that meet certain criteria for population and income. Most municipalities in Western Massachusetts are not designated entitlement communities, so they do not automatically receive CDBG funds. In Franklin County, only Greenfield is designated a minimum entitlement community and receives CDBG funds annually.101 Other communities may apply to Department of Housing and Community Development for competitive CDBG funds. This has resulted in thousands of dollars for infrastructure development.102 In FY 2019, 38 communities in Western Massachusetts received $17,300,929 from this program, which contributed to the rehabilitation of 171 housing units, provision of social services such as food pantries or domestic violence prevention, and numerous streetscape and drainage improvements. This program also helped to alter municipal buildings in four communities to bring them into compliance with ADA.103 This, however, is another grant program that requires professional assistance to prepare applications and administer the grant.
Community Facilities Direct Loan & Grant Program
Additional federal assistance for municipal buildings can be secured via the USDA’s Community Facilities Direct Loan & Grant Program. Under this program, rural municipalities with less than 20,000 residents are eligible for funds to renovate and/or replace “essential community facilities,” such as town halls, libraries, and public safety buildings.104 Across fiscal years 2018 to 2021, four Western Massachusetts municipalities (Sheffield, Becket, Montague, and Plainfield) collectively received $146,200 in USDA Community Facilities grant assistance.105
| Date published: | October 5, 2021 |
|---|