1. The SOL PILOT Program has been underfunded for decades.
The SOL PILOT Program relies on a legislative appropriation in order to distribute reimbursements to municipalities. However, in the last twenty years, appropriations for the program have not fully funded its statutory obligation to reimburse cities and towns. When DLM last examined the program in 2001, DLM estimated that fully funding the program would cost at least $30.8 million each year. At the time of DLM’s analysis, however, the program had a $21 million appropriation.98 Nineteen years later, the SOL appropriation for FY2020 was $30 million—the highest appropriation since FY2009 ($30.3 million).99 While the program’s appropriation remained flat at close to $30 million between the peaks of FY2009 and FY2020 (see Figure 3), property tax collections across the state increased by 57% during the same time period, further illustrating the disadvantages to communities heavily dependent on SOL PILOT payments.100 As seen by these financial trends, the SOL PILOT Program’s appropriation does not constitute full funding, as discussed below.
In the past, the DOR determined what would constitute a full reimbursement for the SOL PILOT Program by using a three-year aggregate statewide tax rate.101 The DOR calculated this tax rate by dividing the total tax levy of all properties in the state by their total assessed value.102
(Total Statewide Tax Levy / Total Statewide Assessed Value) * 1000
Because the DOR stopped calculating an approximation of full funding in FY2019, DLM used the Department’s formula to estimate a full PILOT reimbursement for SOL for FY2020.103 Based on the DOR’s formula, we expect that the Legislature would have needed to distribute at least $45,650,194 to fully fund the SOL program in FY2020, using the current calculation of land values multiplied by the aggregate statewide rate. Unfortunately, the appropriation for that fiscal year covered only 65.72% of total funding needed under this approach, or a $15,650,194 shortfall.
Figure 9—Funding Approaches to the SOL PILOT Program104
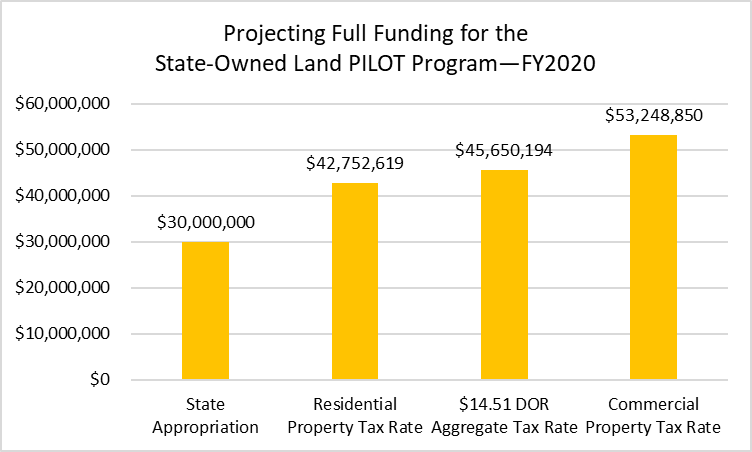
It may be possible to approximate another path to full reimbursement for SOL by looking at the Watershed PILOT Program that is also run by the state. As mentioned earlier, the Watershed PILOT Program calculates reimbursement for a municipality by multiplying the municipality’s watershed land value by its commercial tax rate for that fiscal year.105 Using this methodology, we estimate the Legislature would have needed to appropriate at least $53,248,850 for the SOL program in FY2020, using the current calculation of land values and municipalities’ FY2020 commercial tax rates. The existing SOL appropriation, however, would cover only 56.34% of needed funding under this approach, or a $23,248,850 shortfall.
Using residential property tax rates to estimate full funding of the SOL PILOT Program would be another option. Residential tax rates were previously recommended by regional planning commissions in central and western Massachusetts in the late 1980s as a basis for reimbursement to communities for SOL.106 If reimbursements were determined by multiplying each community’s SOL value by its current residential tax rate, we estimate that this approach would have required the Legislature to appropriate at least $42,752,619 in FY2020.107 The existing appropriation would cover 70.17% of needed funding, or a $12,752,619 shortfall, under this method.
2. The current formula disadvantages communities with slowly increasing or declining property values
Although the SOL formula relied on land values to calculate reimbursements for years, new methods to value SOL from the Municipal Modernization Act, which went into effect in FY2019, have exacerbated the disadvantage to communities with slowly increasing or declining property values Under the provisions of the Act, municipalities received an initial base value for their SOL.108 The base values are revalued every two years and are adjusted by a ratio representing the growth in a community’s equalized valuation.109 SOL values will increase in a municipality if the community’s overall property growth has increased, yet property growth varies across cities and towns in the Commonwealth.110 The pace of a municipality’s property growth (or lack thereof) influences how reimbursements are distributed in the SOL formula.
A PILOT reimbursement is based on a ratio of each community’s SOL value to the value of all SOL in the entire state. These changes in reimbursement favor municipalities that experience growth in SOL values that is faster than the statewide average. Municipalities that have stagnant or slowly increasing SOL values receive reductions in funding under the formula. Municipalities that cannot catch up to communities with increasing land values will experience lower reimbursements over time, and the effects will be more profound if the program’s appropriation is reduced or remains level.
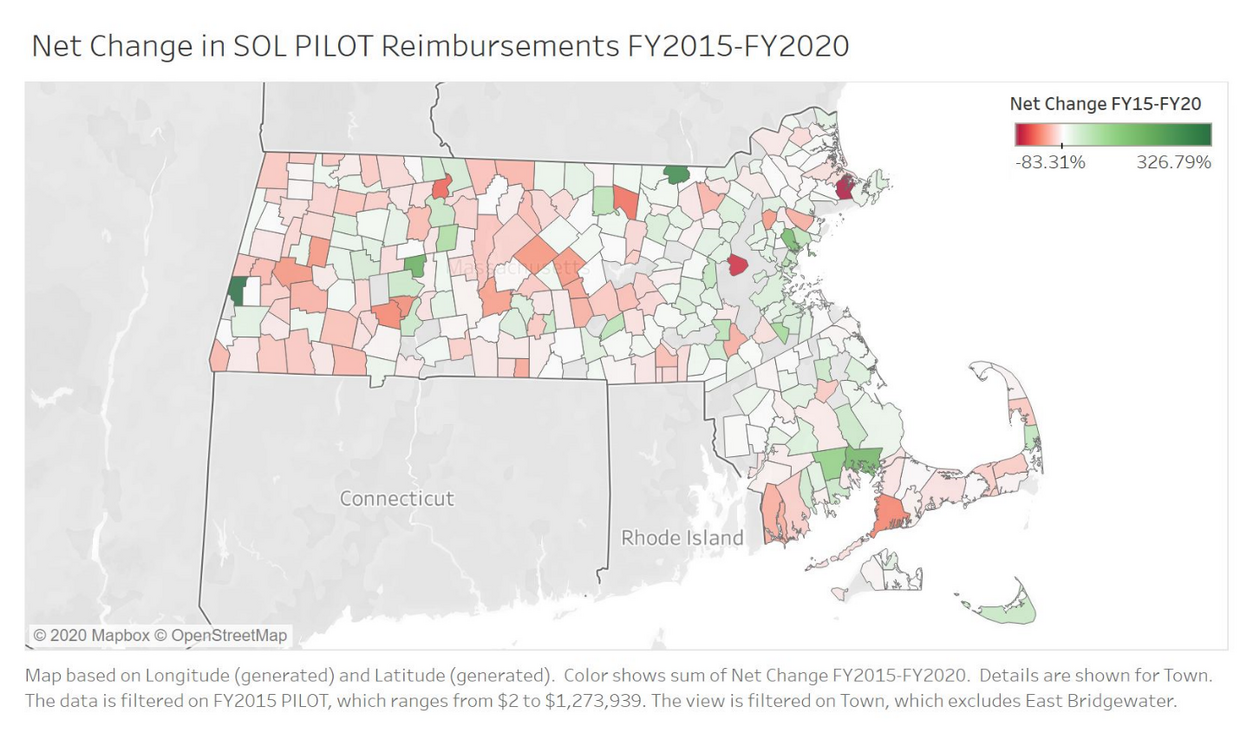
As a result, urban and suburban areas in the eastern part of the state, especially affluent ones, are the largest recipients of the program’s reimbursements. Rural, less affluent areas in central and western Massachusetts receive declining PILOT reimbursements. Figure 10 shows that pockets of central and western Massachusetts, as well as other communities in southeastern and northeastern Massachusetts, received decreased SOL reimbursements over the period between FY2015 and FY2020. At least 56 municipalities in the central and western regions faced lower PILOT payments over the same period, compared to at least 14 communities located in the eastern part of the state.
Figure 10—Net Change in SOL PILOT Reimbursements111
We continue to see this east-west divide when we compare communities with similar SOL values and PILOT reimbursements. For example, in Figure 11, the towns of Duxbury, Sheffield, and Warwick had similar SOL values in FY2020. A closer look reveals that Duxbury was the only municipality that received a higher PILOT reimbursement in FY2020, while Sheffield and Warwick lost reimbursements. Duxbury experienced the highest rate of property value growth, which is reflected in the 10.63% increase in SOL value in FY2020. Sheffield experienced declining property values (by 5.38%), which resulted in a lower PILOT reimbursement. Warwick increased its SOL value by 2.93%, but the increase was not large enough to warrant an increased reimbursement under the parameters of the formula.112
Figure 11—Comparing SOL PILOT Values and Reimbursements113
|
Duxbury (Plymouth County) |
Sheffield (Berkshire County) |
Warwick (Franklin County) |
|
|---|---|---|---|
|
FY2019 SOL Value |
$9,553,400 |
$11,068,700 |
$10,025,600 |
|
FY2020 Equalized Valuation Ratio |
1.1063 |
0.9462 |
1.0293 |
|
FY2020 SOL Value |
$10,568,900 |
$10,473,200 |
$10,319,400 |
|
FY2019 PILOT |
$89,022 |
$103,142 |
$111,218 |
|
FY2020 PILOT |
$100,779 |
$99,867 |
$98,400 |
|
Net Change from FY2019 to FY2020 PILOT |
13.21% |
(3.18%) |
(11.53%) |
In some instances, communities with declining or slow property value growth will increase their SOL values by accumulating more SOL, but it might not protect them from a reduced PILOT reimbursement. In FY2020, 56 cities and towns acquired additional SOL, but at least 15 of these municipalities had a lower PILOT reimbursement than in the previous year.114 At least 12 of the 15 municipalities were located in central or western Massachusetts. For example, Williamstown accumulated over 363 additional acres of SOL, but lost over $13,863, or 8%, of its PILOT reimbursements between FY2019 and FY2020. In addition, the town of Peru accumulated over 141 additional acres of SOL, yet lost over $19,867, or 29.16%, of its PILOT reimbursements during the same period.115
3. Municipalities receive higher reimbursements for lands in the Watershed PILOT Program
Although the SOL PILOT Program is constrained by its formula and a fixed appropriation, a similar program —the DCR Watershed PILOT Program—does not have these limitations. As previously discussed, the Watershed PILOT Program has reimbursed communities at 100% of the legislative formula each year with a dedicated revenue source (MWRA).116 Officials from DCR and the MWRA have reported no complaints about reimbursement rates under the Watershed PILOT Program, unlike the calls for increased funding under the SOL PILOT Program.117
DLM investigated differences between the SOL and Watershed PILOT programs and identified 26 communities that participate in both programs. Estimates from the communities indicate a range in land values from $12/acre to $1,216/acre in the Watershed PILOT Program and a range of values from $11/acre to $550/acre in the SOL PILOT Program.118 In FY2020, these cities and towns collectively received over $8.3 million in PILOT reimbursements from the watershed program, compared to only $2.2 million in SOL PILOT reimbursements.119
There is also a significant variation in the level of reimbursements communities receive for every $1,000 of value across the two programs.120 Although SOL PILOT reimbursements are distributed by the share of a community’s SOL to the state, every city and town is reimbursed at a rate of $9.54 for every $1,000 of value due to a fixed appropriation. The Watershed PILOT Program instead relies on individual communities’ commercial tax rates. Communities are reimbursed for their watershed lands at rates between $14.82 per $1,000 of value and $81 per $1,000 of value, as seen in Appendix B. Figure 12 shows an example of this variation in reimbursements.
Figure 12—PILOT Reimbursement Comparison Sample—FY2020121
|
Municipality |
County |
FY2020 Watershed and Annexed Land Value |
FY2020 SOL Value |
FY2020 Watershed PILOT |
FY2020 SOL PILOT |
FY2020 Watershed PILOT Reimbursement (Per $1,000) |
FY2020 SOL PILOT Reimbursement (Per $1,000) |
|---|---|---|---|---|---|---|---|
|
Barre |
Worcester |
$6,586,200 |
$7,197,900 |
$186,169 |
$68,636 |
$28.27 |
$9.54 |
|
Belchertown |
Hampshire |
$14,296,300 |
$16,416,600 |
$307,699 |
$156,541 |
$21.52 |
$9.54 |
The towns of Barre and Belchertown had similar land values in both the SOL and the Watershed PILOT program in FY2020. Despite similar values, the towns receive a more generous reimbursement through the Watershed PILOT Program because its rate of reimbursement (over $20 per $1,000 of value) is higher than the flat rate set for SOL ($9.54 per $1,000 of value). Barre’s SOL is more valuable, but its SOL PILOT reimbursement is much less than what it receives in the watershed program (by $117,533). The same applies for Belchertown, which receives $151,158 more in Watershed PILOT reimbursements than SOL reimbursements.
It is worth pointing out that the Watershed PILOT reimbursement rates are slightly different from the commercial tax rates of participating communities because the program contains a “hold harmless” provision that protects reimbursements from decreasing over time. The provision was included in the state laws creating the watershed program, meaning communities have not seen a decline in reimbursements since the program’s inception in 1984.122 The SOL PILOT Program does not have this component, although hold-harmless funding was used as a one-time supplement to the program’s appropriation in FY2019. In that fiscal year, the Legislature allocated $26,770,000 to the program and included an additional $1,708,131 to prevent any declines in municipalities’ PILOT reimbursements.123 If the hold harmless provision were included in the FY2020 appropriation for the SOL program, we estimate that at least $971,820 more would be needed to supplement current funding.124
4. Not all state agencies’ properties are eligible for SOL PILOT reimbursements
State law explicitly specifies what agencies are eligible for SOL reimbursements, excluding a number of departments from participating in the program. Staff members from the DOR indicated that program eligibility was based on historical precedent.125 State agencies and properties eligible for the program have been mostly unchanged in the law governing SOL since 1974, with the exception of a few amendments and clarifications.126
Some of the properties of state agencies that are not included in this list are the following:
- major government properties owned by DCAMM and associated agencies;
- barracks for the Massachusetts State Police;
- National Guard armories under the Commonwealth’s Military Division;
- DFS firefighting academies;
- buildings and land for the Massachusetts court system;
- land and property attributed to county sheriffs; and
- other properties from state agencies that were tax-exempt under previous owners.127
The SOL statute creates an artificial demarcation among state agencies, so that some land is not included in the program due to the agency in control of the land parcels.128 For example, the Camp Curtis Guild and the Camp Edwards Air Force Base are eligible for SOL reimbursements because they qualify as state military campgrounds, but other state military facilities, such as ”Readiness Centers” that recruit members for the National Guard, are not eligible. Likewise, correctional facilities belonging to the DOC are eligible for SOL reimbursements. Houses of correction belonging to county sheriffs are not eligible, however, because these facilities and county jails were explicitly excluded in the original iteration of the SOL PILOT Program.129
The SOL statute also excludes previously tax-exempt properties from being eligible to receive a PILOT reimbursement. For example, the Wompatuck State Park in Hingham was built on former federal property that once served as a military installation.130 Although the land was acquired by the Commonwealth to create the park, the town cannot receive any SOL reimbursements due to the statute’s exclusion of land that was previously held by a tax-exempt entity.
5. PILOT reimbursements do not capture value that results from significant improvements on land.
The Commonwealth’s responsibility to reimburse municipalities for lost tax revenues is limited to land values, which do not capture the value of buildings and other improvements to properties. For example, public colleges and universities, correctional institutions, and former state hospitals are all tax-exempt properties owned by the Commonwealth. While their land values are eligible for PILOT reimbursements, their fixed improvements do not count.131 Municipalities hosting highly developed state-owned properties thus face a dual burden because the facilities create an increased demand for municipal services.
Including buildings and improvements in SOL valuations could, however, create adverse effects on the SOL program. Reimbursements would be skewed to communities with valuable improvements and would lower payments in communities that have large amounts of protected land that does not allow for improvements. Including improvements to land will also make the SOL program costlier to finance, which exacerbates funding issues that currently exist in the program.
6. Dissatisfaction with SOL program has led officials to oppose further acquisitions of state land.
Communities across Massachusetts, particularly smaller towns in the western part of the state, have dealt with low SOL reimbursements for years, some of which are related to undervalued land acquisitions.132 To some of these towns, SOL represents a large share of their property value and they have raised concerns that the Commonwealth is not adequately compensating them for acquisitions of SOL. A financial administrator for one of these towns stated in correspondence: “Personally, I am not aware of any small towns in Western Massachusetts who would encourage more state acquisitions.”133
One municipality that has expressed opposition to additional state acquisitions in recent years is the Town of Hawley, in which over 40% of the land mass is owned by the state.134 In June 2017, the state purchased a plot of 90 acres in the town to add to the Dubuque State Forest.135 In 2016, before the sale was finalized, the Hawley Select Board sent a letter to state officials, opposing the purchase by the state of the additional land.136 Their concerns focused not just on the drop in revenue from a state land acquisition, but also on the inability of the state to maintain the roads and public infrastructure in the Dubuque State Forest.137 The letter points to serious public safety issues caused by the lack of maintenance on forest roads and the closure of roads that has extended over several years.138
The purchase was reflected in the SOL program as of FY2020. At the time, the land had an assessed value of $77,000 and was under private ownership.139 The tax payment on the plot of land while in private hands was $1,248.94, which is based on the town’s single tax rate of $16.22.140 Once purchased by the state, the assessed value of the land was changed to reflect the SOL program’s methodology of valuing acquired land, as displayed in Figure 13.
In FY2020, the state valued all land in Hawley in the SOL program at a rate of $748 per acre and had a reimbursement rate of $9.54 per $1,000 of value.141 As a result, the land parcel had a value of $67,334 in the SOL program and a PILOT of $642 per year.142 The tax receipts to the town for this parcel fell by almost half as a result of the state purchase. This is significant because, in FY2020, Hawley’s PILOT reimbursement was $57,635, which represented 52.8% of its total aid from the state.143
Figure 13—Breakdown of Land Acquisitions of Hawley in FY2020: Before and After144
|
Town of Hawley |
SOL PILOT |
||
|---|---|---|---|
|
Number of Acres |
90 |
Acquired Acres |
90 |
|
Assessed Land Value |
$77,000 |
Acquired Land Value |
$67,334 |
|
Town Rate Per Acre |
$855.55 |
Equalized Valuation Per Acre |
$748.15 |
|
Town Single Tax Rate |
$16.22 per $1,000 |
Reimbursement Rate |
$9.54 per $1,000 |
|
Tax Payment |
$1,249 |
PILOT Reimbursement |
$642 |
The example in Figure 13 illustrates a case where land values in the SOL program fall below those of the assessments done by communities when the land was in private hands. Since the current formula is based on assigning a community’s average value per acre to new acquisitions, there will also be cases where certain SOL parcels may be valued higher than before state acquisition. This is particularly true where the acquired land is primarily “unbuildable” acreage, such as protected salt marshes.145
| Date published: | December 10, 2020 |
|---|