Focus on Emissions Impacts
State government is the single largest user of energy in the Commonwealth, emitting over 850,000 metric tons of greenhouse gas (GHG) emissions per year. State entities play an essential role in meeting broader statewide emission reduction goals and mandates. The Leading by Example (LBE) portfolio includes executive branch agencies, court houses, prisons, hospitals, and state parks and recreation areas; 29 public higher education campuses; and quasi-public authorities such as transportation and water resources.
Despite encompassing a uniquely complex collection of facilities and operations, Leading by Example Executive Order 594 sets aggressive targets and requirements for state government to lead by example and reduce the GHG emissions associated with its actions.

Since passage of the Global Warming Solutions Act (GWSA) in 2008, Massachusetts has created a strong framework of state laws, regulations, and executive orders that guide the Commonwealth’s actions to address climate change.
GHG Emissions Progress
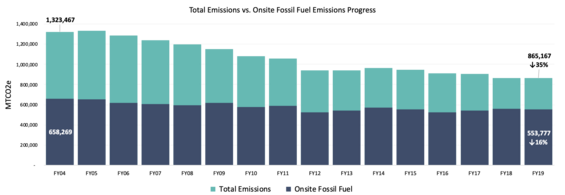
As a whole, the LBE portfolio has demonstrated considerable progress in reducing overall GHG emissions as evidenced by a consistent year-over-year decline. As of FY2019, overall portfolio emissions were equivalent to a 35% reduction while onsite fossil fuel emissions achieved a 16% reduction over the FY04 baseline. While the reduction in overall emissions progress is significant and shows the state portfolio moving in the right direction, the relatively modest reduction in onsite fossil fuel emissions indicates a need to refocus state efforts on Scope 1 emissions and rely less on the emissions benefits from a rapidly greening grid.
LBE annually tracks and reports scope 1 and 2 GHG emissions associated with 80 million square feet of state-owned facilities, 6,500 light-duty vehicles, and additional non-building and heavy-duty vehicle sources.
Driving Changes to the State Government Emissions Profile
Massachusetts state entities have implemented a variety of approaches to reduce energy use and the onsite combustion of fossil fuels including the deployment of clean energy resources, fuel-switching, strategically electrifying key building systems, implementing energy efficiency measures, and more. The result of these efforts has been a dynamic transformation in the emissions profile of the LBE portfolio.

The above charts show the comparative emissions contribution by fuel type for the LBE portfolio in FY2004 (baseline year), FY2012, and FY2019.
To better understand how the various LBE portfolio sectors have transformed the overall emissions profile, the following section outlines sector-specific emissions changes as of FY2019, compared to the FY2004 baseline, and the key initiatives driving change in each of these sectors over time.
To learn more, visit the Clean Energy Progress & Initiatives page.
To learn more, visit the Energy Use Progress & Initiatives page.
To learn more, visit the Energy Use Progress & Initiatives page.
To learn more, visit the Clean Transportation Progress & Initiatives page.
To learn more, visit the Sustainability Progress & Initiatives page.
LBE Program Support
The LBE Program supports the reduction of GHG emissions at state facilities through several efforts including:
- Project and technology-specific analyses to inform progress and priorities.
- Building-level analyses to target operational opportunities and monitor performance.
- Modeling key drivers that impact short- and long-term emission reductions.
- Technical assistance for agencies interested in fuel-switching or onsite renewable energy generation.
- Grant funding for clean energy feasibility studies and technologies that reduce onsite GHG emissions.
Visit the LBE Program Overview page to learn more.
Resources
LBE and its partners have developed tools to help track and report GHG emissions from state operations:
- FY20 LBE Tracking Form ⇒ Annual reporting form for state entities to submit energy consumption and sustainability data to LBE. FY21 Tracking Form Coming Soon!
- LBE GHG Emissions Calculator ⇒ This calculator translates energy units, such as electricity, oil, and natural gas, into GHG emissions and social math (eg, emissions equivalent to number of cars on the road).
- FY19 LBE Progress Report ⇒ Annual report detailing LBE portfolio progress across various metrics and program areas, highlighting key program and partner achievements.
- GWSA progress report ⇒ Review of progress made in implementing the policies of the Clean Energy and Climate plan toward the GWSA's 2020 target of a 25% reduction in GHGs below 1990 emissions.