

Table 1. Massachusetts Resident Death Counts by Month, 2026 Year-to-Date
| Month/Year | Monthly Death Count |
|---|---|
| 01/2026 | 6,107 |
| 02/2026 | 5,045 |
| 03/2026 | 5,211 |
Table 2. Massachusetts Resident Death Counts by City/Town of Residence, 2026 Year-to-Date
| City/Town of Death | YTD Deaths |
|---|---|
| Abington | 36 |
| Acton | 43 |
| Acushnet | 28 |
| Adams | 18 |
| Agawam | 102 |
| Alford | 1 |
| Amesbury | 45 |
| Amherst | 62 |
| Andover | 71 |
| Arlington | 82 |
| Ashburnham | 17 |
| Ashby | 8 |
| Ashfield | 4 |
| Ashland | 33 |
| Athol | 38 |
| Attleboro | 108 |
| Auburn | 60 |
| Avon | 12 |
| Ayer | 21 |
| Barnstable | 111 |
| Barre | 13 |
| Becket | 3 |
| Bedford | 42 |
| Belchertown | 34 |
| Bellingham | 30 |
| Belmont | 37 |
| Berkley | 20 |
| Berlin | 5 |
| Bernardston | 4 |
| Beverly | 99 |
| Billerica | 115 |
| Blackstone | 11 |
| Blandford | 3 |
| Bolton | 3 |
| Boston | 1,029 |
| Bourne | 56 |
| Boxborough | 7 |
| Boxford | 14 |
| Boylston | 13 |
| Braintree | 109 |
| Brewster | 41 |
| Bridgewater | 67 |
| Brimfield | 7 |
| Brockton | 217 |
| Brookfield | 7 |
| Brookline | 76 |
| Buckland | 2 |
| Burlington | 75 |
| Cambridge | 129 |
| Canton | 84 |
| Carlisle | 6 |
| Carver | 29 |
| Charlemont | 3 |
| Charlton | 31 |
| Chatham | 31 |
| Chelmsford | 97 |
| Chelsea | 81 |
| Cheshire | 10 |
| Chester | 3 |
| Chesterfield | 2 |
| Chicopee | 149 |
| Chilmark | 5 |
| Clarksburg | 4 |
| Clinton | 33 |
| Cohasset | 13 |
| Colrain | 7 |
| Concord | 47 |
| Conway | 5 |
| Cummington | 3 |
| Dalton | 24 |
| Danvers | 108 |
| Dartmouth | 82 |
| Dedham | 86 |
| Deerfield | 18 |
| Dennis | 74 |
| Dighton | 20 |
| Douglas | 14 |
| Dover | 7 |
| Dracut | 71 |
| Dudley | 27 |
| Dunstable | 4 |
| Duxbury | 33 |
| East Bridgewater | 36 |
| East Brookfield | 4 |
| East Longmeadow | 63 |
| Eastham | 24 |
| Easthampton | 48 |
| Easton | 58 |
| Edgartown | 15 |
| Egremont | 6 |
| Essex | 9 |
| Everett | 60 |
| Fairhaven | 46 |
| Fall River | 240 |
| Falmouth | 115 |
| Fitchburg | 104 |
| Florida | 1 |
| Foxborough | 41 |
| Framingham | 143 |
| Franklin | 63 |
| Freetown | 31 |
| Gardner | 55 |
| Georgetown | 16 |
| Gill | 4 |
| Gloucester | 92 |
| Goshen | 3 |
| Grafton | 30 |
| Granby | 15 |
| Granville | 3 |
| Great Barrington | 32 |
| Greenfield | 63 |
| Groton | 17 |
| Groveland | 18 |
| Hadley | 17 |
| Halifax | 18 |
| Hamilton | 17 |
| Hampden | 18 |
| Hancock | 2 |
| Hanover | 39 |
| Hanson | 30 |
| Hardwick | 2 |
| Harvard | 10 |
| Harwich | 46 |
| Hatfield | 11 |
| Haverhill | 158 |
| Hawley | 1 |
| Heath | 1 |
| Hingham | 77 |
| Hinsdale | 5 |
| Holbrook | 26 |
| Holden | 42 |
| Holland | 5 |
| Holliston | 35 |
| Holyoke | 105 |
| Hopedale | 18 |
| Hopkinton | 27 |
| Hubbardston | 11 |
| Hudson | 54 |
| Hull | 32 |
| Huntington | 5 |
| Ipswich | 42 |
| Kingston | 32 |
| Lakeville | 19 |
| Lancaster | 19 |
| Lanesborough | 3 |
| Lawrence | 136 |
| Lee | 22 |
| Leicester | 28 |
| Lenox | 21 |
| Leominster | 105 |
| Leverett | 4 |
| Lexington | 76 |
| Leyden | 3 |
| Lincoln | 16 |
| Littleton | 27 |
| Longmeadow | 57 |
| Lowell | 223 |
| Ludlow | 47 |
| Lunenburg | 24 |
| Lynn | 207 |
| Lynnfield | 25 |
| Malden | 119 |
| Manchester | 6 |
| Mansfield | 36 |
| Marblehead | 43 |
| Marion | 19 |
| Marlborough | 96 |
| Marshfield | 58 |
| Mashpee | 75 |
| Mattapoisett | 25 |
| Maynard | 30 |
| Medfield | 14 |
| Medford | 123 |
| Medway | 28 |
| Melrose | 56 |
| Mendon | 13 |
| Merrimac | 13 |
| Methuen | 128 |
| Middleborough | 65 |
| Middlefield | 1 |
| Middleton | 21 |
| Milford | 74 |
| Millbury | 54 |
| Millis | 21 |
| Millville | 3 |
| Milton | 47 |
| Monson | 21 |
| Montague | 25 |
| Montgomery | 1 |
| Nahant | 12 |
| Nantucket | 25 |
| Natick | 81 |
| Needham | 64 |
| New Bedford | 237 |
| New Braintree | 1 |
| New Marlborough | 2 |
| New Salem | 2 |
| Newbury | 21 |
| Newburyport | 46 |
| Newton | 153 |
| Norfolk | 14 |
| North Adams | 44 |
| North Andover | 75 |
| North Attleborough | 64 |
| North Brookfield | 6 |
| North Reading | 27 |
| Northampton | 75 |
| Northborough | 19 |
| Northbridge | 57 |
| Northfield | 8 |
| Norton | 43 |
| Norwell | 32 |
| Norwood | 83 |
| Oak Bluffs | 12 |
| Oakham | 5 |
| Orange | 29 |
| Orleans | 23 |
| Otis | 2 |
| Oxford | 31 |
| Palmer | 29 |
| Paxton | 7 |
| Peabody | 195 |
| Pelham | 3 |
| Pembroke | 48 |
| Pepperell | 21 |
| Peru | 2 |
| Petersham | 2 |
| Phillipston | 5 |
| Pittsfield | 155 |
| Plainfield | 1 |
| Plainville | 29 |
| Plymouth | 172 |
| Plympton | 5 |
| Princeton | 6 |
| Provincetown | 14 |
| Quincy | 214 |
| Randolph | 62 |
| Raynham | 41 |
| Reading | 49 |
| Rehoboth | 35 |
| Revere | 120 |
| Richmond | 4 |
| Rochester | 8 |
| Rockland | 61 |
| Rockport | 27 |
| Rowe | 1 |
| Rowley | 16 |
| Royalston | 2 |
| Russell | 3 |
| Rutland | 19 |
| Salem | 77 |
| Salisbury | 18 |
| Sandisfield | 5 |
| Sandwich | 54 |
| Saugus | 83 |
| Savoy | 2 |
| Scituate | 49 |
| Seekonk | 35 |
| Sharon | 45 |
| Sheffield | 5 |
| Shelburne | 7 |
| Sherborn | 4 |
| Shirley | 11 |
| Shrewsbury | 89 |
| Shutesbury | 2 |
| Somerset | 69 |
| Somerville | 94 |
| South Hadley | 59 |
| Southampton | 20 |
| Southborough | 13 |
| Southbridge | 52 |
| Southwick | 33 |
| Spencer | 33 |
| Springfield | 326 |
| Sterling | 29 |
| Stockbridge | 8 |
| Stoneham | 70 |
| Stoughton | 79 |
| Stow | 5 |
| Sturbridge | 16 |
| Sudbury | 32 |
| Sunderland | 5 |
| Sutton | 18 |
| Swampscott | 44 |
| Swansea | 56 |
| Taunton | 142 |
| Templeton | 26 |
| Tewksbury | 87 |
| Tisbury | 11 |
| Topsfield | 14 |
| Townsend | 16 |
| Truro | 10 |
| Tyngsborough | 31 |
| Unknown | 2 |
| Upton | 21 |
| Uxbridge | 40 |
| Wakefield | 64 |
| Wales | 5 |
| Walpole | 44 |
| Waltham | 110 |
| Ware | 35 |
| Wareham | 85 |
| Warren | 15 |
| Warwick | 3 |
| Watertown | 77 |
| Wayland | 33 |
| Webster | 69 |
| Wellesley | 51 |
| Wellfleet | 8 |
| Wendell | 1 |
| Wenham | 4 |
| West Boylston | 40 |
| West Bridgewater | 21 |
| West Brookfield | 17 |
| West Newbury | 9 |
| West Springfield | 90 |
| West Stockbridge | 4 |
| West Tisbury | 4 |
| Westborough | 43 |
| Westfield | 99 |
| Westford | 38 |
| Westhampton | 2 |
| Westminster | 21 |
| Weston | 21 |
| Westport | 43 |
| Westwood | 38 |
| Weymouth | 146 |
| Whately | 3 |
| Whitman | 43 |
| Wilbraham | 40 |
| Williamsburg | 8 |
| Williamstown | 14 |
| Wilmington | 49 |
| Winchendon | 29 |
| Winchester | 52 |
| Windsor | 1 |
| Winthrop | 34 |
| Woburn | 89 |
| Worcester | 390 |
| Worthington | 3 |
| Wrentham | 39 |
| Yarmouth | 109 |
Notes:
- Towns are listed in alphabetical order.
- 0 deaths were reported in the specified time period for the towns of Aquinnah, Erving, Gosnold, Monroe, Monterery, Mount Washington, New Ashford, Tolland, Tyringham, and Washington.
Table 3. Massachusetts Resident Death Counts by Underlying Cause of Death, 2026 Year-to-Date
| Cause of Death | YTD Deaths |
|---|---|
| All Other Causes | 3,395 |
| Cancer | 3,174 |
| Heart Disease | 3,128 |
| Chronic Lower Respiratory Disease | 699 |
| Stroke | 679 |
| Alzheimer's Disease | 629 |
| Unintentional Injuries | 568 |
| Influenza & Pneumonia | 457 |
| Ill Defined Conditions | 413 |
| Nephritis | 396 |
| Diabetes | 376 |
| Overdose | 300 |
| Parkinson's Disease | 260 |
| Septicemia | 238 |
| Pneumonitis | 222 |
| Chronic Liver Disease | 216 |
| Hypertension | 167 |
| Nutritional Deficiencies | 146 |
| Other Infections | 114 |
| Suicide | 108 |
| Covid | 107 |
| In Situ Neoplasms | 101 |
| Certain Infections | 68 |
| Other Artery | 62 |
| Aortic Aneurysm | 52 |
| Anemias | 40 |
| Congenital Malformations | 38 |
| Homicide | 29 |
| Perinatal Conditions | 22 |
| Cholelithiasis | 21 |
| Peptic Ulcer | 19 |
| Medical Complication | 18 |
| HIV/AIDS | 14 |
| Hernia | 13 |
| Injuries of Undetermined Intent | 13 |
| Atherosclerosis | 12 |
| Viral Hepatitis | 9 |
| Hyperplasia of Prostate | 9 |
| Kidney Infection | 8 |
| Pneumoconioses | 4 |
| Acute Bronchitis | 4 |
| Appendix Disease | 3 |
| Tuberculosis | 3 |
| Meningitis | 2 |
| Viral Encephalitis | 2 |
| Inflammatory Female Pelvic Disease | 2 |
| Legal Intervention | 1 |
| Meningococcal | 1 |
| Pregnancy | 1 |
Notes:
- Causes of death are listed in descending order.
- Causes of death in this table are based upon the underlying cause of death and classified according to ICD-10 codes. The underlying cause of death is disease or injury that initiated the series of events leading to death, or the circumstances of the unintentional or intentional injury that resulted in the death.
- An overdose death may also be counted as an unintentional injury (accident), suicide, homicide, or injury of undetermined intent. Deaths from all other causes on this list are counted in only one cause-of-death category.
Table 4. Death Counts by Place of Death, Massachusetts Residents, 2026 Year-to-Date
| Place of Death | YTD Deaths |
|---|---|
| Hospital - Inpatient | 5,703 |
| Decedent's Residence | 4,555 |
| Nursing Home | 2,723 |
| Hospital - ER/Outpatient | 1,077 |
| Hospice Facility | 831 |
| Assisted Living Facility or Rest Home | 667 |
| Other | 649 |
| Hospital - DOA | 99 |
| Secondary Residence | 59 |
Notes:
- Place of death is determined by and formally recorded by the attending physician, a hospital medical officer, or a medical examiner, who documents it on the death certificate.
- Places of death are listed in descending order.Place of death is determined by and formally recorded by the attending physician, a hospital medical officer, or a medical examiner, who documents it on the death certificate.
Table 5. Death Counts by Sex of Decedent, Massachusetts Residents, 2026 Year-to-Date
| Sex | YTD Deaths |
|---|---|
| Male | 8,235 |
| Female | 8,127 |
Note: Individuals of unknown sex are not included in this table.
Table 6. Death Counts by Age of Decedent at Time of Death, Massachusetts Residents, 2026 Year-to-Date
| Age Group | YTD Deaths |
|---|---|
| 0-1 year | 49 |
| 1-4 years | 10 |
| 15-24 years | 61 |
| 25-34 years | 159 |
| 35-44 years | 337 |
| 45-54 years | 596 |
| 5-14 years | 26 |
| 55-64 years | 1,481 |
| 65-74 years | 3,030 |
| 75-84 years | 4,693 |
| 85+ years | 5,921 |
Note: Individuals with unknown age at time of death are excluded from this table.
Table 7. Death Counts by Race and Hispanic ethnicity of Decedent, Massachusetts Residents, 2026 Year-to-Date
| Race/Ethnicity | YTD Deaths |
|---|---|
| American Indian / Alaska Native non-Hispanic | 35 |
| Asian / Pacific Islander non-Hispanic | 483 |
| Black non-Hispanic | 930 |
| Hispanic | 905 |
| Other NH | 98 |
| Unknown | 30 |
| White non-Hispanic | 13,882 |
Notes:
- Counts by race/ethnicity may not sum to state total.
- Counts by race/ethnicity are presented in alphabetical order.
Table 8. Death Counts by Manner of Death, Massachusetts Residents, 2026 Year-to-Date
| Manner of Death | YTD Deaths |
|---|---|
| Natural | 15,047 |
| Accident | 967 |
| Suicide | 143 |
| Pending Investigation | 104 |
| Could Not Be Determined | 54 |
| Homicide | 37 |
| Therapeutic Complication | 11 |
Notes:
- ‘Pending investigation’ indicates that the case is under review by the Office of the Chief Medical Examiner (OCME).
- ‘Could Not be Determined’ indicates that manner of death was unable to be determined by the Office of the Chief Medical Examiner (OCME). An example of this could be an overdose death where there was not enough information of the circumstances surrounding the death to determine if the overdose was intentional (suicide as manner) or unintentional (accident as manner).
- Counts are listed in descending order.
Table 9. Five-Year Historical Trends in Massachusetts Resident Mortality: 2021-2025
| Demographic | Metric | 2021 | 2022 | 2023 | 2024 | 2025 |
|---|---|---|---|---|---|---|
| Total Resident Deaths | Number | 63,158 | 63,390 | 61,219 | 60,003 | 59,847 |
| Total Resident Deaths | Age-Adjusted Rate | 722.8 | 709.7 | 671.3 | 656.3 | 651.9 |
| Total Resident Deaths | Crude Rate | 903.3 | 907.8 | 874.4 | 857.0 | 854.8 |
| Women | Number | 30,757 | 31,583 | 30,428 | 30,272 | 29,832 |
| Women | Age-Adjusted Rate | 600.0 | 600.8 | 567.4 | 564.3 | 554.3 |
| Men | Number | 32,401 | 31,805 | 30,790 | 29,730 | 30,013 |
| Men | Age-Adjusted Rate | 876.3 | 842.9 | 798.9 | 771.4 | 773.9 |
| American Indian / Alaska Native non-Hispanic | Number | 128 | 141 | 99 | 99 | 129 |
| American Indian / Alaska Native non-Hispanic | Age-Adjusted Rate | 844.1 | 936.9 | 623.6 | 657.8 | 807.6 |
| Asian / Pacific Islander non-Hispanic | Number | 1,716 | 1,625 | 1,642 | 1,644 | 1,664 |
| Asian / Pacific Islander non-Hispanic | Age-Adjusted Rate | 438.1 | 393.7 | 376.0 | 373.8 | 381.5 |
| Black non-Hispanic | Number | 3,419 | 3,589 | 3,386 | 3,318 | 3,412 |
| Black non-Hispanic | Age-Adjusted Rate | 741.2 | 750.2 | 684.2 | 679.9 | 701.4 |
| Hispanic | Number | 3,379 | 3,235 | 3,114 | 3,154 | 3,135 |
| Hispanic | Age-Adjusted Rate | 605.8 | 546.3 | 502.4 | 522.4 | 530.3 |
| White non-Hispanic | Number | 53,869 | 54,219 | 52,450 | 51,116 | 51,027 |
| White non-Hispanic | Age-Adjusted Rate | 738.2 | 728.5 | 693.0 | 671.4 | 666.6 |
Notes:
- 2021-2023 data are from Massachusetts closed death files. 2024-2025 data are from Massachusetts open death files. 2023-2025 data are considered preliminary at this time.
- Age-adjusted mortality rates were calculated by weighting the age-specific rates for a given year by the age distribution of the 2000 US Standard Population. The weighted age-specific rates are then added to produce the adjusted rate for all ages combined. Age-Adjusted mortality rates are expressed per 100,000 resident population.
- Crude mortality rates were calculated using the number of deaths divided by the total state population. Crude rates are expressed per 100,000 residents.
- Race group ‘Other NH’ and ‘Unknown’ are not included in rate calculations based on the availability of population denominators.
- Counts by race/ethnicity will not sum to state total.
Figure 1. 12 Month-Ending Provisional Counts of Opioid-Related and total overdose deaths
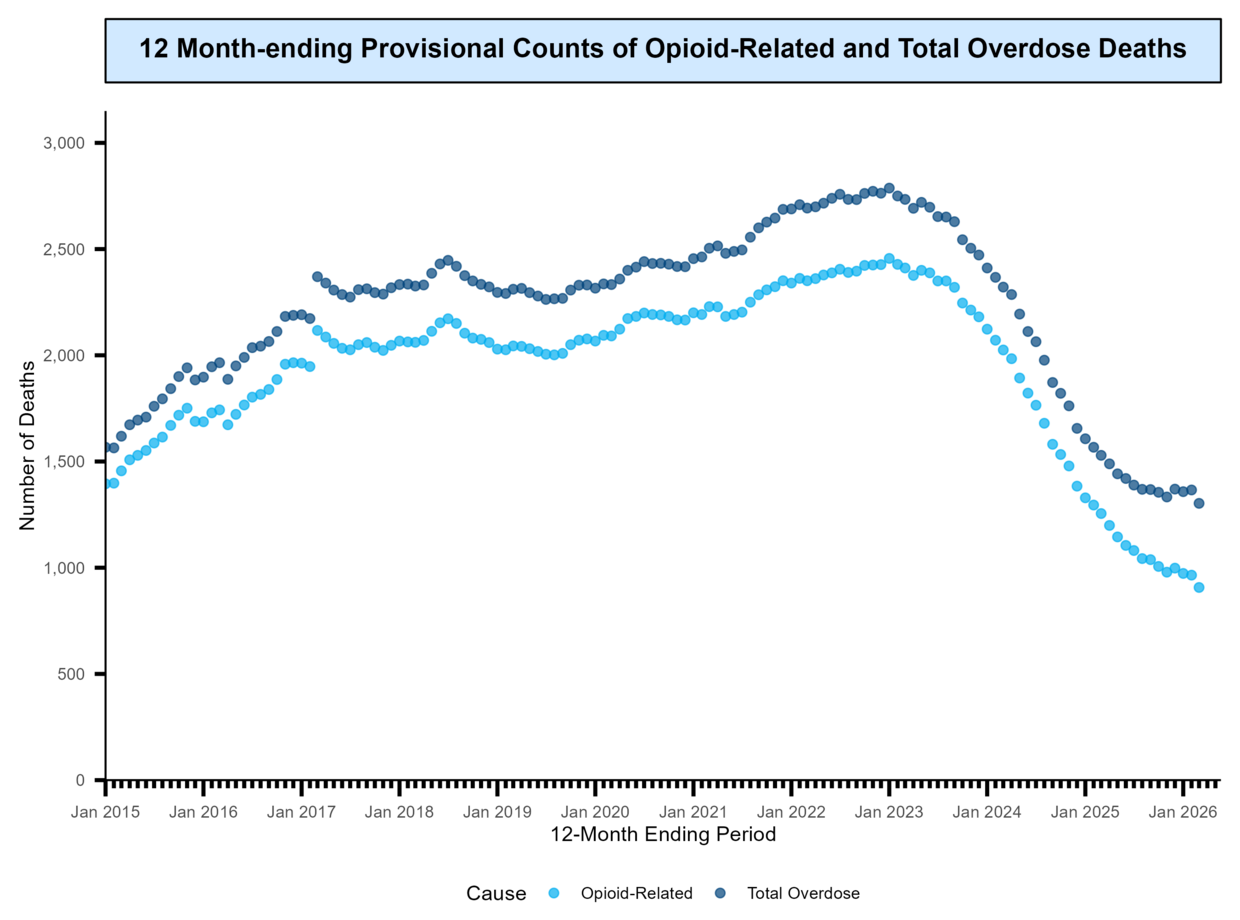
Download: To complement the Figure 1 image, an Excel file is available to download. Data Download - 12 Month-Ending Provisional Counts of Opioid-Related and Total Overdose Deaths (Excel)
Notes:
- Overdose and opioid-related overdose deaths were identified using ICD-10 codes as defined by the CDC’s case definition: The following International Classification of Disease (ICD10) codes for mortality were selected from the underlying cause of death field to identify poisonings/overdoses: X40-X44 (unintentional), X60-X64( suicide), X85 (homicide), and Y10-Y14 (undetermined). All multiple cause of death fields were then used to identify an opioid-related overdose death: T40.0, T40.1, T40.2, T40.3, T40.4, and T40.6. Opium (T40.0); heroin (T40.1); natural opioid analgesics (T40.2); methadone (T40.3); synthetic opioid analgesics other than methadone (T40.4); or other and unspecified narcotics (T40.6).
- Provisional death counts presented in this data visualization are for “12-month ending periods,” defined as the number of deaths occurring in the 12-month period ending in the month indicated.
General Data Notes
Data Sources: The data in this report were obtained from Massachusetts Registry of Vital Records and Statistics (RVRS) Closed Death Files (2019-2023 data) and Open Death Files (2024-2026 data). Closed files are stable datasets used for annual reporting. Open files contain the most recent available data, and they continue to be updated over time. Counts published by RVRS may differ from counts obtained through National Center for Health Statistics/CDC WONDER because MADPH/RVRS closes their annual files later than NCHS to get more complete reporting of events.
Preliminary vs Provisional Data: Data products based on open files include a “Provisional Data” or “Preliminary Data” note indicating that the data may be incomplete or inaccurate, have not yet been fully verified, and are subject to revision as additional information becomes available Preliminary data represents completed observations or results but simply hasn’t passed the final, rigorous vetting or approval stages. The “preliminary data” note is removed once the annual report for a given year has been published on our website.
Resident death: The death of a person whose usual place of residence or permanent address (as reported by the informant) is in one of the 351 cities or towns of Massachusetts, regardless of where the death took place. All data in this report are resident data.
Death Certificates: A vital record can be signed by a licensed physician doctor (which includes medical examiners), a Nurse Practitioner, or a Physician Assistant. Starting in 2016 Physician Assistants (PA) could also sign. Some data elements found on the death certificate are causes of death, decedent’s name, gender, birth date, place of residence, and place of occurrence. The underlying cause of death is the disease or injury that initiated the events leading to the death. Cause of death information in this report is based on ICD-10 codes.
Race and Hispanic Ethnicity: The 2003 revision of the Standard Certificate of Death allows the reporting of more than one race. in accordance with the revised standards issued by the Office of Management and Budget (OMB) in 1997. In order to provide uniformity and comparability of the data during the transition period, before multiple-race data are available for all reporting areas, it is necessary to “bridge” the responses of those who reported more than one race to a single-race. The method used to bridge responses for those who report more than one race to a single race is based on a procedure whereby multiple races are assigned to the smallest minority group first (i.e., Asian and White becomes Asian, or Black and Native American becomes Native American). All respondents reporting Hispanic/Latino ethnicity are included in the Hispanic/Latino category regardless of race. Even though we bridge responses down to seven categories (American Indian / Alaska Native NH, Asian/Pacific Islander NH, Black NH, Hispanic, White NH, Other NH, and Unknown) not all categories are used in each table or figure that compares race and ethnicity data. There are well-known difficulties in calculating accurate mortality rates for smaller populations such as Asian/Pacific Islanders and Native Americans. Please use caution when interpreting these small numbers.
Population Denominators: Population estimates are from State, County, and Small Area Population Estimates 2020-2030, (Version 2025), generated by the University of Massachusetts Donahue Institute in partnership with the Massachusetts Department of Public Health, Bureau of Environmental Health. Detailed population estimates at fine levels of geography are prone to estimation error. Estimated error was best described by age and population size and was used to adjust final population numbers, however a margin of error exists for all estimates.