Downloads
JPEG 2000 4 km. x 4 km. tiles, lossy, at 16:1 compression ratio, 4 bands (RGB and IR).15 MB each.
Overview

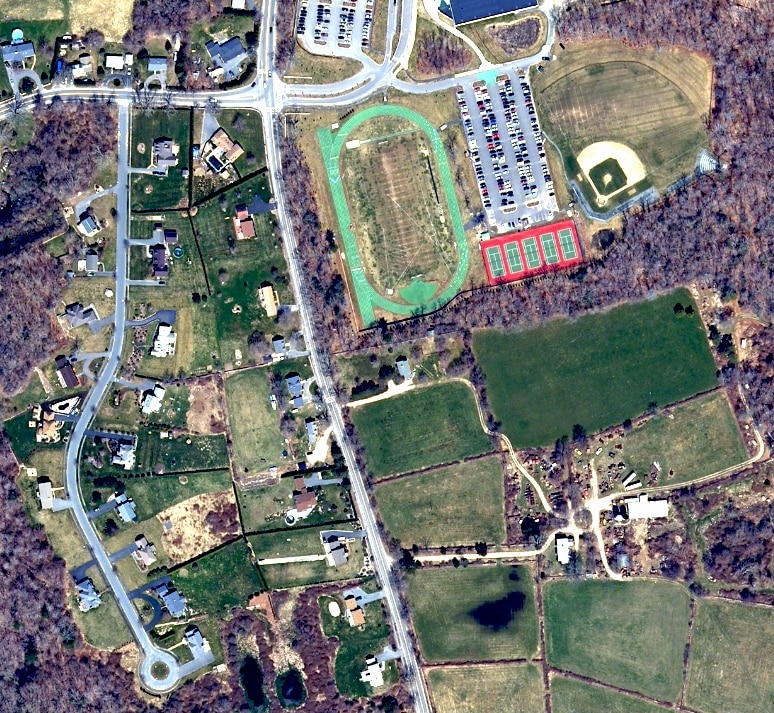
The photography for these medium resolution, true color images for the entire commonwealth was captured in April 2005 when deciduous trees were mostly bare and the ground was generally free of snow.
Image type is 4-band (RGBN) natural color (Red, Green, Blue) and Near infrared in 8 bits (values ranging 0-255) per band format. Image horizontal accuracy is +/-3 meters at the 95% confidence level at the nominal scale of 1:5,000. This digital orthoimagery can serve a variety of purposes, from general planning, to field reference for spatial analysis, to a tool for development and revision of vector maps. It can also serve as a reference layer or basemap for myriad applications inside geographic information system (GIS) software. The project was funded by the Executive Office of Environmental Affairs, the Department of Environmental Protection, the Massachusetts Highway Department, and the Department of Public Health.
Production

Sanborn LLC of Colorado Springs, CO, performed all work for this project. The source imagery was acquired with a Vexcel Ultracam digital camera at a flying height of 5,070 meters above mean terrain and an approximate pixel resolution of 45 cm.
Forward overlap was approximately 60%, except 80% in areas with tall structures (downtown Boston, Worcester, and Springfield), in order to reduce building lean, with sidelap of 33%. The entire state was covered by about 5500 image frames, captured over seven days from April 9 through April 17, 2005.

The ground control used to support the mapping was collected by photographic identification of strategic points. The ground control coordinates were collected via GPS ground survey techniques. Aerial Triangulation was performed on softcopy workstations using Intergraph ISAT software for photo measurement and matching. The final bundle adjustment was performed using BINGO 5.2 software.
A new digital elevation model was stereo compiled for the entire State from the newly acquired 2005 imagery. The DTM includes mass points, soft breaklines and hard breaklines. The images were ortho-rectified using METRO, Sanborn's proprietary software. Bridges were modeled in 3-D using standard photogrammetric stereo-compilation techniques on softcopy workstations. Sanborn's Metro process rectifies the bridges using the 3-Dimensional model using similar methodologies for correcting the positional accuracy of other ground features. The bridges were uniquely coded and later removed from the final deliverable DTM file.

Imagery is georeferenced to Massachusetts State Plane Mainland (Lambert Conformal Conic Projection) NAD83 coordinate system, denominated in meters.
Color balancing was performed using METRO_NICE software. The resulting images were mosaicked into one seamless database of imagery and extracted to match the existing MassGIS Orthophoto Index Grid tile layout (each image tile covers 4,000 × 4,000 meters on the ground.). Images were quality-controlled by Sanborn using Adobe PhotoShop software. Final deliverables included 1/2-meter pixel resolution GeoTiff images with supplementary tfw files and metadata.
MassGIS quality assurance included rigorous independent checks of the spatial accuracy using other datasets of significantly higher accuracy, and field work that included the capture of highly accurate GPS points that were compared to the same locations appearing on the deliverables. MassGIS also assessed the visual quality and appearance of the images.
Displaying the Images

Color Tone and Appearance
Users should note that color tone and balance are always based on personal preference. Image color processing frequently involves a series of compromises with the overall objective of providing images “with the appearance that people expect”. Different hardware (monitor, video card, etc.), software, and subjective perceptual differences can all contribute to the perception of color in these images.
In order to preserve as much of the raw data as possible, Sanborn and MassGIS chose to minimize any processing that might enhance the imagery, leaving such techniques (e.g., contrast and brightness adjustment, etc.) to the user. For example, ArcGIS users may want to set the display properties for these images to "Resample during display using Bilinear Interpolation (for continuous data)" in the Properties box, Display tab. (The Cubic Convolution display method may result in gaps between adjacent image tiles). Other options include adjusting the Contrast and Brightness settings on the Effects Toolbar or applying a stretch (e.g. Standard Deviation) to the images in the Properties box, Symbology tab. When stretching the image, users may choose to base the stretch on the image as a whole, or just base statistics on the current display extent (an option available at ArcGIS 9.1). Achieving results you like may require exploring the capabilities of your software and hardware, which can take considerable time. Printing or plotting the images further introduces variability due to different hardware and software systems, etc.
Users should note that ArcMap will automatically apply a 2 standard deviation stretch to Tiff, JPEG2000, and ArcSDE formats of these images. This may result in a "too bright" appearance in some areas. Users can adjust this default stretch to their liking.
Users may also observe a different appearance between the 2005 and 2001 color imagery. The two datasets were produced with different methods and have a significantly different distribution of pixel values (histograms).
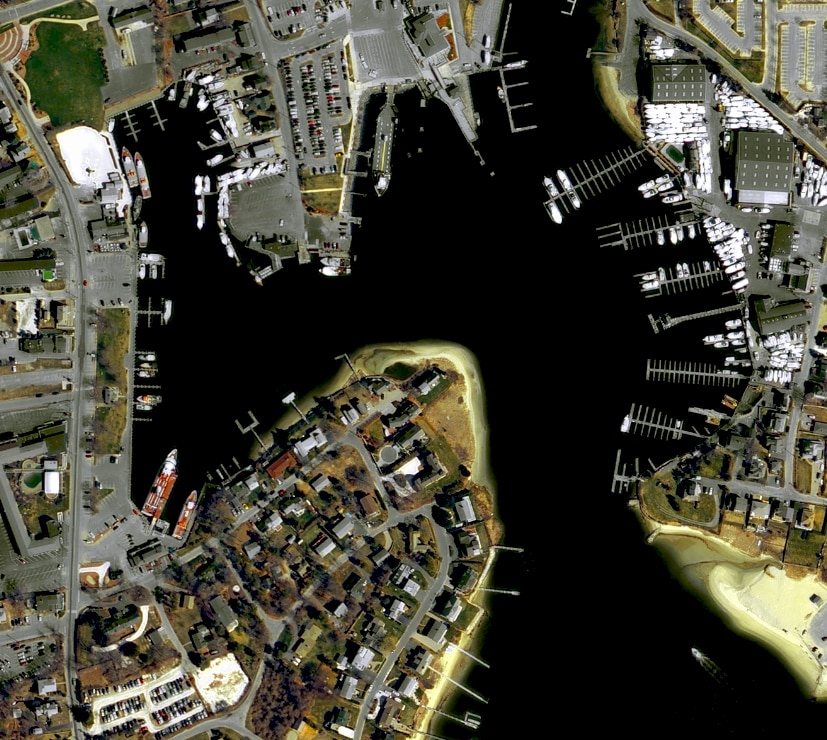
Black 'nodata' Areas
The JPEG 2000 and GeoTiff versions of the imagery contain black (RGBN values of 0) pixels in parts of some tiles beyond the interpreted area just outside the state boundary or offshore. Users may want to display these pixels as white (values 255,255,255) or as transparent. In ArcMap, go to the image's Layer Properties dialog, Symbology tab, check Display Background Value and click the color selector next to the 3 "0 0 0"textboxes to choose the desired background color.
Image Catalogs
Image catalogs are available for download for use with the JPEG 2000 files. Users can load the following image catalog file into GIS software instead of loading in each individual image; as you pan around and zoom in and and out, the catalog will automatically retrieve and display the image(s) for the current geographic extent. Simply place the image catalog in the same folder on disk with the image files.
- coq2005jp2.dbf - JPEG 2000 tiles (may be used with original and contrast stretched images)
Note, however, that if using the image catalog in ArcMap, you will not be able to change symbology characteristics such as stretch type; these types of image enhancement are accessible only from the Layer Properties Symbology tab, which is not present for image catalogs. However, the appearance may be affected, to a lesser extent, by adjusting the Contrast and Brightness settings on the Effects toolbar. See more details on the Display Options page.

Displaying with Feet-based data
Users may successfully display our meters-based imagery in ArcView 3.x with other data in NAD83 Mass. State Plane feet simply by changing the accompanying .j2w "world" files and installing the newest version of the file AVMrSID.dll. The process is as follows: Open the .j2w file in a text editor and multiply all values by 3.2808333316 and save. If users wish to display the images with feet-based (or any non-meters-based) data in ArcMap, add the image file (.jp2, ensuring it is stored in the same folder with the companion .aux file) and the data (if it has a .prj file, indicating a defined spatial reference for vector data) and the images will project on the fly (ArcMap does not use the .jp2 world files).

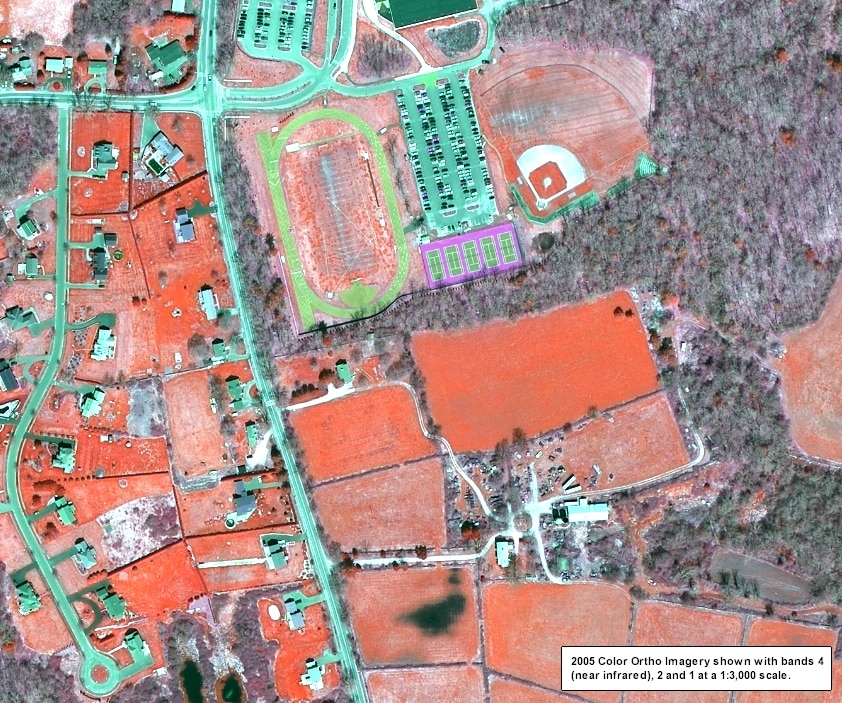
Near infrared "expected" red/green look
To achieve the conventional red/green look (with red indicating vegetation and green representing impervious surfaces like pavement and rooftops) when displaying the fourth (near infrared) band, display bands 4, 2, and 1 for the red, green and blue channels, respectively. The fourth band is available in the GeoTIFF and JPEG 2000 formats. In ArcGIS, go into the raster layer's Properties > Symbology tab and show the raster as an RGB composite and assign the bands to the channels. Then choose Stretch Type of 2 Standard Deviations.
Distribution
Due to the large size of the original half-meter GeoTIFF images, MassGIS is making these images available in the compressed JPEG 2000 (JP2) formats. Users may access the JPG2000 data by free download.
Original vs. "Contrast Stretched" Imagery
MassGIS has produced a set of "Contrast Stretched" JP2 data for users who do not have the software tools to modify the appearance of the original imagery. This second set of compressed data was produced from a set of GeoTIFFs that MassGIS modified with a 2.75 standard deviation linear contrast stretch in Erdas Imagine software. A linear contrast stretch is a simple way to improve the visible contrast of an image by changing the individual values of the pixels in the image. Usually, a contrast stretch is performed only on the display device (screen, printer, etc.), so that the data file values do not change. In this case, the stretched pixel values were saved to the tiffs and the tiffs were used to make the second set of JP2 files.
MassGIS is making this second set of images available for those whose software does not permit display adjustments, or who simply prefer not to adjust the contrast. These contrast stretched images may help solve some of the problems that some users encountered with getting the original images to look the way they wanted. These new images have a much greater contrast when compared to the originals. The drawback is that the stretch is "fixed", so that you cannot recoup the original pixel values. With the original set of images (GeoTIFF and JP2 formats), the user can achieve the same type of contrast adjustment seen in the second set of imagery and still make use of the full range of data values acquired by the digital cameras.
Images in the following formats are available for download as 4 km. × 4 km. tiles (based on the Ortho Index tiling scheme)
Review download links/map at the top of this page:
- JPEG 2000, lossy, at 16:1 compression ratio, 4 bands (RGB and IR).15 MB each. Two sets:
- From original GeoTIFFs (url_lossy)
- From contrast stretched GeoTIFFs (url_cs)
Maintenance
Please note that MassGIS does not have any old aerial photographs (pre-1992).
The MassDOT Survey Section maintains an archive of aerial photographs dating back to the 1930’s