Downloads
Overview

The features were initially interpreted by a contractor (Rolta) for the entire Commonwealth using color, 30 cm. DigitalGlobe ortho images obtained in 2011 and 2012, supplemented with LiDAR (Light Detection And Ranging) data collected from 2002 to 2011 for the eastern half of the state.
In 2019, MassGIS refreshed the data to a baseline of 2016 and continues to update features using newer aerial imagery that allows MassGIS staff to remove, modify and add structures to keep up with more current ground conditions. Structures from the original compilation that are removed are stored in an "archive" feature class for edit tracking and historical purposes. Also in 2019, MassGIS replaced the polygons in Boston with data from the city.
In March 2021, the layer was updated with 2017 and 2018 structure review edits along with the first data edits compiled atop spring 2019 imagery. In July 2021, MassGIS completed the statewide update based on 2019 imagery. In September 2022, MassGIS completed the statewide update based on 2021 imagery. MassGIS made further edits based on 2021 imagery during 2023, and based on 2025 imagery in late 2025 for portions of Cape Cod. MassGIS used the 2025 imagery, with assistance from Blackshark AI object detection tools, to make statewide updates (outside of Boston) published in May 2026.
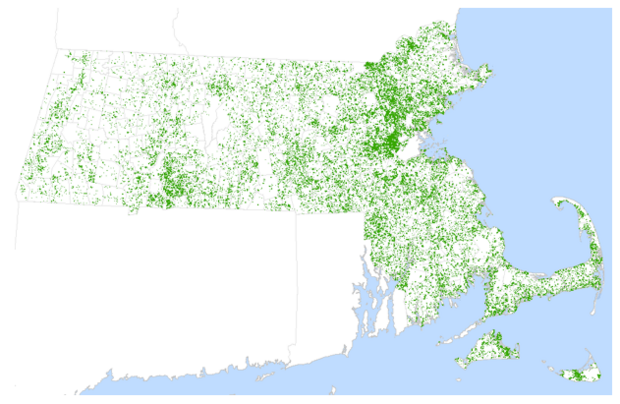
The layer is named STRUCTURES_POLY.
Production

The roofprints as delivered by Rolta were enhanced by MassGIS using Normalized Digital Surface Models (NDSMs) derived from the same LiDAR data. Other layers were used, including the Property Tax Parcels, to aid in review, especially where LiDAR data were not available. See the section "Roofprint Shifting" below for details on MassGIS' work to edit the roofprints. For information on other updates see the "Maintenance" section.
Rolta created the polygons based on the 2011 and 2012 DigitalGlobe Ortho images (see Year of Photography Index PDF 1MB), the latest available orthos at the time, using LiDAR as a supplement to determine the shape of structures that were difficult to distinguish in the orthos. The data were saved in ESRI shapefile format and delivered to MassGIS for QA review, then processed to create the final deliverable.
Criteria Used for Creating a Roofprint
The following is a summary of the guidelines used in creating roofprints (as described in the Request for Response for this project):
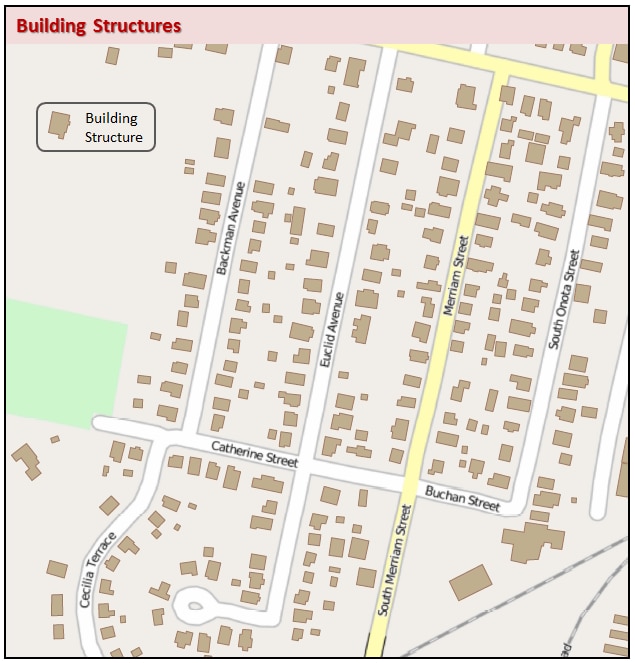
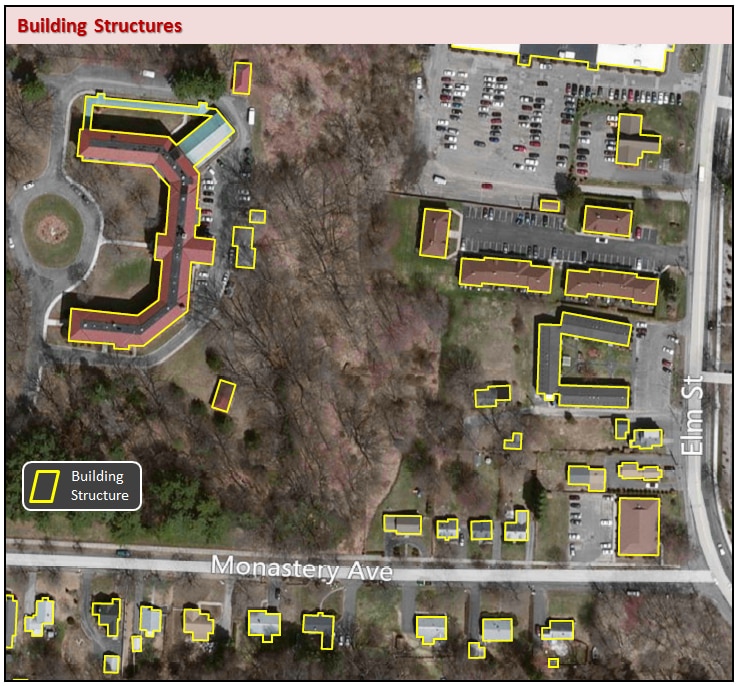
A roofprint is a map polygon, with real world coordinates, representing the perimeter outline as it appears in aerial imagery of every structure or portion of a structure which has a roof. Roofprints shall be mapped for all structures equal to or larger than 150 square feet including the following:
- Residential, commercial, and industrial structures (including roof over porches and decks)
- Trailer homes and offices
- Mobile homes
- Garages, sheds, and other isolated structures
Additionally:
Features that do not have a roof covering usable areas, such as an open deck, the top surface of an electrical transmission or cell tower base, platforms for utility equipment, or other structures which do not have a usable “interior” or covered volume, shall not be interpreted for mapping. Also, vehicles, including truck trailers that are parked with or without a tractor attached, boats, airplanes, etc. should not be mapped. However, trailers with any kind of residential or business use such as temporary classrooms, construction site field offices and the like must be captured.
Greenhouses were generally considered not structures, unless attached to a roofed structure. Roofed dugouts of sufficient size were also included as structures. Tanks and covered reservoirs and pools with temporary covers were not considered structures.
Polygon creation had the following guidelines:
- Outlines will usually be made up of orthogonal segments (all segments parallel or at right angles) unless the building is octagonal, round, triangular, etc.
- Outlines are to be traced at the elevation of the eaves or lowest part of the roof adjacent to the exterior vertical walls. If there are multiple roof levels for a single structure then internal boundaries created by joining the separate roofprints must be dissolved. Any part of the structure which is covered by a roof is included, so two buildings connected by a covered walkway are to be represented as one polygon.
- Any roof offset, jog or projection for which all sides are more than 3 feet in length should be captured.
In the creation of the outlines, building “lean” was not compensated for. (MassGIS addressed this issue for part of the state. See the section "Roofprint Shifting" below.) No attributes were included in the creation of the polygons.
Criteria for Acceptance
The interpretation error rate was less than 0.5%, conformance to this standard was determined as follows:
For each of the six delivery areas, MassGIS selected tiles randomly (using a ‘randomizing’ spreadsheet created within MassGIS) from the 2008/2009 aerial imagery. Tiles were selected until the total number of structures in the selected area exceeded 15,000. The roof outlines in the selected tiles were then reviewed against the DigitalGlobe imagery. Additional layers were used to supplement the review, including the LiDAR datasets, and the Property Tax Parcels dataset, especially where LiDAR data were not available.
The error rate was defined using two statistics from the review of the sample tiles for each delivery:
Eo = The number of errors of omission – structures that were missed
Ec = The number of errors of commission – structures that are not in fact structures (as defined above).
The combined error rate for interpretation was calculated to be Eo + Ec.
Roofprint Shifting
Elevated objects such as roof outlines in aerial imagery may appear displaced with respect to the base of the structure. In order to minimize or eliminate the effects of such displacement (often referred to as "building lean"), MassGIS undertook several automated processing steps to shift roofprint polygons as delivered by Rolta. Building lean effect may cause some buildings to cross over into adjacent parcels or overlap other features such as streets and water bodies. The shifting process was performed only in areas where MassGIS' Legacy LiDAR Terrain Data were available (Eastern Mass. inside of I-495; for details see the section "Adjustment Method" below). As a result, many of the shifted polygons better approximate building footprints.
Background on Building Lean
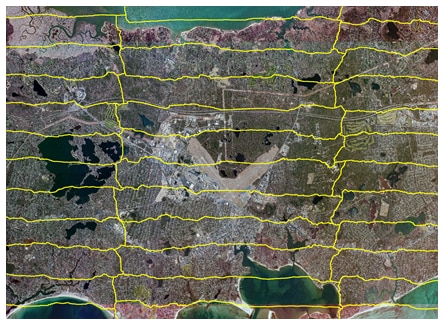
Ortho image data layers are really mosaics made up of portions of many overlapping aerial photo frames. The yellow lines represent the seam lines of these photos:
The principal point of an aerial photo is the intersection of the optical axis of the camera lens and the photo image. The nadir is the point directly beneath the camera at the time of exposure. On a vertical aerial photograph (looking downward) the nadir and the principal point will be at the same location.
If a building is close to the principal point, the roof and base will appear to coincide (the base and sides of the building will not be visible; note the 26-story JFK Federal Building in Boston, at left in the image below):
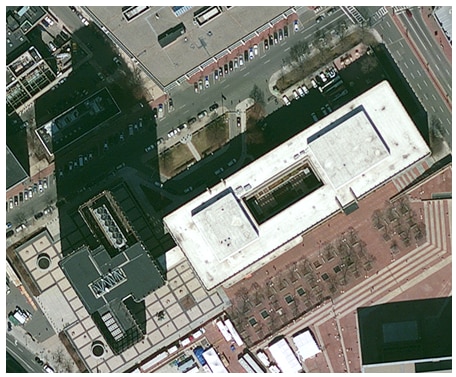
If a building is far from the principal point, toward the edge of the photo, the top of the building will appear to be farther away from the principal point than the bottom of the building. The building will appear to "lean" away from the principal point:
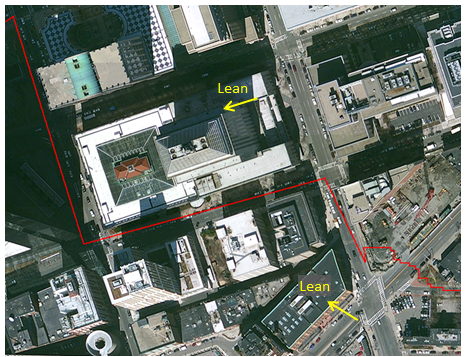
The red line in the above image is the "seam" between two different photos. The buildings on either side of this line are from different photos, so the buildings seem to lean away from their respective principal points.
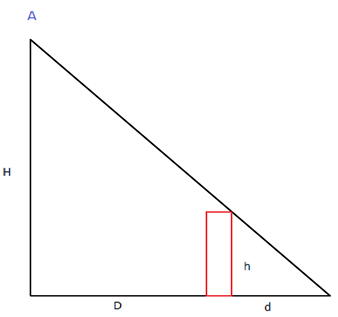
The magnitude of lean can be determined by:
H / (D+d) = h / d
Where H is the camera height, h is the building height, D is the distance of the building from the principal point.
Or, since d is usually much smaller than D, D+d ~ D, so
d ~ ( D / H ) x h
The average height of each building has been obtained from a LiDAR Normalized Difference Surface Model (NDSM). This raster is the difference between the LiDAR last-return elevations, and the LiDAR model of the ground.
It was assumed that the location of each principal point is at the mean center of each seam polygon, and that the aircraft altitude is 5,000 meters.
The lean also has a direction, so polygons representing "roofprints" have been moved a distance d in a direction opposite to the apparent displacement in the photo.
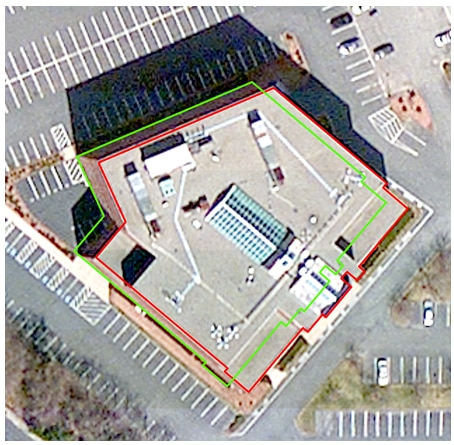
In the image above, the red polygon is the original roofprint; the green polygon is the rectified (shifted) roofprint.
Adjustment Method
MassGIS used five Input Datasets:
- DigitalGlobe 2011-2012 Orthoimagery (six blocks)
- Boston High Value Area
- Worcester High Value Area
- Cape Cod Refresh Area
- Standard Block 4171
- Standard Block 4172
- Standard Block 4272
- NDSM Raster Images for LiDAR Project Areas (see Areas of LiDAR used in Shifting Index Map):
- FEMA 2010-2011: Nashua, Concord River, Charles River, Blackstone, Quincy
- LiDAR for the Northeast
- 2004 SE Massachusetts Pilot
- Buzzards Bay (parts of Bristol and Plymouth Counties)
[Manageable processing areas were determined based on the intersections of these regions.]
For each LiDAR project area, all LiDAR returns were filtered to create two ArcGIS Terrains:
- Any return classified as "Ground" was used in a "Bare-Earth" Terrain
- The last returns classified as "Ground" or as "Unclassified" went into a "Last Return" Terrain
These Terrains were then linearly interpolated to two 1.0 meter rasters. Finally, the Bare-Earth raster was subtracted from the Last Return raster, resulting in a Normalized Difference Surface Model (NDSM).
- Orthoimage polygon tiles (irregularly-shaped "seam polygons") corresponding to each DigitalGlobe area. NDSMs were cut into smaller subimages (tiles) using the seam polygons for the corresponding area.
- Seam center points were determined for each seam polygon.
- Un-recified roofprint polygons (unshifted polygons as delivered by Rolta)
Processing
A model was developed in Trimble eCognition Developer 8.7.2 and run on eCognition Server that determined the distance and direction from each roofprint centroid to the tile's seam center, as well as the mean height the building. Output was a point shapefile.
An ArcGIS Toolbox script that prepared the output points and roofprints for rectification was run, followed by an ArcGIS Python script that created a dataset of shifted roofprint polygons.
The two sets of shifted roofprints in overlapping processing areas were examined, and where there were differences, the roofprints with the more accurate shift were kept.
Roofprints straddling seam lines usually contain two (or more) points with different values for angle and distance. These roofprints were generally not moved, but were coded TOUCH_SEAM = 1 so they could be tracked after processing.
Sources of possible error in the shifting process include:
- The orthoimage used to determine the roofprint
- The roofprint polygon as drawn
- The estimated position of the principal point
- The estimated camera altitude
- The LiDAR NDSM raster
- The estimate of the building height derived from the LiDAR NDSM raster
Situations which may cause the roofprint to shift more or less than it should:
- The building represented by a roofprint was not built at the time of the LiDAR acquisition.
- Trees may overhang a building, so that the elevation obtained may be higher than the building height.
- Greenhouses may be represented in the roofprints layer, but not in the LiDAR.
- A single roofprint representing a complex roof with different elevations may be shifted based on a single elevation value.
In a small number of cases, the shifting process caused some polygons to overlap others. These were found using ArcGIS topology and the polygons were moved manually so that no overlaps were present. Once the shifting process was complete, the shifted polygons replaced those in a copy of the original Rolta deliverable. The version of the Structures dataset distributed by MassGIS, therefore, is a hybrid of as-delivered polygons and those shifted by MassGIS. Finally, MassGIS took the hybrid layer and performed an Identity operation with the Municipalities layer to populate the TOWN_ID fields.
Attributes
Polygons in this layer contain the following fields, all added by MassGIS:
| Field Name | Description |
|---|---|
| STRUCT_ID | Unique polygon identifier, based on X,Y centroid coordinate of the feature in NAD83 Mass. State Plane meters |
| SOURCE | Polygon source. Values include: ROLTA - original compilation by Rolta MAGIS - digitized by MassGIS BLACKSHARK - vectorized by MassGIS using Blackshark AI object detection tools PLANIMETRY, SCANNED_PLAN, HEADSUP_DIG - data delivered by the town of Dedham MAGIS_R - indicates a structure was found by MassGIS during review using newer imagery but the structure was also found in the imagery used by Rolta City of Boston - downloaded from the City of Boston's website |
| SOURCETYPE | Type of feature. Current values are: ROOFPRINT - Roofprint ROOFPRINT_SHIFTED - Roofprint shifted by MassGIS to correct for building lean FOOTPRINT - Building footprint |
| SOURCEDATE | Date (in YYYYMMDD format) of source data used to create the structure polygon. |
| SOURCEDATA | Indicates what imagery was used as a source for digitizing structure polygons. Current values are: DIGITALGLOBE 2011 30CM ORTHO DIGITALGLOBE 2012 30CM ORTHO DIGITALGLOBE 2013 WORLDVIEW2 8-BAND SATELLITE DIGITALGLOBE 2015 WORLDVIEW ORTHO DIGITALGLOBE 2016 WORLDVIEW ORTHO DIGITALGLOBE 2017 WORLDVIEW ORTHO GOOGLE ORTHO MUNICIPAL GIS NAIP 2014 1M ORTHO NAIP 2018 60CM ORTHO NV5 2023 15CM ORTHO NV5 2025 ORTHO PICTOMETRY QUANTUM 2021 15CM ORTHO USGS 2009 30CM ORTHO USGS 2013 30CM ORTHO USGS 2014 30CM ORTHO USGS 2019 15CM ORTHO |
| MOVED | Indicates with "Y" or "N" whether or not a ROLTA-compiled polygon was shifted to account for building lean in source imagery. |
| AREA_SQ_FT | Area of the structure polygon in square feet, calculated with the "Calculate Geometry" tool in ArcGIS software. |
| TOWN_ID | Identifier (1-351) for the city/town in which the structure is located. An ID of "0" (zero) indicates the structure is located out-of-state. |
| TOWN_ID2 | Second identifier (1-351) for the city/town in which the structure is located, if the structure falls within two municipalities. In SDE format this field will be Null if structure falls within one town, 0 if partially out of state. Nulls are converted to zero in shapefile format. |
| TOWN_ID3 | Third identifier (1-351) for the city/town in which the structure is located, if the structure falls within three municipalities. In SDE format this field will be Null if structure falls within one or two towns, 0 if partially out of state and within two Mass. towns. Nulls are converted to zero in shapefile format. |
| LOCAL_ID | Identifier used by local entity. Currently not used as no local data are included in this layer. |
| ARCHIVED | Yes/No code used by MassGIS for editing. Polygons coded 'Y' are deleted and added to the in-house STRUCTURES_POLY_ARCHIVED feature class. Not included in downloads by city or town. |
| ARCHIVEDATE | Date of source imagery MassGIS used when deleting polygons and moving them to the in-house STRUCTURES_POLY_ARCHIVED feature class. Not included in downloads by city or town. |
| EDIT_DATE | When last edited. |
| EDIT_BY | MassGIS staff member who edited the data. |
| COMMENTS | Comments |
2016 Update
In February 2019, MassGIS completed a comprehensive update to the Building Structures layer, capturing changes observed from the original vintage of the dataset (2011/2012) through the summer of 2016. This update was necessary to establish a reasonably reliable baseline for statewide tracking of year-over-year development going forward. Intermittent updates prior to this effort had been conducted on a subset of towns over time and sometimes discovered structures missing from the original creation of the data layer. The resulting patchwork of previous updates had limited ability to provide reliable information about new development annually.
The project to create an updated comprehensive baseline for structure updates began in March 2018. MassGIS staff conducted a complete visual scan was for every town with the exception of Boston (which maintains its own structures data), recording significant differences between the existing structures polygon layer and structures visible (or no longer visible) in ortho imagery compiled through August of 2016. Observed structures greater than 150 sq. ft. that were missing from the layer were added, and structures present in 2011/2012 that had been torn down and not rebuilt were archived and removed from the data layer. Additionally, existing structure polygons were modified if the building roofprint area had changed by 25% or more, or if the shape was notably different. Modifications to existing structure polygons were achieved by archiving the original polygon and digitizing a new feature instead of reshaping existing polygons so an historical record of change could be developed and maintained.
Although every part of the state was visually scanned (billions of square meters), special focus was applied where structure change was indicated from some other source. These sources included:
- An automated change detection product that identified differences between 2015 and 2016 Digital Globe imagery;
- MassGIS' standardized "Level 3" assessors' parcel mapping information where either:
- The data associated with the parcel indicated that it should be developed but no structure-based address point was recorded within that parcel,
- The building area recorded by the assessor had increased by more than 200 sq. ft. when comparing newer parcel data with previous vintages,
- The YEAR_BUILT assessor value for a parcel was greater than 2011;
- MassGIS’ Master Address Database (MAD) address points where either new development or demolition was identified by MassGIS staff in-house or in the field.
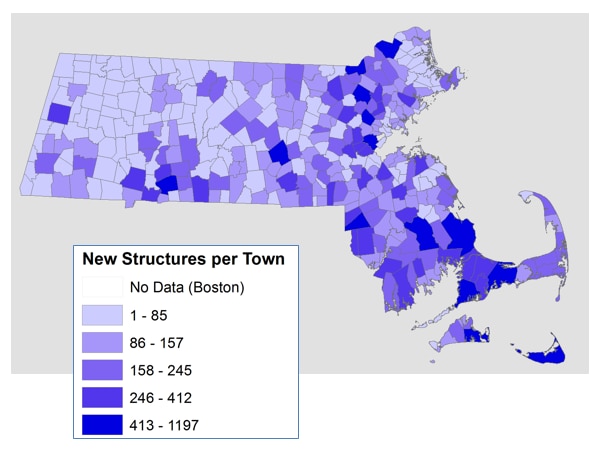
The update process added 49,225 structure polygons and archived 38,408 structures polygons. Types of edits included:
- A new structure polygon added and no existing polygon archived. This edit likely represents new development since 2011/2012 but could represent development missed in the original creation of the data layer.
- An existing structure polygon archived and a new polygon created. This edit represents structure changes like building additions, partial teardowns or redevelopment.
- An existing structure polygon archived and a new polygon not created. This edit likely represents a teardown but could represent an error in the original 2011/2012 data layer.
While the update process captured the vast majority of all missing structures greater than 150 sq. ft. that existed through the first half of 2016, some structures inevitably escaped being recorded. The pilot for this project included a second visual scan of each town. A second pass consistently identified even more missing structures in the pilot phase, reflecting the difficulty of efficient comprehensive photointerpretation over large areas. However, this additional review was excluded from the full-scale project because of staffing and time constraints. In addition, a comparison of Microsoft’s recently published nationwide structure layer to the updated MassGIS structures layer has revealed potential structures not represented in either the existing or archived MassGIS structure polygons. The locations of these potentially missing structure polygons will be reviewed in the next update to capture 2016-2017 structure changes. It should be noted that while there are thousands of candidate structures to review in the Microsoft data that are not in the MassGIS data, there are hundreds of thousands of verified structures in the MassGIS data that are not in the Microsoft data, so it is uncertain how many of these candidates will yield true missing buildings.
2016 Google Imagery was the primary structure identification/validation source for this project. Where Google 2016 data was not available, such as in the western part of the state, other sources were used, including Google imagery from 2015 or 2014. Imagery sources are listed in Table 1:
| SOURCE IMAGERY | NUMBER OF POLYGONS |
|---|---|
| GOOGLE ORTHO | 49074 |
| DIGITALGLOBE 2015 WORLDVIEW ORTHO | 55 |
| USGS 2014 30CM ORTHO | 49 |
| DIGITALGLOBE 2013 WORLDVIEW2 8 BAND SATELLITE | 18 |
| DIGITALGLOBE 2011 30CM ORTHO | 15 |
| PICTOMETRY | 7 |
| DIGITALGLOBE 2016 WORLDVIEW ORTHO | 3 |
| USGS 2013 30CM ORTHO | 2 |
| DIGITALGLOBE 2012 30CM ORTHO | 2 |
The SOURCEDATE field in the structure polygon attributes indicates the vintage of the imagery source used to visually validate and confirm the existence of a building. It is recorded in YYYYMMDD format. If the month and/or day of a given imagery source’s vintage is unknown, they are replaced with values of “00” respectively. I.E. if it is only known that the imagery used for a given building’s identification was acquired in 2016, the SOURCEDATE field will contain a value of “20160000”.
Boston Data
In August 2019 MassGIS replaced the original Rolta-produced Boston structure polygons with those obtained from the City of Boston in March 2019. The city's data are more current and slightly more precise. MassGIS also added a few large structures built recently that were not in the Boston data.
Maintenance
In July 2021 MassGIS completed an update using 2019 imagery, using methodology similar to the 2016 update. In September 2022, MassGIS completed the statewide update based on 2021 imagery. Additional updates based on 2021 imagery were published in November 2023. Updates based on 2023 imagery were published in November 2024. Updated based on 2025 imagery for portions of Cape Cod were published in January 2026. MassGIS used the 2025 imagery, with assistance from Blackshark AI object detection tools, to make statewide updates (except for Boston) published in May 2026. Future updates will use newer aerial imagery.