This article reviews and analyzes data as it relates to a previously published City & Town piece on the Motor Vehicle Excise (MVE) tax. The Bureau of Local Assessment (BLA) focused on the administration of the tax, the formula, exemptions and abatements. This article provides historical statewide context over the past two decades derived from the Local Receipt Estimate vs. Actual report that provides data going back to FY03 showing how actuals compared vs. the budgeted amount for all Page 3 Local Receipts for each of the 351 municipalities. For those interesting in the MVE data, utilize the “Receipt Type” dropdown and then export into Excel. Additionally, the Trends in Local Receipts Dashboard visualization allows the user to choose a municipality and see trends in each chosen Local Receipt over a multi-year period. Similar to the other report simply choose “MVE” in the “Local Receipt Category” dropdown to display the trend data. We hope you find the following review helpful and informative.
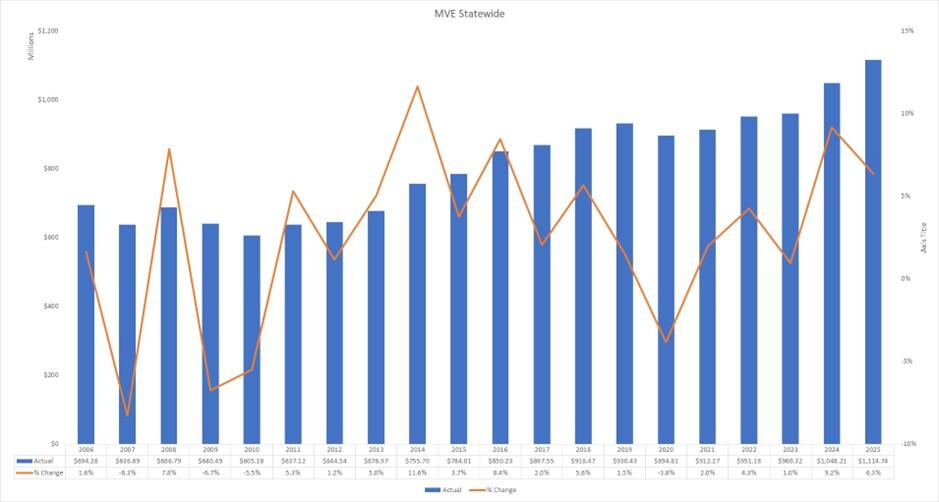
Based on FY25 actuals, MVE was the largest Local Receipt for approximately 90% of all municipalities, totaling $1.1B. For FY26, the statewide total budget for this Page 3 Local Receipt is $991M, an increase of 8% over the FY25 budgeted amount of $917M and an amount $123.6M (11%) below the FY25 actual. As depicted in the graph below, actual MVE collections have increased every year except for four over the past two decades, growing from $694M in FY06 to $1.1B in FY25.
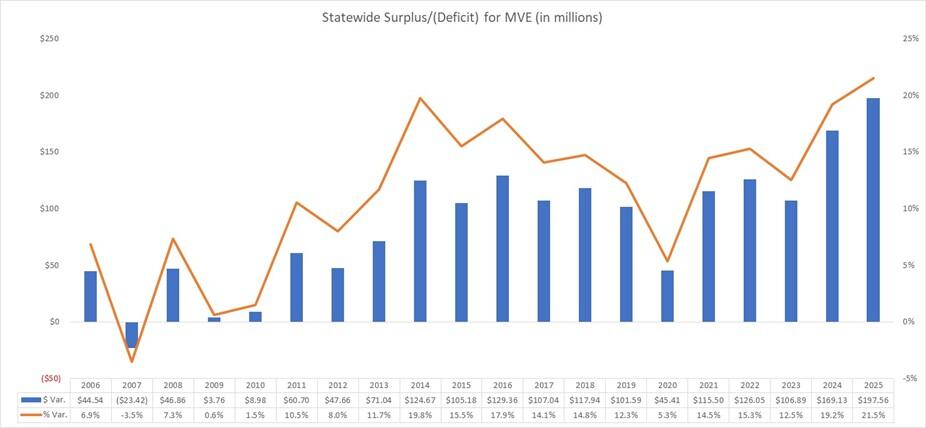
The next graph shows the actual vs. budget experience for the past two decades. Note there was only one year (FY07) when actuals came in under budget. The largest surplus on a percentage basis was FY14 at 19.8% while the lowest was FY09 at 0.6% (aside from the deficit noted in FY07).
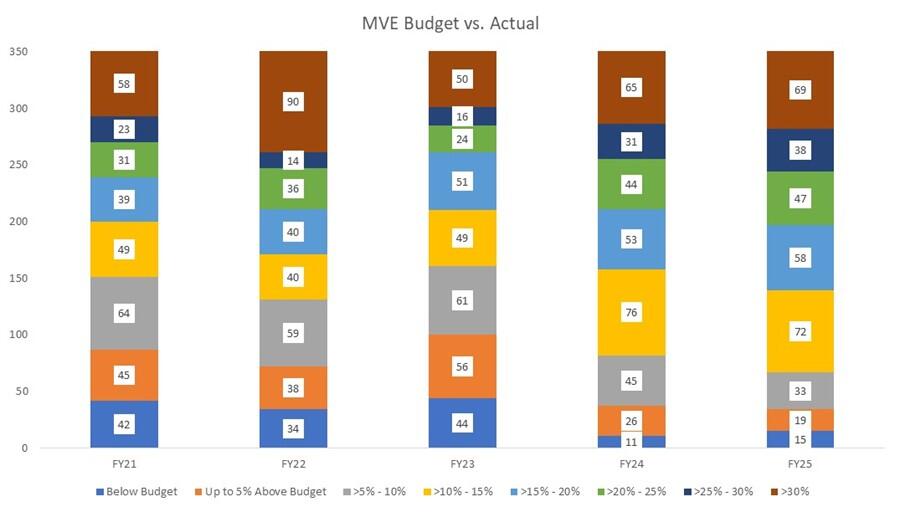
The next graph highlights the distribution of municipalities based on the size of annual budget surpluses/deficits for the past five years. The distribution for each of the last two fiscal years has been consistent, with the smallest range being below budget and the largest being actuals at more than 30% above budget.
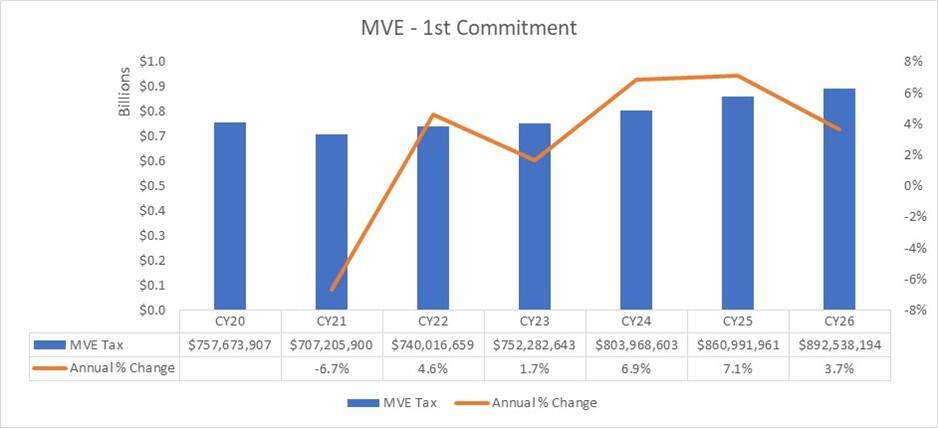
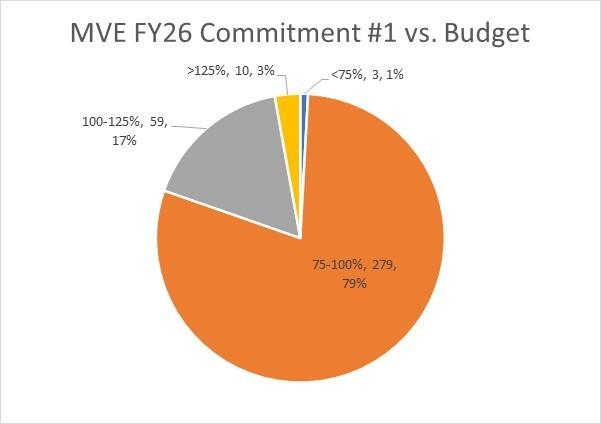
A commitment establishes the liability for individual taxpayers and the Registry of Motor Vehicles normally produces eight or more commitments per calendar year. The first commitment of the calendar year is the largest, regularly comprising 65% - 75% of a municipality’s total annual commitments. The graph below provides a multi-year history of the first commitment and shows that it has increased each year since CY21.
Since the first commitment comprises such a large portion of annual MVE revenue, the first commitment relative to a municipality’s annual budget estimate is a strong indicator of how this important revenue source will perform against the budget used to set the tax rate. Using the MVE estimates from Page 3 of the FY26 Tax Rate Recap, the graph below shows that the first commitment comprises less than 75% of the annual budget estimate for just three municipalities. For every other municipality, their first commitment was either near the 75% threshold or actually over the full year estimate, a positive sign for FY26.
We hope you've found this article interesting and informative. If you have feedback or suggestions for future City & Town analysis, contact us at dls_alerts@dor.state.ma.us.
Helpful Resources
City & Town is brought to you by:
Editor: Dan Bertrand
Editorial Board: Tracy Callahan, Sean Cronin, Janie Dretler, Brianna Ortiz, Christopher Ketchen, Paula King, Jen McAllister, Jessica Sizer and Tony Rassias
| Date published: | March 19, 2026 |
|---|