
C.1 Stakeholder Research Design
The administrative data describes the shape of the licensing system. It does not show what obtaining a license costs in time or money, why an application or a petition failed, or what a prospective licensee could find out before starting. The stakeholder research exists to answer those questions and test whether the patterns in the data correspond to what people inside the system experience.
Three groups were approached because each sees a different part of the system. Municipal officials administer local licensing and file home rule petitions; they can describe the process from the inside and report what their municipality has tried. Business owners apply for, buy, and hold licenses; they are the only source for what a license actually costs and how long it takes. State officials administer the statewide framework. Where the two principal groups disagree, the disagreement is itself evidence, and this report reports them separately rather than pooling them for that reason.
Survey and interview evidence is used to document that experiences occur, to describe their character, and to corroborate patterns the quantitative analysis identifies independently. It is not used to estimate how common anything is.
C.2 Survey Methodology and Respondents
The target population was municipal licensing officials in all 351 municipalities, on-premises license holders and applicants, and state officials with licensing responsibilities. The survey was distributed through municipal and industry channels between December 2025 and February 2026 rather than to a drawn sample, so respondents self-selected into it. Because distribution was by open channel, the number of people who received the invitation is not recorded, and no response rate can be computed.
The instrument combined structured items—yes/no questions and one-to-five rating scales—with open-ended questions inviting respondents to describe their experience in their own words. Rating batteries covered seven potential barriers to obtaining a license (cost, availability, competition, time to obtain, process complexity, location restrictions, and regulatory compliance), five dimensions of the § 12D conversion process, and six factors bearing on license decisions. Open-ended prompts covered cost, fairness and equity, home rule petition experience, ABCC oversight, administrative delay, information availability, and recommendations. The instrument is summarized in Appendix D.
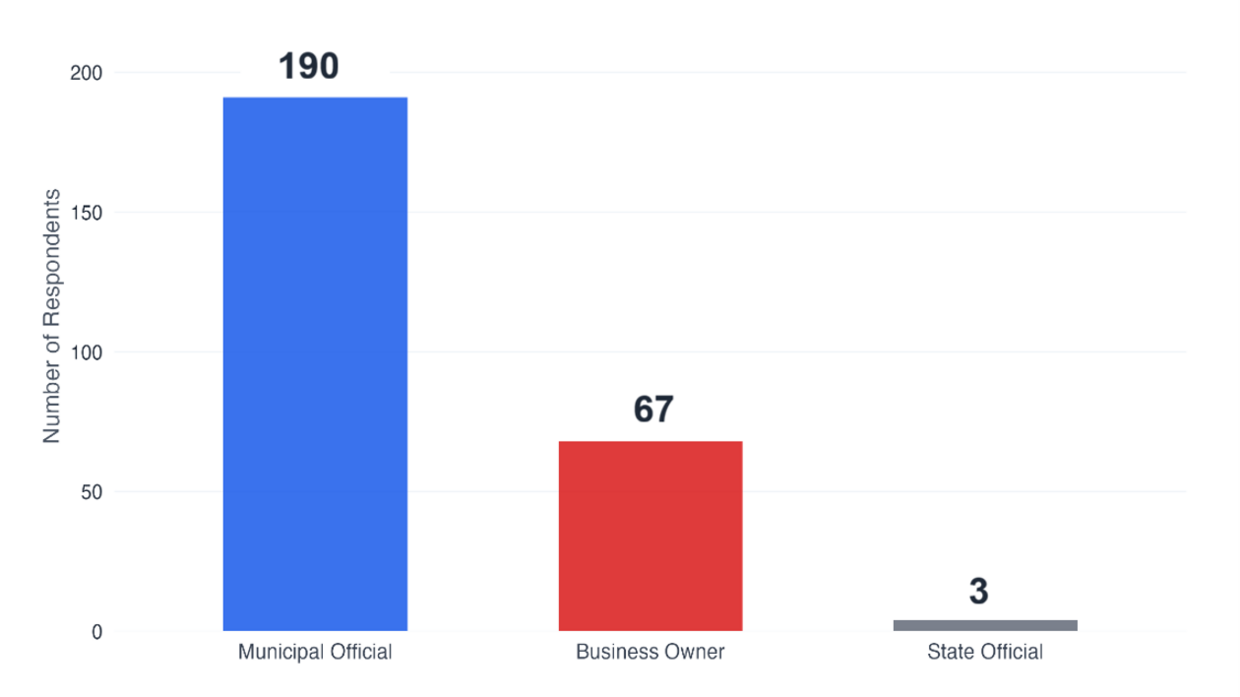
The survey received 260 responses: 190 from municipal officials, 67 from business owners, and 3 from state officials. Among the municipal officials, 160 represent quota‑bound non-Gateway municipalities, 13 represent Gateway Cities, and 17 represent local-control municipalities. The municipal officials survey sample covered 43% of the Commonwealth’s 351 municipalities.
Responses were exported to a single database and cleaned before analysis. Municipality names were standardized and matched to the classification used in Appendix B so that a respondent’s answers could be read against their municipality’s licensing status. Open-ended responses were coded to 12 themes by keyword search, followed by a manual review of every matched response; frequencies are counts of respondents whose text matched a theme, not counts of mentions, so a respondent who raised a theme repeatedly is counted once. Coding was performed by a single analyst, with manual review of every matched response, with extensive peer review. Rating items are reported as means and distributions. No scale scores were constructed, and no inferential testing was performed on survey items.
C.3 Survey Results
The results in Figure 34 are organized by theme and correspond to the findings they support. Percentages are of respondents in the group named, and the group is stated in every case because the two principal groups differ sharply on several items.
Figure 34. Who Responded: 260 Respondents by Role
Thematic Findings
The Cap System and Resale Market
Of the six themes that ran through the survey, this one came up most often. It is also the theme around which the most reform energy concentrates. This section sets out what the cap is, what respondents reported about its consequences, and how the resale market that has grown up around it functions in practice.
Under MGL Chapter 138, each municipality receives a fixed number of on-premises liquor licenses based on its population. Once a municipality has issued all of its allotted licenses, no new licenses are available. A restaurant that wants to open in a municipality with no licenses available cannot simply apply; it must buy a license from an existing holder on the private market or persuade the state Legislature to pass a special bill creating one more. The quantitative analysis confirms that 64 quota-bound municipalities have used 80% or more of their allotted licenses. In these communities, the only path to a license is money or the political resources required to pursue a special bill at the State House.
The survey asked respondents to rate barriers, describe their experiences, and explain their views in their own words. One topic surfaced more often than any other, by a wide margin: the state-imposed cap on on-premises liquor licenses. Out of 260 respondents, 96 (37%) raised supply constraints or the quota system in their open-ended responses. Among municipal officials, 76% confirmed that their municipality’s licenses are subject to quota limits; 13% were unsure—a notable gap in regulatory awareness among the people who administer the system.
Figure 35. What Respondents Talked About Most in Open-Ended Commentary
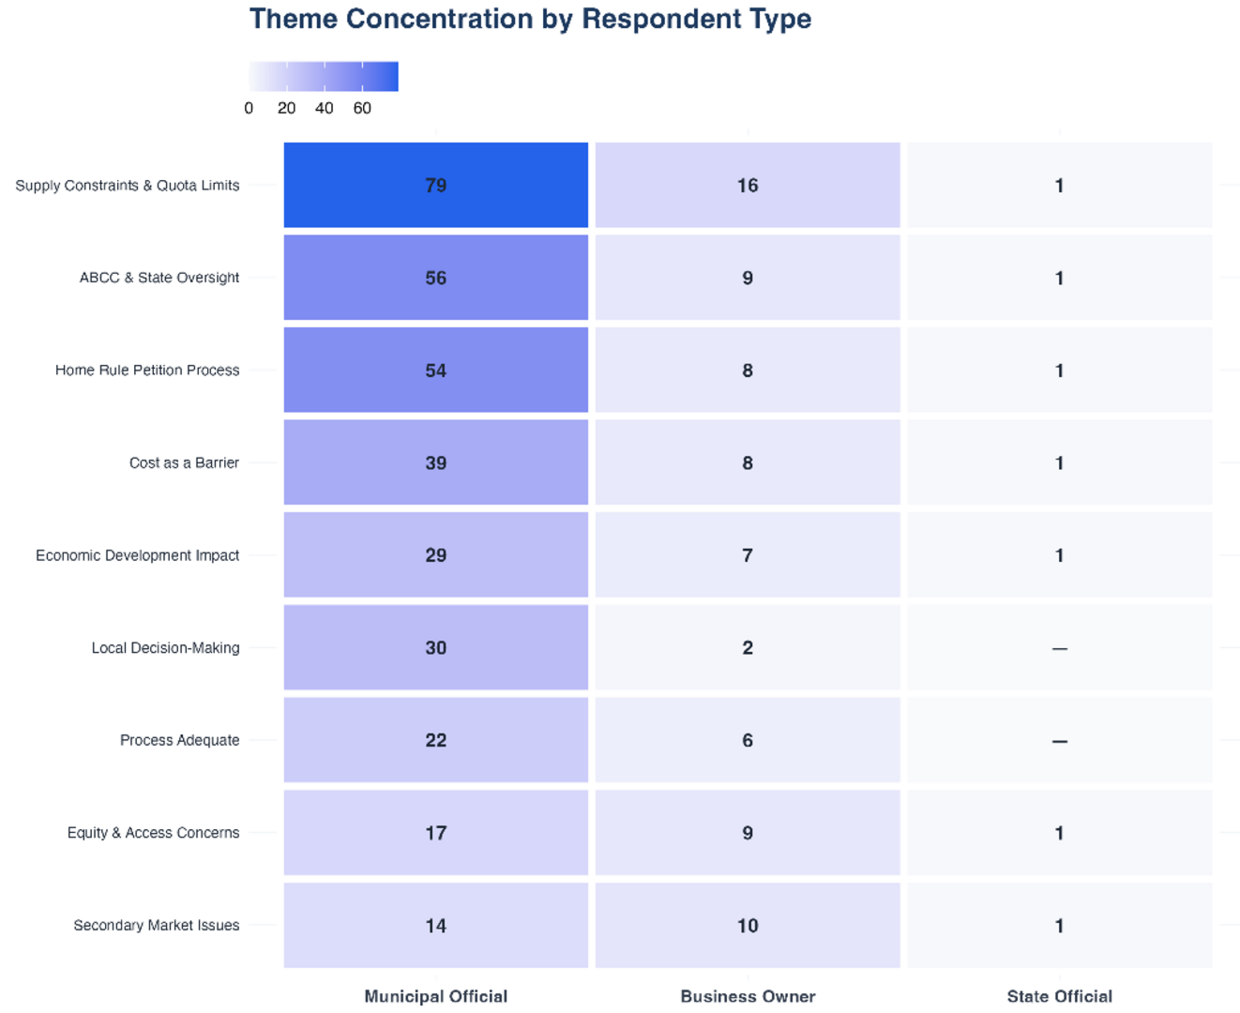
What respondents said about the quota system depended almost entirely on where they sat. Officials in unconstrained municipalities described a system that works: Applicants pay the fee, file paperwork, and get a license. Officials in constrained municipalities described something fundamentally different: businesses that could not open, restaurants that left for neighboring towns, and storefronts that stayed vacant because no license was available. Several noted that the population-based formula does not account for tourism, commercial density, or economic need. A coastal tourist town is held to the same per-capita cap as a bedroom community. Business owners focused on the cost of buying a license on the private market, the concentration of licenses among a small number of holders, and the competitive disadvantage of operating without a full liquor license while waiting months or years for one to become available. The quotes that follow this section illustrate each of these experiences.
The scarcity created by the quota has produced a private market for licenses. Business owners who acquired their licenses through the resale market reported what they paid. The prices ranged from $2,500 in Cambridge (a local-control municipality) to $600,000 in Boston. Respondents reported paying $400,000 in Boston’s North End, $175,000 in Somerville, $100,000 in Beverly, and $50,000 in Agawam. In a municipality at quota, the cost of entering the market can exceed the startup cost of the business itself.
Sixty-one business owners reported how they acquired their licenses, and some reported using more than one pathway: 19 business owners (31%) acquired a license through a secondary-market transfer, purchasing an existing license from another holder; 9 (15%) went through the home rule petition process; and 35 (57%) obtained a license through a new application alone, a route that is unavailable in municipalities that have exhausted their quota. Taken together, these numbers suggest that the resale market has become the de facto allocation mechanism for licenses in capped municipalities, the way new operators get in. The consequences of this dynamic are inflated costs, barriers to new businesses, the reliance on home rule petitions, and the concentration of licenses among a small number of holders.
The barrier ratings in the survey reinforce this. When business owners rated seven factors as potential barriers to obtaining a license on a 1 to 5 scale, the secondary‑market purchase price drew the strongest response: 24% of business owners rated it a 5 (strongly agree), the highest of any factor, with the highest mean of 3.37 out of 5. A general “other costs” option (3.36), the length of ABCC processing (3.33), and application and processing fees (3.27) followed. These ratings could understate the problem, because business owners who could not afford a license never entered the survey pool; they could also overstate it if owners with especially difficult experiences were more inclined to respond. With respondents self-selecting into the survey, the direction of any bias cannot be determined. The ratings, in short, point back to the same downstream consequence: When the state caps the number of licenses, the only way to get one in a fully allocated municipality is to buy it on the private market.
Cost and Fairness
If the cap is the most frequently cited grievance, the cost-and-fairness numbers are where the survey reveals the deepest split between the two groups closest to the system. This section sets out where the gap is widest and what the open-ended answers suggest is driving it.
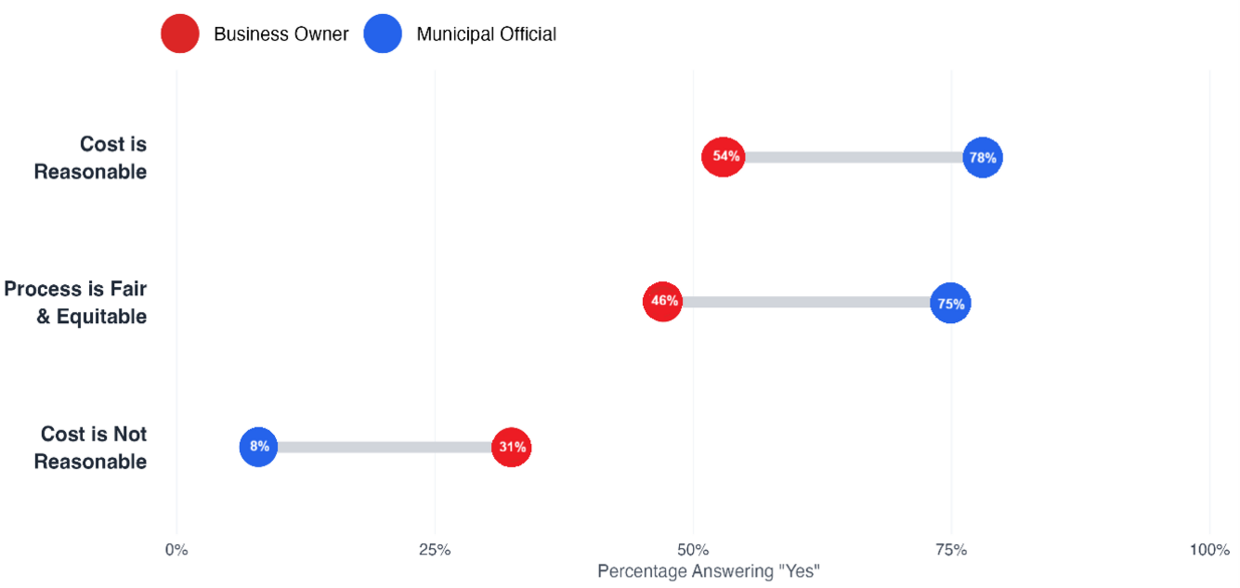
The quota system’s cost consequences do not land equally on the people inside it. The survey asked both municipal officials (n = 190) and business owners (n = 67) the same core questions about cost and fairness. On cost, 78% of municipal officials said the cost of acquiring a license is reasonable; only 54% of business owners agreed (36 of 67), a 24-point gap. Twenty-one business owners (31%) said cost is not reasonable, versus 15 officials (8%). On whether the process is fair and equitable, 75% of officials said “Yes,” compared to just 46% of business owners, a 29-point gap. Seventeen business owners (25%) said it is not fair. These were the widest and most consistent gaps in the entire survey.
The open-ended responses provide a clear answer as to why two groups within the same system would see it so differently. Municipal officials are evaluating the part of the system they run: the application form, the public hearing, and the municipal fee (typically a few hundred dollars). Business owners are evaluating the part they experience: the private-market price of a license (potentially $500,000 or more), the legal fees, the months of waiting, and the competitive consequences of not being able to serve alcohol while a rival can. Both groups are describing the same system accurately, but they are describing different parts of it.
The three state officials who responded reinforced these concerns: Two of the three said the process is not fair, and they identified stakeholder opposition, legislative opposition, and lack of public awareness as barriers to reform.
Figure 36. The Perception Gap: Municipal Officials vs. Business Owners on Cost and Fairness
Local and State Processes
The survey asked respondents to evaluate licensing at two distinct altitudes. The local process, which a municipal clerk or licensing board administers, is one thing. The state process, which sits above that and includes ABCC and the home rule petition route, is another. Respondents drew a sharp line between them.
The survey asked municipal officials to rate the efficiency of their local licensing process on a one-to-five scale. The results were strongly positive. Over 80% of municipal officials rate the local licensing process as efficient or very efficient. Only 6% (11 officials) rated it inefficient or very inefficient. On processing time, 45% (86 officials) reported completing applications in one to two months, and 19% (36 officials) in less than one month. These are strong marks for the local piece of the system.
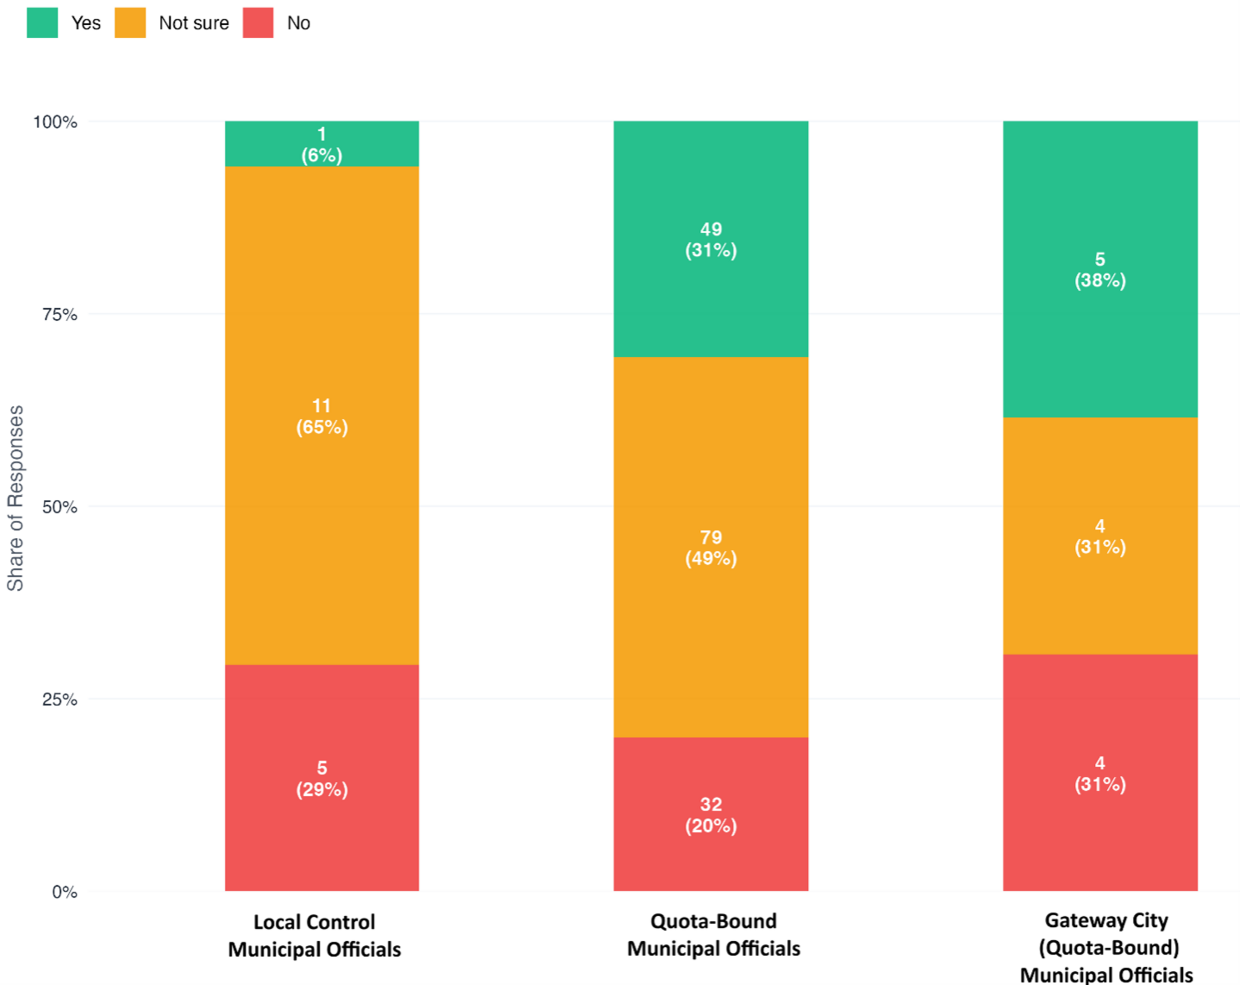
The other piece, the statewide framework that sits above local administration, is where business owners expressed the greatest frustration. Municipal officials most often traced delays to omissions or errors in the applications themselves (106 responses). Among the stages the state and the local authority control, review by ABCC led at 88 responses, followed by scheduling hearings (45) and publishing notice (33); litigation and appeals were rarely cited. The home rule petition process drew the sharpest criticism. (Under that process, a municipality must go through the state Legislature to obtain even a single additional license.) When asked whether that process is fair, 49% (94 officials) answered “Not sure,” 22% (41 officials) said “No,” and only 29% (55 officials) said “Yes.” Of all the officials who responded, 34% report their municipality has engaged with the Legislature on a home rule petition; 30% were unsure.
Business owners confirm this disconnect from the other side. When asked whether they experienced administrative roadblocks that caused delays, 33% (22 of 67) said “Yes”; 6 did not answer the question. Their explanations describe ABCC investigators who failed to process applications, zoning boards that reversed their own decisions, town administrators who did not know how to file paperwork, and month-long waits with no explanation.
Figure 37. Where Delays Occur in the Licensing Process
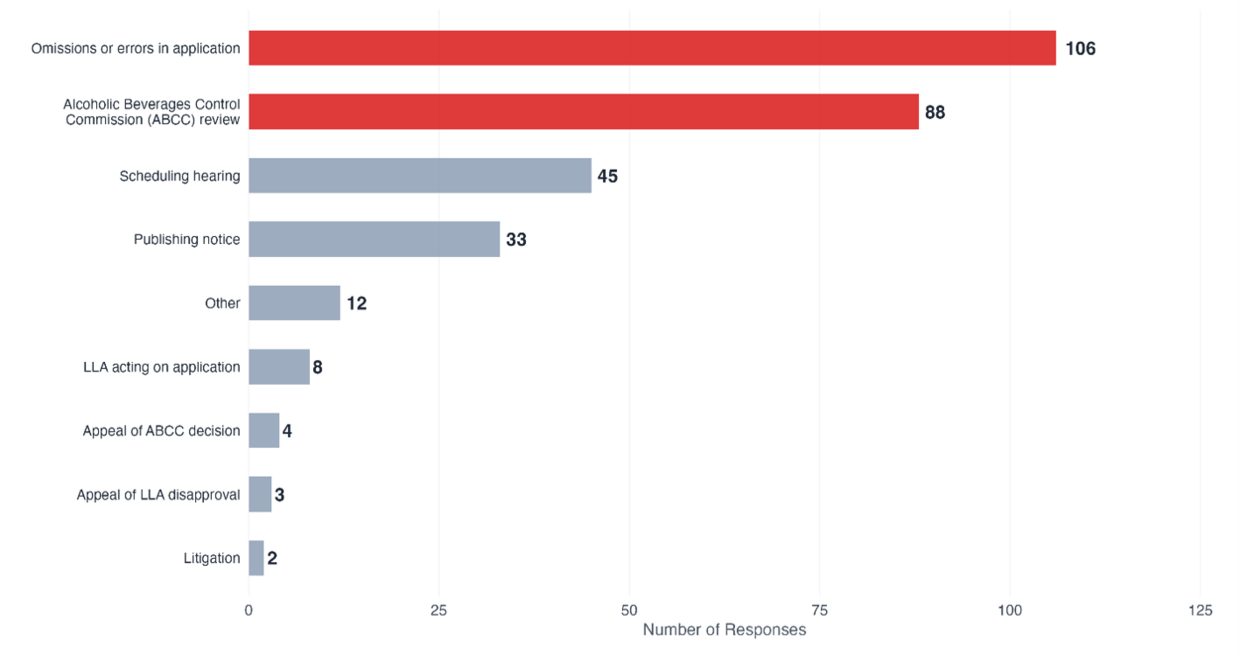
Figure 38. “Does This Factor Pose a Barrier to Obtaining a License?”
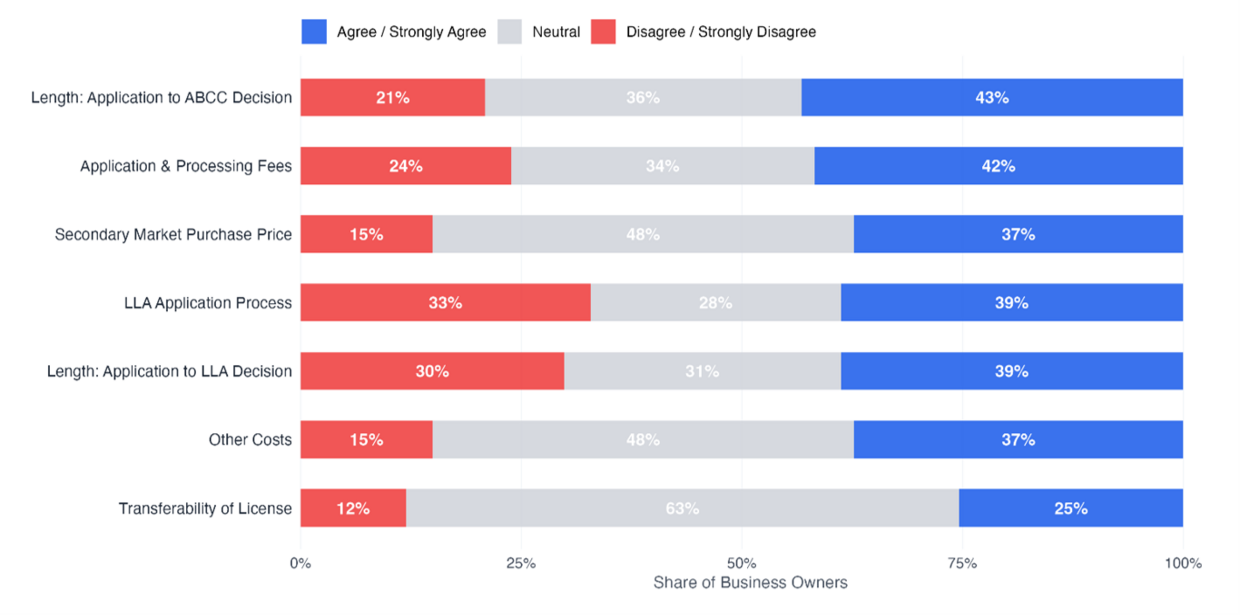
Figure 39. Is the Home Rule Petition Process Fair? Municipal Officials Weigh In
Broad Support for Local Control
Across the structured ratings and the open-ended answers, one direction kept emerging: Respondents wanted licensing decisions made closer to the communities that live with their consequences. This section sets out how strongly the two main groups expressed that preference.
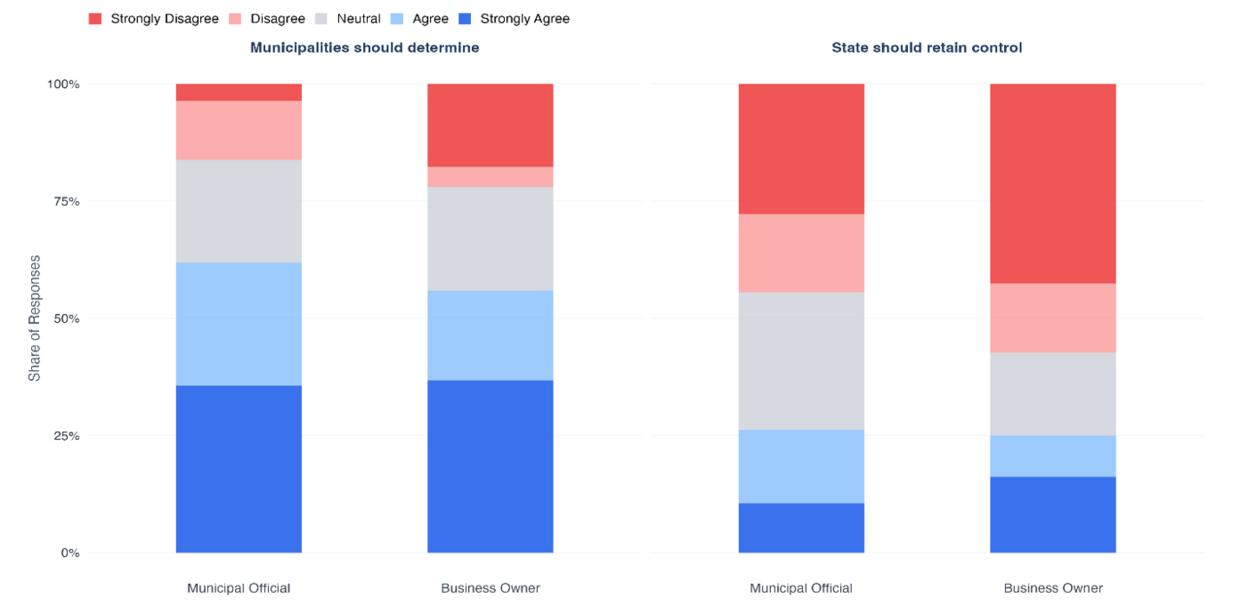
The survey asked respondents whether the state should continue to control the number of licenses in each municipality. The results point clearly toward local authority. Among municipal officials, 45% (85 of 190 officials) disagreed or strongly disagreed that the state should retain control; only 26% (50 officials) agreed. When asked the inverse, whether municipalities should control their own license numbers, 62% (118 officials) agreed or strongly agreed, and only 16% (31 officials) disagreed.
Business owners felt even more strongly: 43% strongly disagreed that the state should retain control, double the 21% share among officials. In the open-ended responses, 32 respondents wrote explicitly that municipalities should decide for themselves how many licenses to issue, and several described the current framework as an outdated relic of the Prohibition era. The most forceful statements came from officials in quota-bound municipalities, who said the cap prevents them from carrying out their own economic development plans.
Figure 40. Should the State Control the Number of Licenses? Both Groups Lean Toward Local Authority
Section 12D
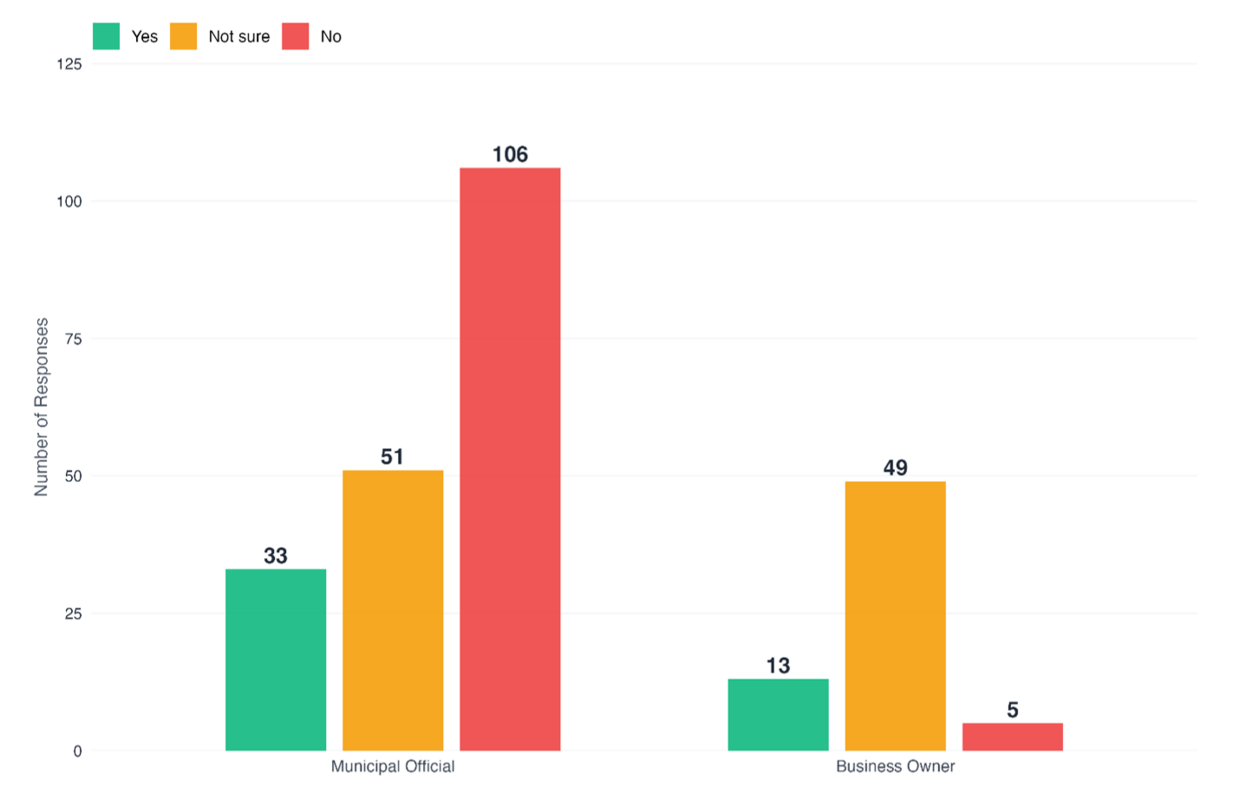
Section 12D of MGL Chapter 138 allows a municipality to let existing Wine-and-Malt license holders convert to All-Alcohol licenses, a way to expand access without touching the quota. But most respondents had never heard of it. Of 67 business owners, 73% (49) were unsure whether any municipality where they hold a license had adopted it; only 13 said “Yes,” and 5 said “No.” Among those 13, only 2 reported having applied to convert a license. Among municipal officials (n = 190), 56% (106) said their municipality had not adopted it, 27% (51) were unsure, and only 17% (33 officials, from 25 municipalities) said “Yes.” Of the 148 municipalities that answered the follow-up question on future adoption, 81 said their municipality is not currently considering § 12D, 42 did not know, 14 said “Yes” without a timeline, and 11 said “Yes” within 12 months. Of the 8 officials who reported that their LLA had set a specific conversion fee, 5 reported a fee of zero, which suggests that financial barriers are minimal where the statute is actually used. The statute appears underutilized as of this moment. That may reflect a lack of interest, a lack of awareness, or both.
Figure 41. Section 12D Awareness: Most Respondents Are Unsure Whether It Applies to Them
License Expansion Is Not Seen as a Public Safety Risk
One of the longest-standing arguments against expanding the number of liquor licenses is public safety. The survey asked the people closest to the system whether that concern is warranted, and the response was clear.
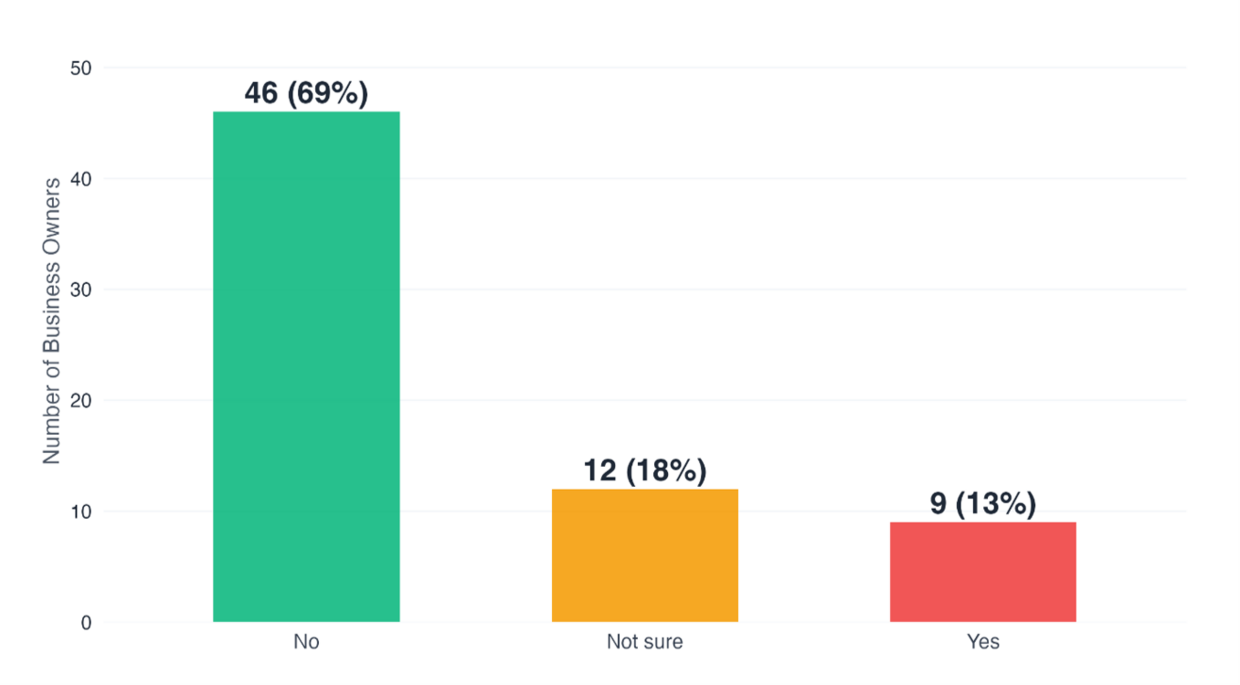
The survey asked business owners whether increasing the number of on-premises licenses would create a public safety concern. 69% (46 of 67 business owners) said “No,” 13% (9 business owners) said “Yes,” and 18% (12 business owners) were not sure. When asked separately whether their municipality provides responsible oversight, 82% (55 of 67 business owners) said “Yes.” Municipal officials were not asked the safety question directly, but when asked to rate public safety as a factor in their § 12D decisions on a 1 to 5 scale, 66% of municipal officials (125 of 190) chose the neutral midpoint, suggesting that most officials do not view license expansion as a significant safety issue either. Several respondents made the case that more licenses could actually improve safety by filling vacant storefronts and creating competitive pressure on bad actors.
Figure 42. Business Owners on “Would More Licenses Create a Safety Concern?”
C.4 Interview Methodology
Interviews were conducted in 2026. Interview participants were identified in two ways: from survey respondents who indicated willingness to speak further and from a purposive recruitment list built to cover the range of positions in the system. The recruitment list named 29 participants across nine priority tiers: two state legislators, 11 license holders, and 16 municipal officials, including town managers, mayors, councilors, licensing officials, and economic development staff members. Participants were selected to span constrained and unconstrained municipalities, quota and local-control statuses, and both successful and unsuccessful applicants.
Interviews were semi-structured and followed a common written protocol covering six topics: how the participant experiences the current quota and, where applicable, the local-control alternative; the process of obtaining or transferring a license, including cost and elapsed time; the experience of the home rule petition pathway; what information was available and where it was found; the effect of licensing on business formation or municipal development; and what the participant would change. Interviewers followed the protocol but were free to pursue matters a participant raised. The protocol is reproduced in Appendix D.
Responses were recorded in contemporaneous notes and, where available, transcripts. Quotations reproduced in the report were checked against the source record before publication. Where a participant describes a third party’s reasoning—for example, what a legislative committee told them—the report attributes the account to the participant.
Interview material was analyzed thematically against the same theme framework used for the open-ended survey responses, so that the two streams could be read together. The theme map was built retrospectively from the interview record rather than coded prospectively and is illustrative rather than a measured distribution.
C.5 Interview Findings and Thematic Analysis
Six themes recur across the interviews and the open-ended survey responses. For each, the account below states who expressed it, what the underlying evidence is, and how it relates to the quantitative or legal findings.
Supply constraint is experienced very differently depending on where a respondent sits. This was the most frequently coded theme, appearing in 96 open-ended responses. Officials in unconstrained municipalities described a system that works: An applicant pays the fee, files the paperwork, and receives a license. Officials in constrained municipalities described businesses that could not open and restaurants that became licensed in neighboring towns. Both accounts are accurate about the municipality making them, and the split corresponds directly to the utilization distribution in Finding 1. This is the clearest instance in the study of qualitative and quantitative evidence describing the same structure from different positions.
Cost is the point of sharpest disagreement between the two groups. Cost was coded in 48 responses, and the two groups are evaluating different things. Municipal officials assess the part of the system they administer: the application, the hearing, and a municipal fee, typically in the hundreds of dollars. Business owners assess the part they encounter, which in a constrained municipality is a secondary-market price. The disagreement is not a contradiction; it is evidence that the cost of a license is invisible to the officials who issue it. Business owners rated cost the highest of the seven barriers.
The home rule pathway is described as opaque rather than hostile. Coded in 63 responses and pursued in most municipal interviews. Participants did not generally report that petitions are denied. They reported that they cannot tell in advance what will succeed, that outcomes turn on committee preference and legislative relationships, and that no written criteria exist. Municipal officials and the legislator who were interviewed agreed on the mechanics and differed on whether the discretion is appropriate. This theme supplies the mechanism that the special legislation analysis in Finding 4 can only describe from the outside.
ABCC oversight draws process complaints rather than substantive ones. Coded in 66 responses. Respondents were largely positive about ABCC staff members, and about the move to digital licensing, and negative about visibility: They cannot see where an application stands, who is handling it, or what remains outstanding. Business owners reported more frustration with the statewide framework than with local administration, while municipal officials rated their own local process highly. This asymmetry is the evidentiary basis for Recommendation 4.
The secondary market is understood as a consequence of scarcity, not as a market failure. Coded in 25 responses and central to the business-owner interviews, license holders in constrained municipalities described licenses as tradeable assets and, in one case, as “commodities trading.” License holders in local-control municipalities described acquisition costs at or near routine fees. Fourteen reported transactions substantiate the pattern; their distribution is set out in Finding 4.
Support for local decision-making is broad and crosses both groups. Coded in 32 responses, with a further 28 coded as regarding the current process as adequate, both groups leaned toward local authority over license numbers, business owners more strongly than officials. The minority position—that state control protects existing investment and guards against oversupply—was expressed clearly enough by municipal officials to be reported as a disagreement rather than a fringe view.
Two areas of genuine disagreement should be recorded. Municipal officials and business owners disagree about whether the process is fair, and the disagreement tracks their position in it rather than their municipality. And respondents disagree about public safety: Most business owners and most municipal officials did not regard additional licenses as a safety concern, but a minority of officials argued that unrestricted licensing would produce outlet density with attendant risks. The report records both.
C.6 Survey and Interview Limitations
- Self-selection. Respondents chose to participate. Those with strong views about licensing are likely over-represented, in both directions.
- Composition. Municipal officials outnumber business owners nearly three to one, so any figure pooled across all respondents would be weighted toward the administrators of the system rather than its applicants. This report reports the groups separately for that reason. Three state officials are too few to characterize that group, and their responses are quoted rather than counted.
- Truncation at the point of entry. Business owners who could not afford a license, or could not obtain one, are largely absent from the pool. Barrier ratings should therefore be read as a floor.
- No response rate. Distribution was by open channel, and the invited population was not recorded, so participation cannot be expressed as a rate, and non-response bias cannot be assessed.
- Coding and theme mapping methods, and their limits, are described in C.2 and C.4.
- Self-reported figures. Transfer prices, fees, and processing times are as reported by respondents. No public record of transfer prices exists against which they could be verified.
- Non-representativeness. Neither the survey nor the interview set is a probability sample of any population, and no result from either is presented as representative of all municipalities or all license holders.
| Date published: | October 13, 2026 |
|---|