Massachusetts State Seal An official website of the Commonwealth of Massachusetts Here's how you know

Official websites use .mass.gov

A .mass.gov website belongs to an official government organization in Massachusetts.

Secure websites use HTTPS

A lock icon or https:// means you've safely connected to the official website. Share sensitive information only on official, secure websites.

Finding 1 - License to Pour: Access & Equity in Massachusetts Liquor Licensing Report

The state-imposed population-based quota formula creates supply and demand mismatches in on-premises liquor licensing.

Every restaurant or bar in Massachusetts that serves alcohol must hold an on-premises liquor license.60 Under MGL c. 138, §17, the Commonwealth allocates on-premises liquor licenses to most municipalities through a population-based quota formula overseen by ABCC. LLAs decide whether to issue licenses within that statutory limit, subject to ABCC review and approval. Across responses to the stakeholder survey, concerns about the quota system were the single most-discussed topic in open-ended responses, appearing in 37% of responses.61

The quota formula sets how many on-premises licenses a municipality may issue based on its population according to the most recent federal census. First, the formula allocates to each quota municipality62 one All-Alcohol license for every 1,000 residents (or fraction thereof, meaning a partial count, whether 1 or 999, is counted as a whole 1,000).63 Second, when the population of a municipality exceeds 25,000 residents, the formula allocates one additional All-Alcohol license for every 10,000 residents (or fraction thereof) above 25,000.64 For example, Andover, with 36,485 residents, is allocated 39 all-alcohol licenses, calculated as follows:

  • one All-Alcohol license per 1,000 residents: 36,485 residents, rounded up to the next 1,000 (37,000 residents), divided by 1,000 = 37 All-Alcohol licenses; plus
  • one additional All-Alcohol license per 10,000 residents above 25,000: 36,485 residents – 25,000 = 11,485, rounded up to the next 10,000 (20,000 residents), divided by 10,000 = 2 additional All-Alcohol licenses.

Regardless of population, each quota municipality is allocated at least 14 All-Alcohol licenses.65

With respect to Wine-and-Malt licenses, the formula allocates to each quota municipality one Wine-and-Malt license for every 5,000 residents (or fraction thereof, meaning a partial count, whether 1 or 4,999, is counted as a whole 5,000).66 Andover is allocated eight Wine-and-Malt licenses, calculated as follows:

  • one Wine-and-Malt license per 5,000 residents: 36,485 residents, rounded up to the next 5,000 (40,000 residents), divided by 5,000 = 8 wine-and-malt licenses.

Regardless of population, each quota municipality is allocated at least 5 wine-and-malt licenses.67 (See Figure 6 for an on-premises quota formula calculation visualization.)

This Finding examines the mismatch between license supply and demand, resulting from the state-imposed population-based quota formula. This study’s analysis of license utilization demonstrates the disproportional impact of the formula on quota municipalities of varying populations.

There are 64 quota municipalities that face artificial license scarcity created by the state-imposed population-based quota formula.

The population-based quota is a crude instrument: It sets each municipality’s license ceiling from resident headcount alone and ignores other conditions repeatedly identified by interviewees and survey respondents as driving local demand. Chief among them are seasonal and tourism populations—municipalities in which the service population swells far beyond their resident count for part of the year. In the survey, 21 respondents—many from Cape Cod (e.g., Dennis, Truro, and Wellfleet), the Islands (e.g., Edgartown and Nantucket), and coastal communities (e.g., Rockport)—cited tourism or seasonal populations as a factor the formula misses.68 

A municipal official from the Town of Lee, with a resident population of 5,694, in Berkshire County, described exactly this mismatch: “The quota doesn’t really take into account our seasonal population. Just one timeshare resort almost doubles our population in the summer, and that’s not taken into account.”69 Lee is one of the 26 local-control municipalities,70 so it can issue licenses to accommodate a fluctuating population. Quota municipalities experiencing fluctuating populations due to tourism must address demand with exception licenses71 when allocated licenses are insufficient. Salem, for example, a quota municipality in Essex County, with a resident population of 44,744, but which draws over 1 million visitors annually in October,72 is allocated 47 All-Alcohol and 9 Wine-and-Malt licenses under the quota formula. As the formula counts only year-round residents, not the visitors who fill restaurants and hotels during peak tourist season, a municipality’s license allocation bears no relationship to the demand it actually serves at peak times. Salem has had to resort to pursuing 20 exception licenses to meet demand, including 13 obtained via special legislation.

Respondents also cited other factors such as the regional commercial draw of districts serving a larger trade area; transit-oriented downtowns that generate after-hours foot traffic; and redevelopment that creates demand ahead of measured population growth.73 Other respondents described businesses moving to neighboring municipalities or states when supply is capped, or being priced out of high-demand commercial districts.74 In the DLM survey, these accounts came disproportionately from respondents in municipalities that were already at or above their § 17 quota. A municipal official in Watertown (issued 26% more licenses than the quota formula allocates, including special legislation and other exception licenses) called the system “inherently unfair, especially for an urban community” that “has chosen the path of economic development,” adding that “restaurants are a key element of creating vibrant commercial districts, and you cannot open a restaurant without a liquor license.”75 A Foxborough official (issued 92% more licenses than the quota formula allocates, including special legislation and other exception licenses) reported that “cost is not the issue,” it is “the limit” that constrains development; and a business owner in Fitchburg described “a city on the rise” with “lots of opportunities for new eating establishments” held back by limited license availability.76

To measure whether the quota allocation matches demand, this study examined how much of each quota municipality’s license allocation is actually in use. License utilization is the share of a municipality’s allocated on-premises licenses that have been issued to license holders.77 A municipality that has been allocated 20 licenses, and that has issued 10, is at 50% utilization; one that has issued all 20 is at 100%. Licenses granted by special legislation or other exceptions sit outside the allocation and are not counted here; the license utilization measure reflects the formula alone.

Because a single statewide average would minimize the differences between municipalities, this study sorted the 302 quota municipalities into the four following bands, based on their utilization rates:78

  1. Underutilizing (below 50%)—fewer than half of allocated licenses issued; substantial unused capacity
  2. Moderate (50–79%)—more than half issued, but room remains
  3. High (80–99%)—nearly all issued; few or no licenses left for prospective licensees or larger economic development projects
  4. At or over quota79 (100% or more)—every allocated license issued.

Municipalities in the high and at or over quota utilization bands (above 80% utilization) are classified in this report as constrained municipalities.

Figure 10 below maps license utilization across the Commonwealth.

Figure 10. On-Premises License Utilization in Quota Municipalities
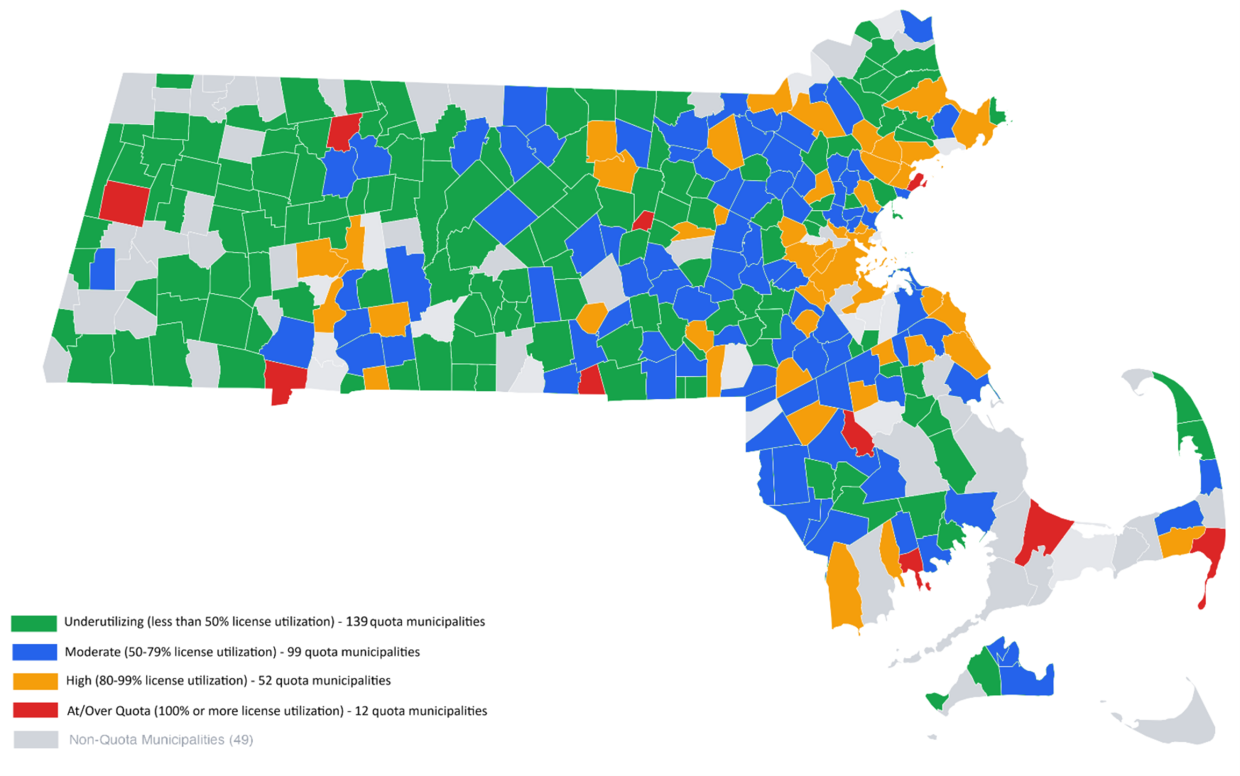
Choropleth map of all 351 municipalities shaded in five colors. Green represents 139 underutilizing quota municipalities with below 50% license utilization. More information in caption.
Blue represents 99 municipalities with a moderate utilization of 50-79%. Orange represents 52 municipalities with a high utilization of 80-99%. Red represents 12 municipalities at or over 100% license utilization. Grey represents 49 non-quota municipalities. Green or underutilization dominates the western half of the state almost without interruption. Blue and orange concentrate in eastern Massachusetts, with a dense orange band through Greater Boston and the inner suburbs and a second cluster along the South Coast. The twelve red municipalities are scattered rather than clustered, appearing in the Berkshires, central Massachusetts, the South Coast and the Outer Cape.

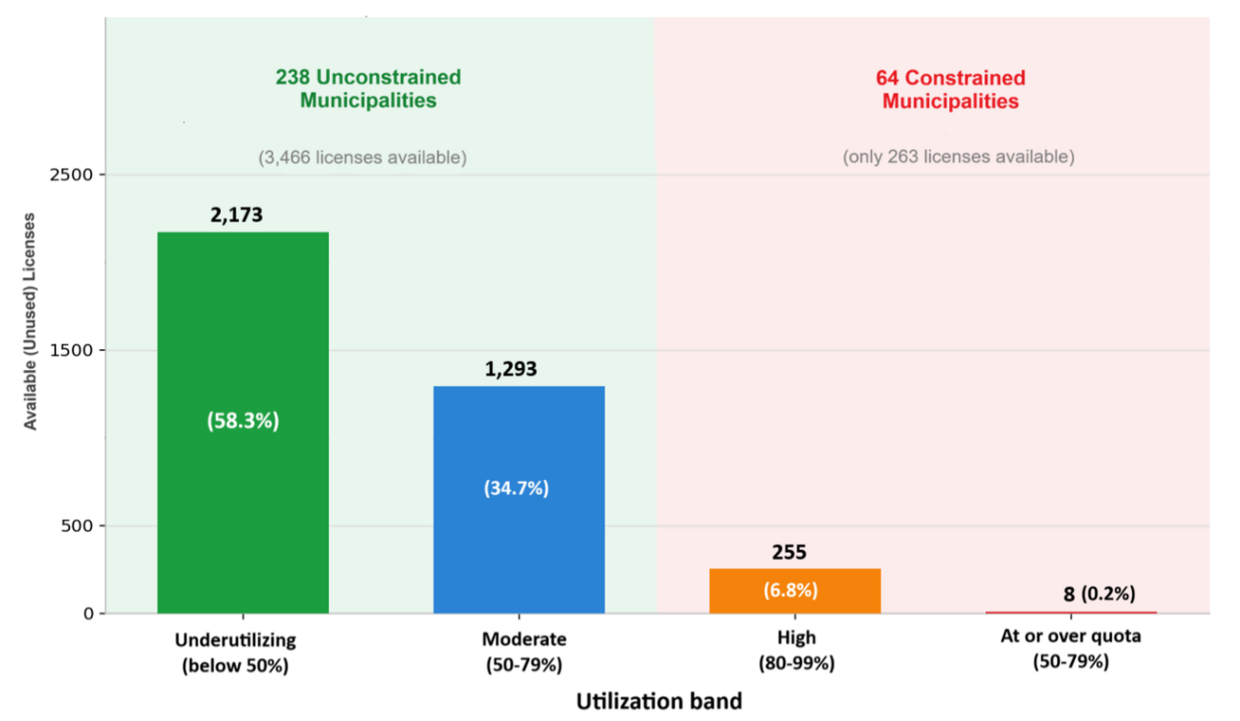
Figure 11 below shows how the 302 quota municipalities and the remaining available licenses held by those municipalities are distributed across the four license utilization bands. 

Figure 11. On-Premises License Utilization and License Availability
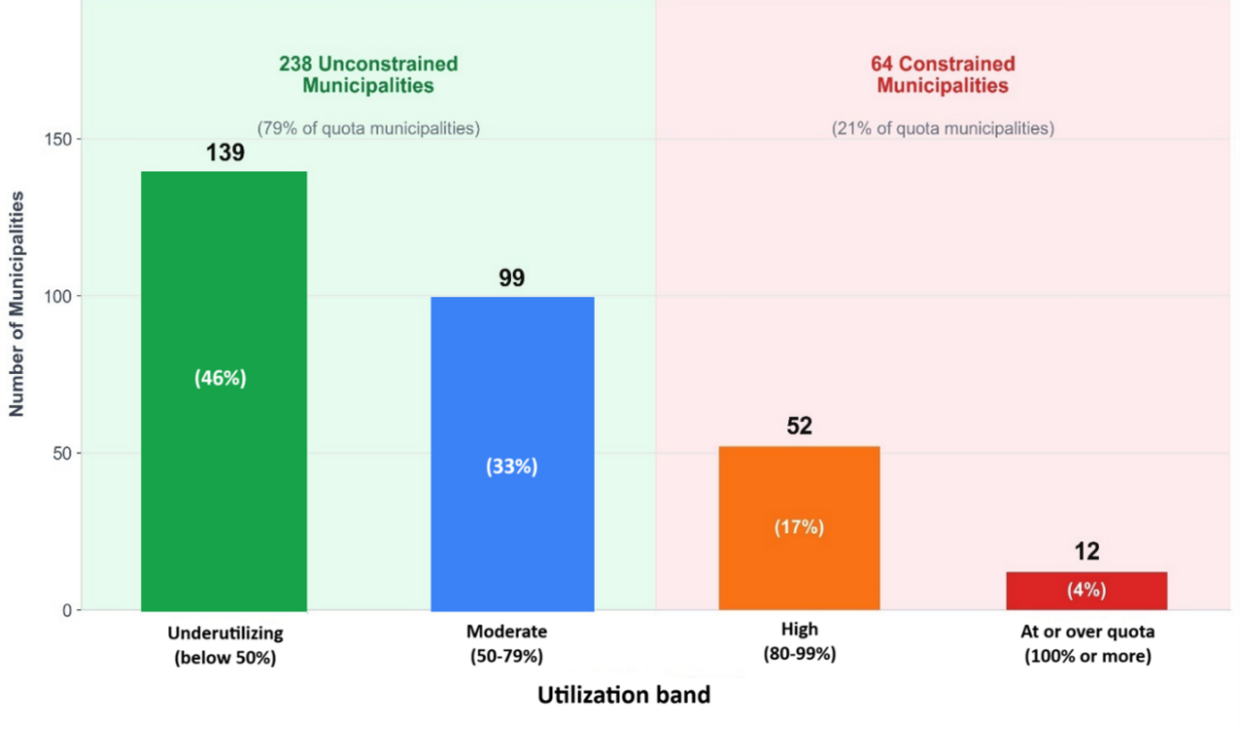
This Column chart shows how 302 Massachusetts quota municipalities are distributed across four license utilization bands on the horizontal X-axis, labeled "Utilization Bands." The vertical Y-axis is labeled "Number of Municipalities" with a scale from 0 to over 150 to measure the height of each column. More information in caption.
Reading left to right, the first green column shows 139 underutilizing municipalities, the second blue column shows 99 moderate utilization municipalities. First two columns together contain 238 municipalities with utilization less than 80% and are unconstrained in licenses. The third orange column shows 52 high-utilization municipalities, and the final red column shows 12 at or over quota municipalities. Last two columns contain 64 municipalities with utilization above 80% and are license constrained. The plot area is shaded behind the bars to separate 238 unconstrained municipalities from 64 constrained. Unconstrained area is shaded light green and constrained is shaded light pink.
This Column chart shows how available or unused quota allocated licenses are distributed across municipalities in four license utilization bands. The bands are plotted on the horizontal X-axis, labeled "Utilization Bands." The vertical Y-axis is labeled "Available (Unused) Licenses" with a scale from 0 to over 2500 to measure the height of each column. More information in caption.
Reading left to right, the green underutilizing column shows 2,173 available licenses, the blue moderate utilization column shows 1,293 available licenses. First two columns are unconstrained municipalities and have significant unused license capacity with a total of 3,466 available licenses. The third orange high utilization column shows 255 available licenses, and the final red at or over quota utilization column shows 8 available licenses. Last two columns are constrained municipalities and have only 263 licenses left. The plot area is shaded behind the columns to separate unconstrained municipalities with significant unused license capacity on the left from constrained municipalities with license scarcity on the right. Left is shaded light green and right is shaded light pink. This chart shows the extreme distribution of license availability in Massachusetts municipalities.

The contrast is sharp. At one end, 139 underutilizing municipalities (46.0%) are holding 2,173 unused licenses (58.3%), and the 99 moderate municipalities (32.8%) are holding 1,293 unused licenses (34.7%). At the other end, the 64 constrained municipalities (21.2%) hold only 263 unused licenses (7.0%) among them, with 12 holding none at all. Because the formula considers a single factor—population—license supply does not align with demand. This illustrates the supply and demand mismatch of the state-imposed population-based formula.

License constraint impacts 64 quota municipalities (21.2% of quota municipalities) but affects 41.6% of quota municipality residents (36.2% of the statewide population).80

In other words, approximately 2.5 million people across the Commonwealth live in municipalities with economic development impacted by license scarcity.

Figure 12. Quota Formula Affects Approximately 2.5 Million Residents in Constrained Municipalities
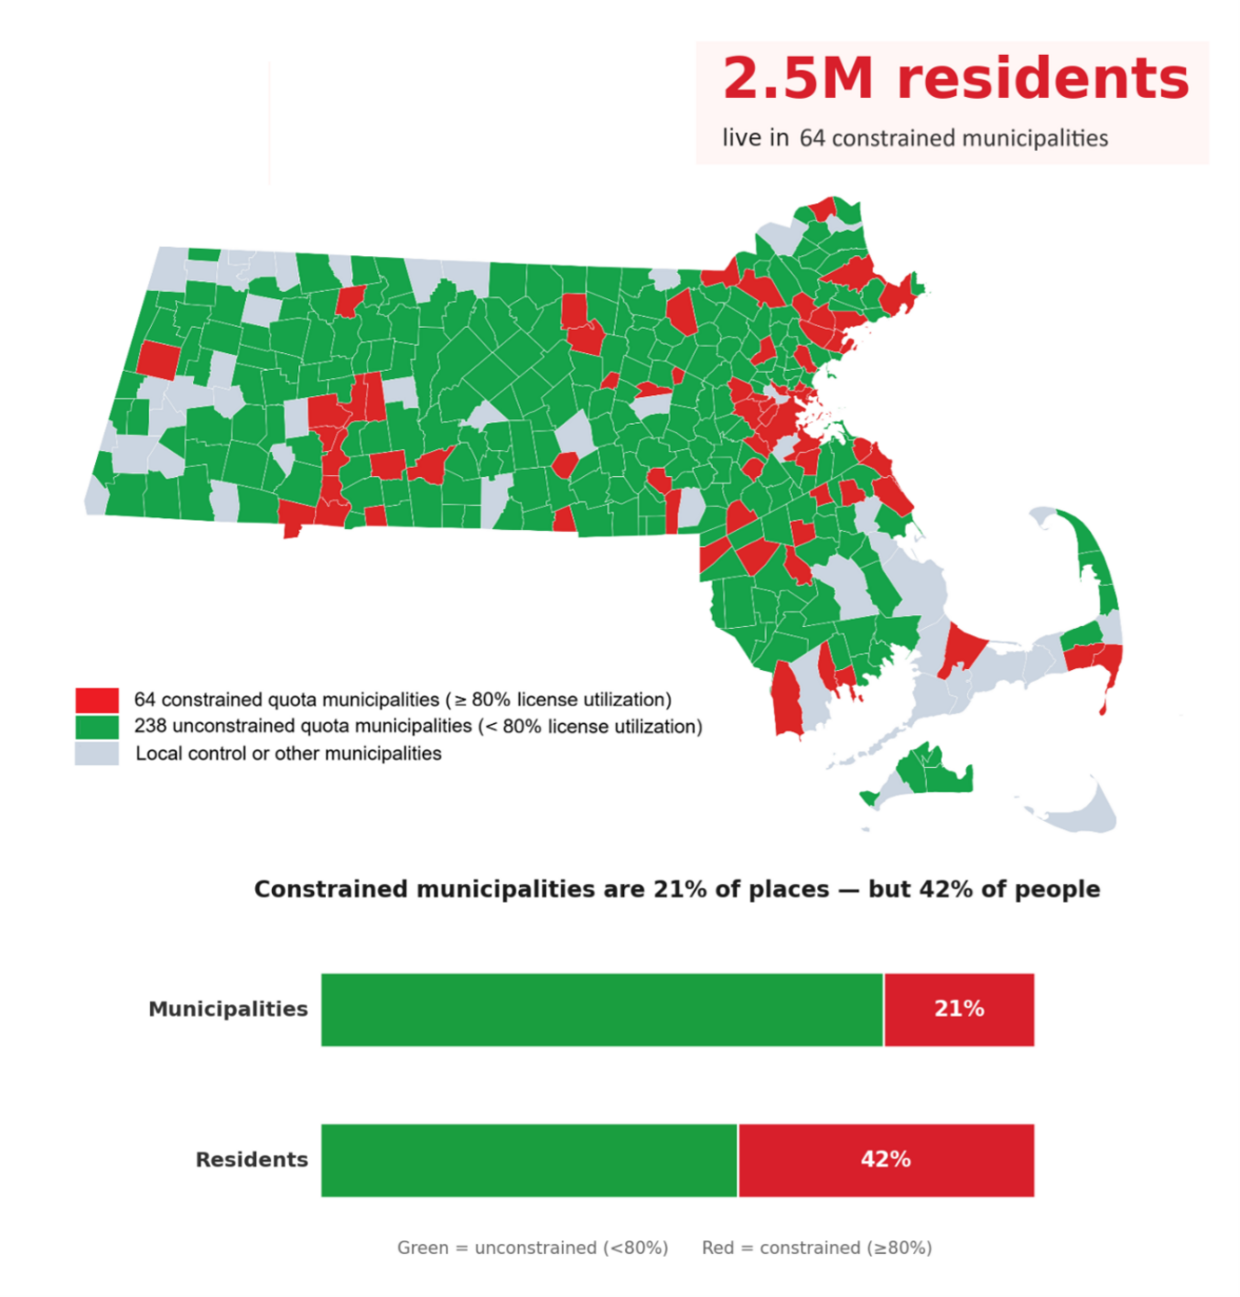
This visualization contains two linked elements. Above, a choropleth map of all 351 municipalities: red marks the 64 constrained quota municipalities at 80% or more utilization, green the 238 unconstrained quota municipalities below 80% utilization and pale grey the local control and other municipalities. More information in caption.
Red forms a near-continuous ring around Boston and reappears along the South Coast and Cape Cod while green fills almost all of the west. A callout reads "2.5 million residents live in 64 constrained municipalities." Below, two horizontal 100% bars under the heading "Constrained municipalities are 21% of places - but 42% of people": the Municipalities bar is 21% red, the Residents bar 42% red.

The net result of the supply and demand mismatch is that unconstrained municipalities have 9.4 times the number of remaining on-premises licenses available per 10,000 residents than constrained municipalities, creating accessibility and financial barriers to entering the market for small business owners. For instance, a Cambridge restaurant owner described being “invited to go to the Seaport and take a property, but there’s no way I could have afforded the license plus the buildup”— a direct consequence of what he called the “artificial scarcity created by a system that, frankly, is now archaic.”81

Figure 13 on the next page shows the contrast in license availability between the 10 constrained and unconstrained municipalities with the most remaining available licenses, sorted by population size.82 

This comparison illustrates that municipalities of similar population have vastly different license utilization rates.

Waltham (64,477 residents, 99% utilization) has one on-premises license available, while similarly sized Malden (65,133 residents, 52% utilization) has 41. Salem (44,744 residents, 98% utilization) has one on-premises license available, while Arlington (46,111 residents, 48% utilization) has 31. These pairs show directly why population alone is not a sufficient measure of demand: The formula treats Waltham and Malden, and Salem and Arlington, nearly identically, yet one municipality in each pair has exhausted its allocation while the other has a significant number of licenses available.

Figure 13. Constrained and Unconstrained Municipalities by Available Licenses83
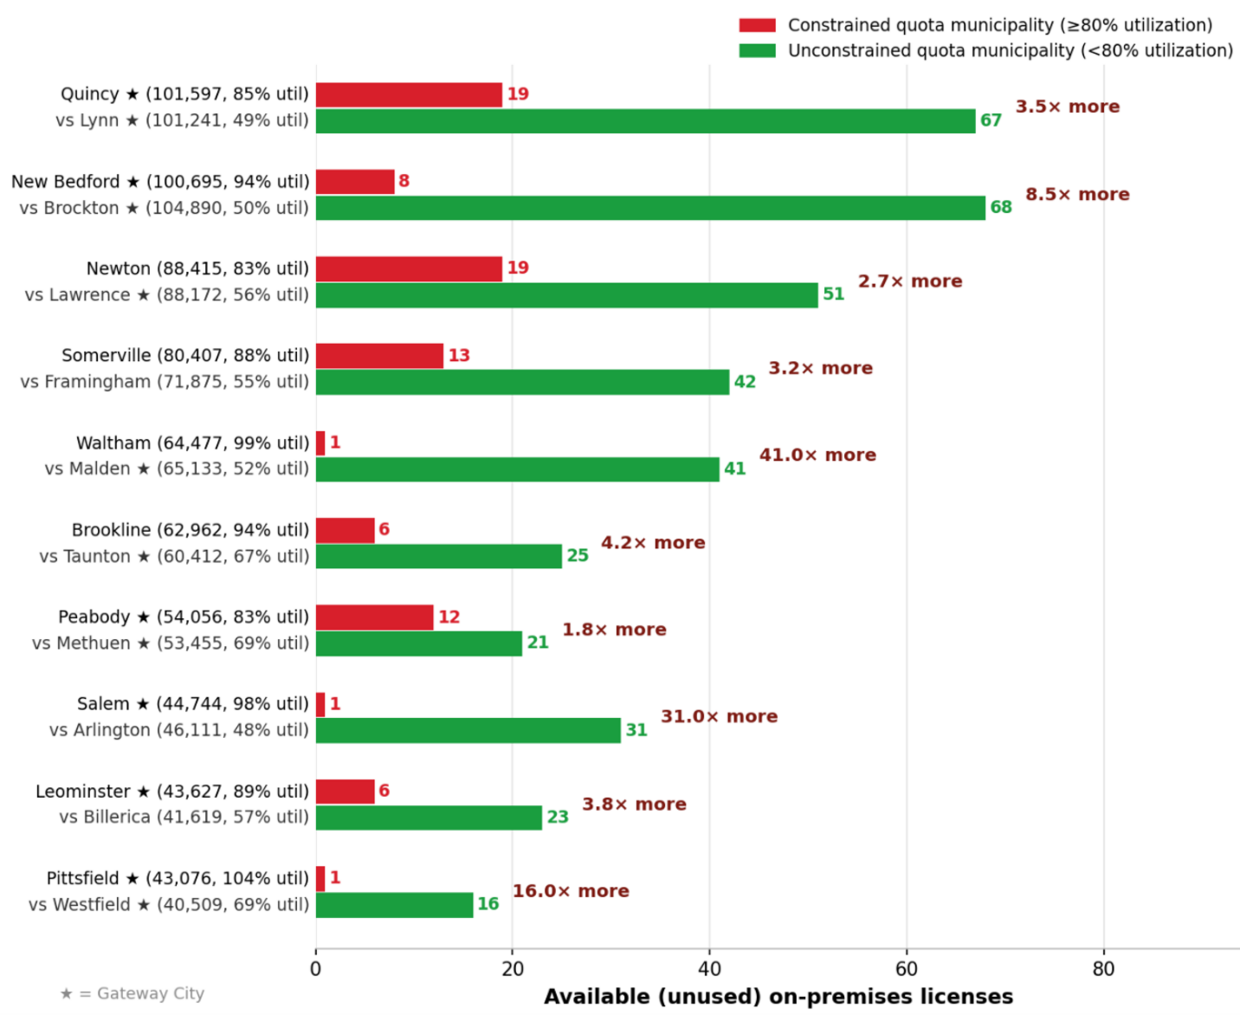
Ten pairs of horizontal bars, each pairing a constrained quota municipality with a similarly sized unconstrained one, sorted by population from largest at the top. Available (unused) on-premises licenses, and the gap in licenses is  printed beside each pair. More information in caption.
From top to bottom, the comparisons reveal massive discrepancies in license availability despite near-identical population brackets: 1. Quincy with 19 available licenses versus. Lynn with 67 available, 3.5x more licenses than Quincy. 2. New Bedford with 8 available licenses versus Brockton with 68 available, 8.5x more licenses than New Bedford. 3. Newton with 19 available licenses versus Lawrence with 51 available, 2.7x more licenses than Newton 4. Somerville with 13 available licenses versus Framingham with 42 available, 3.2x more licenses than Somerville 5. Waltham with 1 available license versus Malden with 41 available, 41.0x more licenses than Waltham 6. Brookline with 6 available licenses versus Taunton with 25 available, 4.2x more licenses than Brookline 7. Peabody with 12 available licenses versus Methuen with 21 available, 1.8x more licenses than Peabody 8. Salem with 1 available license versus Arlington with 31 available, 31.0x more licenses than Salem 9. Leominster with 6 available licenses versus Billerica with 23 available, 3.8x more licenses than Leominster 10. Pittsfield with 1 available license versus Westfield with 16 available, 16.0x more licenses than Pittsfield. From the above pairs, Waltham, Salem and Pittsfield - have exactly one license left, while their population-matched unconstrained counterparts have 41, 31 and 16 available licenses respectively.

Constrained municipalities share common characteristics. They tend to be larger population centers with higher densities.84 They have well-established commercial districts, strong hospitality sectors, tourism economies, or lively restaurant scenes that sustain robust demand for on-premises licenses.85 Examples include Boston (98.7% license utilization),86 Waltham (98.8%), Salem (98.2%), Holyoke (98.0%), New Bedford (93.9%), Brookline (93.8%), and, among towns, Chatham (100%) and Hadley (89%).87 

Somerville illustrates how far license demand can outrun the quota formula. In 2015, the city only had 5 available licenses.88 In its home rule petition filed that same year, Somerville sought 65 additional on-premises licenses to ease the constraints on restaurant and commercial development, demonstrating that the quota formula does not support demand driven by factors other than population.89 The Legislature ultimately authorized 50 new licenses.90

The demand-side pattern observed in Somerville repeats across other municipalities. For instance, Northampton, described by a municipal employee as “the former restaurant mecca of Western Massachusetts,” has operated above quota for decades.91 While the quota formula allocates 37 on-premises licenses to Northampton, the city has 64 issued licenses, including special legislation and other exception licenses. Demand drove repeated home rule petitions; most recently, after a lottery in which only one of four prospective licensees obtained a license, municipal leadership pressed for additional relief and secured a package of seven special legislation licenses in 2023.92

A license holder in Pittsfield described the demand-side reality plainly in the survey: “Many want to grow downtown businesses and are limited as to what businesses they can court based on quotas. Potential tenants will move on to a municipality where they can more easily open their business.”93 A Tyngsborough municipal official has seen prospective businesses go elsewhere when no license is available.94

The formula disproportionately disadvantages larger municipalities; the statutory minimums result in more licenses per capita allocated to smaller municipalities.

In the second part of this Finding, license utilization numbers are broken down by the following increments identified in the quota formula tied to population: municipalities with fewer than 14,000 residents, municipalities between 14,000 and 25,000 residents, and municipalities with over 25,000 residents.

The quota formula was written for the Massachusetts of 1933, when 294 municipalities (84%) had fewer than 14,000 residents and were allocated the statutory minimum of 14 All-Alcohol and 5 Wine-and-Malt licenses.95 The formula’s design reflected that reality. In the decades since, the Commonwealth has experienced substantial population growth, development, and urbanization: Two-thirds of residents now live in municipalities of 25,000 residents or more. By the most recent decennial census in 2020, the number of municipalities with fewer than 14,000 residents had fallen to 205 (58%), while the number with 25,000 or more residents had more than doubled to 80 (23%). See Figure 14 on the next page. The 80 municipalities with more than 25,000 residents in 2020 were home to approximately 4.69 million residents (66.7% of the population of the Commonwealth).

Figure 14. Change in Number of Municipalities Statewide by Population Category
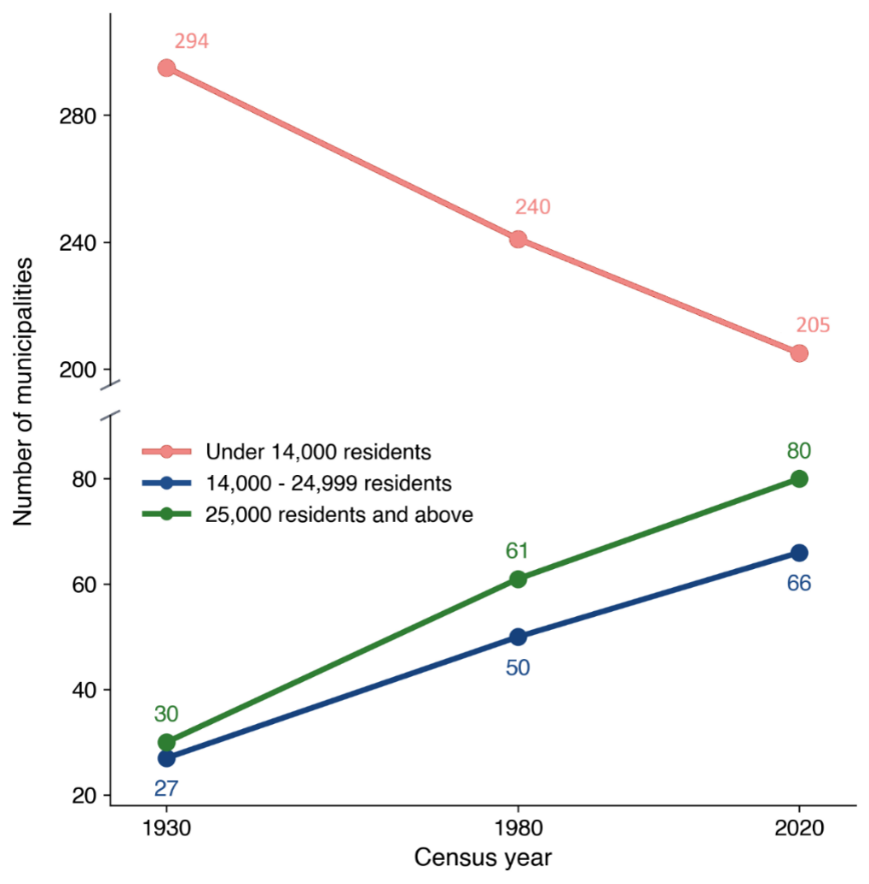
This line chart tracks how the counts of Massachusetts' 351 total municipalities distributed across three population tiers changed across the 1930, 1980, and 2020 censuses on the horizontal axis. The vertical axis displays the number of municipalities and contains a visual scale break between approximately 90 and 200 to compress empty space. More information in caption.
Municipalities with population below 14,000 residents show a steady downward trajectory, decreasing from 294 in 1930 to 240 in 1980, and finishing at 205 municipalities in 2020. Municipalities with population between14,000-24,999 residents’ trends steadily upward, climbing sequentially from 27 in 1930 to 50 in 1980, and ending at 66 municipalities in 2020. Municipalities with over 25,000 residents also trends upward, rising from 30 in 1930 to 61 in 1980, and reaching 80 municipalities by 2020. Together, the lines visually demonstrate a structural migration where population tiers above 14,000 residents increased over time while the smallest tier steadily shrank. The quota formula was established in 1933, when over 80% of Massachusetts municipalities fell below the 14,000-population threshold. By 2020 that number fell to 58%, yet quota formula remains unchanged.

Despite these demographic shifts, the quota formula remains unchanged. The formula’s 19-license minimum allocation (14 All-Alcohol and 5 Wine-and-Malt licenses) disadvantages municipalities that have grown in population since 1933. This outdated formula results in quota municipalities with fewer than 14,000 residents being allocated 2.7x more licenses per 10,000 residents than larger quota municipalities.96 More specifically, quota municipalities with fewer than 14,000 residents are allocated 34.3 on-premises licenses per 10,000 residents, compared with 12.9 in municipalities of 14,000 or more—166% more licenses.97 Figure 15 below illustrates this uneven license distribution across these population categories. 

Figure 15. The Minimum Allocation Advantage98
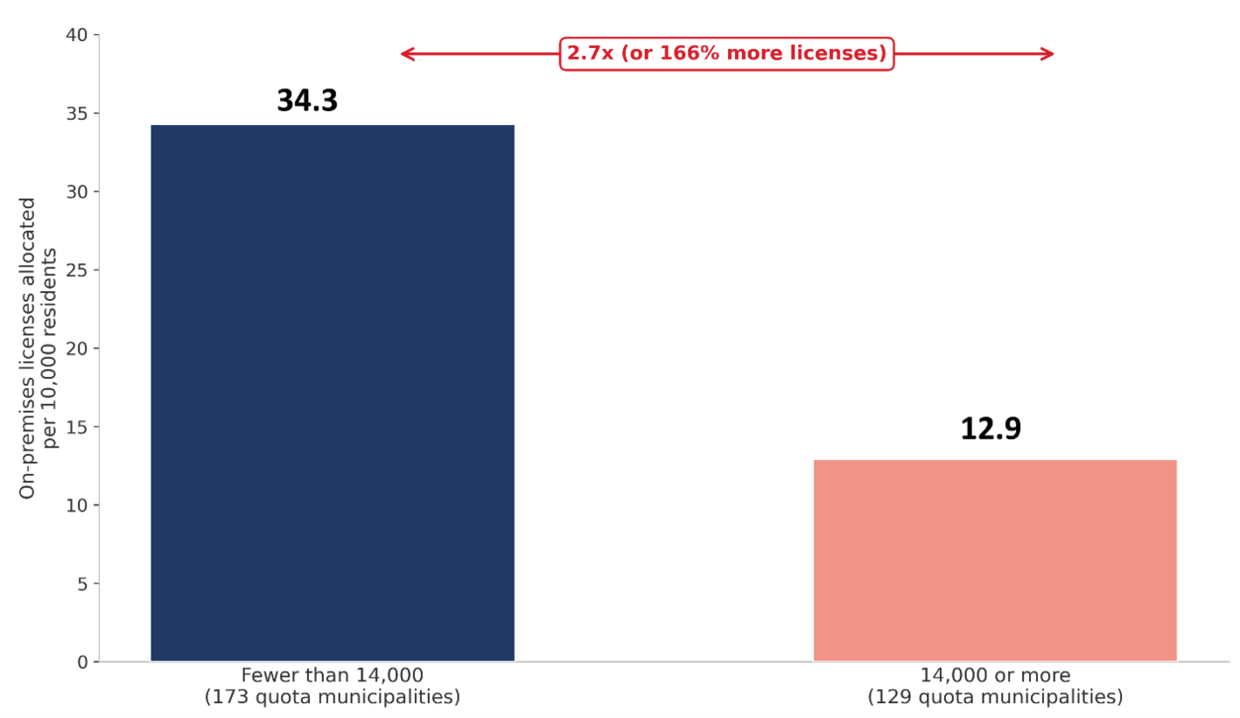
A Column chart comparing two population groups covering all Massachusetts quota municipalities, plotted on x-axis. The population groups are municipalities with below 14,000 residents and municipalities with above 14,000 residents.  More information in caption.
Y-axis is labelled on-premises licenses allocated per 10,000 residents. The chart shows 173 municipalities below 14,000 residents have a license allocation rate of 34.3 licenses per 10,000 residents while the 129 municipalities with at least 14,000 residents have a license allocation rate of 12.9. An annotation between the two population groups describes the difference in license allocation as approximately 2.7 times, or 166% more. These values concern allocated licenses rather than issued licenses.

The disconnect between the quota formula and current demographics is even more apparent when comparing license and population shares. Across quota municipalities, those with fewer than 14,000 residents account for 17.0% of the population but hold 33.0% of the licenses that the formula allocates, while municipalities of 25,000 or more account for 64.6% of the population but hold only 52.3%. The formula allocates a disproportionately larger share of licenses to smaller municipalities. See Figure 16 on the next page.

Figure 16. The Allocation Mismatch—Population Share vs License Share99instrument
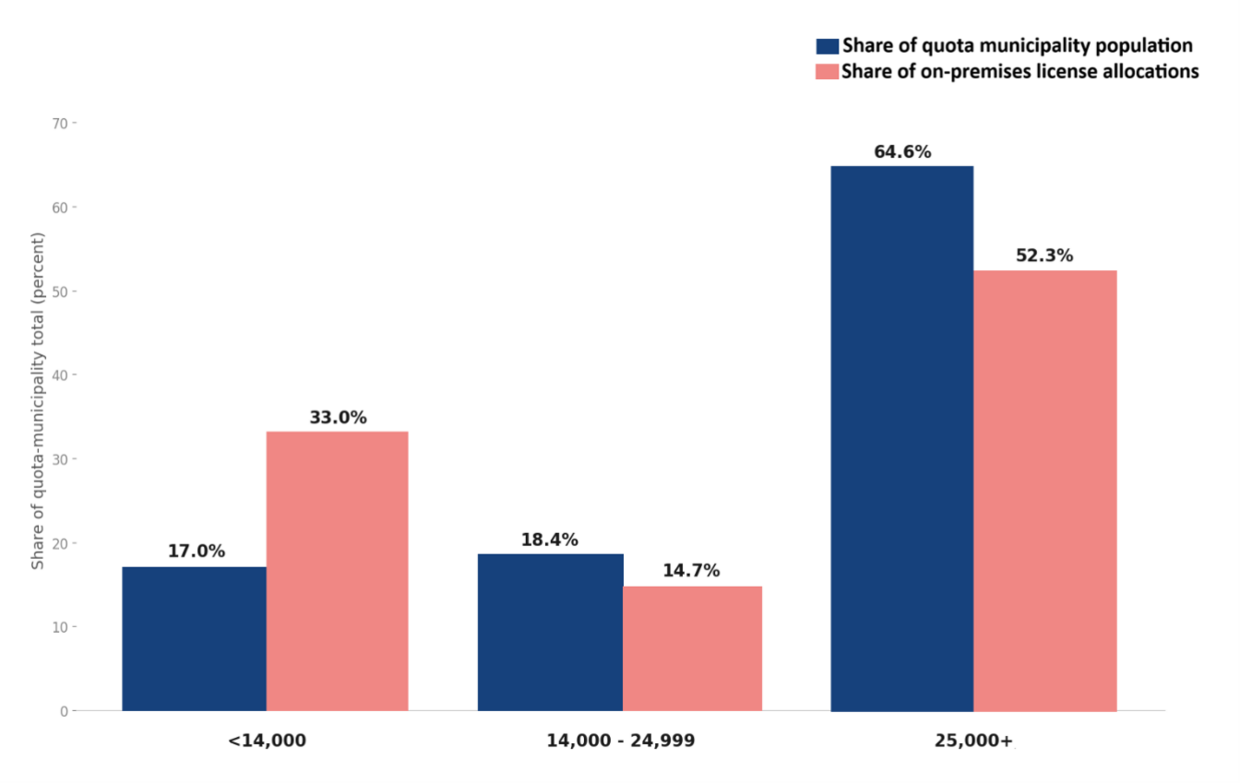
Grouped column chart with three pairs of vertical columns. Each pair contains two columns: share of population and share of licenses. More information in caption
On horizontal x-axis, we have three population categories: municipalities under 14,000 residents, 14,000 to 24,999 residents and above 25,000 residents. On vertical y-axis, we have a percentage scale from 0% to 70%. The first pair of vertical columns in under 14,000 population category contain 17.0% of quota population but 33.0% of allocated licenses. The second pair of vertical bars in 14,000 to 24,999 population category contain 18.4% of population and 14.7% of allocated licenses. The third pair of vertical bars in above 25,000 population category contain 64.6% of population and 52.3% of licenses. The allocations are nearly double the population share for municipalities under 14,000 population category, which is the only category allocated more than its population share, and it is over-allocated by 16 percentage points, capacity the other two population categories do not receive.

The evidence in this Finding points to a paradox in the population-based quota formula: scarcity in municipalities where prospective licensees want to open establishments and unused capacity in other municipalities. The quota formula was calibrated to the 1933 municipal landscape and yet has been applied, unchanged in its essentials, to present-day commercial reality, resulting in a supply and demand mismatch that impedes economic growth. Municipal officials describe the mismatch from inside the system. A Longmeadow town official wrote that basing the allocation on population “does not take into account communities that have universities (where students may not be considered residents) or a community that has a robust commercial or economic sector where the daily population increases.”100

60.    See MGL c. 138.

61.      DLM Survey, 2025–2026. See Appendix C for survey methodology and sample composition.

62.      Quota municipalities are subject to the state-imposed population-based quota under MGL c. 138, § 17. Boston has its own statutory license allocations pursuant to MGL c. 138, § 17, and is counted as a quota municipality.

63.      MGL c. 138, § 17.

64.      Id.

65.      Id.

66.      Id.

67.      Id.

68      DLM Survey, 2025–2026: 21 open-ended responses cited tourism or seasonal population, from municipalities including Brewster, Dennis, Edgartown, Gill, Gloucester, Nantucket, Rockport, Southwick, Truro, and Wellfleet.

69      DLM Interviews, 2026.

70      Local-control municipalities are authorized to grant on-premises licenses “in addition to, and irrespective of” the state-imposed population-based quota. St. 1978, c. 377, § 2. See Finding 2.

71.      An exception license is issued outside the population-based quota (e.g., special event licenses, farmer series licenses, additional licenses granted pursuant to special legislation enacted upon home rule petition).

72.      Destination Salem, “Halloween Day Visitors Up 7.2% as Salem Sustains Record October Tourism Levels,” reported on Boston.com, November 5, 2025, https://www.boston.com/news/local-news/2025/11/05/salem-halloween-visitors-2025/ (1.1 million unique visitors in October 2025; more than one million each October for six consecutive years); Destination Salem, Halloween Day Visitors Up 7.2% as Salem Sustains Record October Tourism Levels—Destination Salem, annual visitation of approximately 1.8 million, https://www.salem.org/. Visitor counts are the destination organization’s cell phone–based unique-visitor estimates.

73.      DLM Survey, 2025–2026; DLM Interviews, 2026—commercial-demand categories identified across interview and open-ended survey responses (regional commercial-corridor traffic, transit-oriented and downtown activity, redevelopment/anticipated growth).

74.      DLM Interviews, 2026.

75.      DLM Survey, 2025–2026.

76.      DLM Survey, 2025–2026.

77.    Allocated licenses are the number of on-premises licenses a municipality is statutorily eligible to issue under the quota formula, as applied to the municipality’s decennial census population—a municipality is not required to issue every allocated license. Issued licenses are on-premises licenses the municipality has actually granted to specific licensees. Exception licenses are excluded from both the numerator and denominator because they exist outside the quota system and would otherwise distort utilization rates. Utilization is measured against allocated licenses under the quota formula and not against allowed licenses, which include licenses granted by special legislation and other exception licenses. A small number of municipalities—Greenfield, Marblehead, Pittsfield, and Sandwich—appear at or over 100% of their current allocation because they have experienced population loss since their quota allocation was previously determined. These municipalities keep the licenses they were allocated when they were larger, though they may not issue new ones until the number outstanding falls back within the current formula.

78.    Utilization is measured against allocated licenses under the quota formula and not against allowed licenses, which include licenses granted by special legislation and other exception licenses. This analysis calculates a combined utilization rate by dividing total on-premises licenses issued (All-Alcohol + Wine-and-Malt) by total on-premises licenses allowed (All-Alcohol + Wine-and-Malt). This study combined All-Alcohol and Wine-and-Malt licenses because, from the perspective of a prospective licensee, what matters is whether any on-premises license is obtainable. If a municipality is at 100% of its All-Alcohol quota but has Wine-and-Malt licenses available, a restaurant seeking an All-Alcohol license faces the same barrier as if all licenses were exhausted. The combined rate captures the practical constraint more conservatively than tracking each quota independently. If anything, it slightly understates the constraint because a municipality can be fully blocked on its dominant quota track (All-Alcohol) while still showing availability on the smaller Wine-and-Malt track. This is a deliberate methodological choice.

79.    A municipality is classified as “at or over quota” when its combined issued on-premises licenses (All-Alcohol + Wine-and-Malt) meet or exceed total allowed licenses, indicating exhaustion of at least one quota track. There are 8 total unused licenses in 12 at or over quota municipalities, which means that these municipalities exhausted total allowed licenses in one quota track (either All-Alcohol or Wine-and-Malt), and they have available licenses in the other track. A small number of municipalities—Greenfield, Marblehead, Pittsfield, and Sandwich—appear over 100% of their current quota allocation because they have experienced population loss since their quota allocation was previously determined. These municipalities keep the licenses they were allocated when they were larger, though they may not issue new ones until the outstanding number falls back within the current formula. 

80.    Boston accounts for approximately 0.68 million residents. Excluding Boston, which has its own statutory license allocations, constrained municipalities hold approximately 1.86 million residents, 31% of the total quota-municipality population. Population figures are 2023 Department of Revenue/Division of Local Services municipal population estimates.

81.    DLM Interviews, 2026.

82.    Available licenses are allocated licenses minus issued licenses—the unfilled headroom under the § 17 cap that a municipality could grant without special legislation.

83.    ABCC fiscal year 2024 annual quota reports, compiled by DLM. Constrained quota municipality is defined as a quota municipality with combined on-premises license utilization at or above 80%. The top 20 are selected by absolute count of available licenses (allocated minus issued). Allocated licenses are the number of on-premises licenses a municipality is statutorily eligible to issue under MGL c. 138, § 17, calculated by applying the § 17 population-based formula to the municipality’s decennial-census population. Issued licenses are on-premises licenses the municipality has actually granted to a specific licensee.

84.    Analysis of 2023 US Census Bureau population estimates and density data for the 302 quota municipalities. Constrained municipalities (on-premises license utilization of 80% or higher) had a median population of 24,756 and median density of 1,441 residents per square mile, compared with 8,344 and 424 residents per square mile for unconstrained municipalities.

85.    DLM Survey, 2025–2026; DLM Interviews, 2026. Several of the constrained municipalities named are statutorily designated as Gateway Municipalities with concentrated commercial and hospitality activity, including Holyoke, New Bedford, and Salem (MGL c. 23A, § 3A). Boston’s constrained on-premises market has likewise been documented in press coverage of its license shortage (Jess McDonald and Maria Sacchetti, “Boston Restaurant Owners Fight for Affordable Liquor Licenses,” Boston Globe, January 15, 2024).

86.    St. 2024, c. 202, authorized the City of Boston to grant up to 213 additional on-premises licenses: up to 195 across 13 designated ZIP codes (up to 5 per ZIP code annually over three years), 3 in Oak Square, and 15 for community spaces and nonprofit organizations, and raised Boston’s base cap from 665 to 677. All of the new licenses are non-transferable and restricted to specific neighborhoods or uses. Because they do not count against the § 17 formula quota, Boston remains at 98.7% utilization of its formula allocation.

87.    Utilization rates are calculated as the ratio of issued on-premises quota licenses to the total allocated under the § 17 formula: issued ÷ allocated × 100, expressed as a percentage. Exception licenses are excluded because they represent licenses above the statutory quota; including them would obscure the constraint that necessitated the petition. The combined utilization rate aggregates All-Alcohol and Wine-and-Malt quotas for each municipality. Data source: ABCC fiscal year 2024 annual quota reports, ABCC fiscal year 2024 active-license extract and 2023 estimated population from the US Census Bureau.

88.    Lannan, Katie. Restaurant Boom in Somerville Behind Local Request for Dozens More Liquor Licenses. State House News, Boston, September 15, 2015. Analysis of MGL c. 138, § 17 applied to Somerville’s 2010 decennial census population of 75,754, the enumeration governing the city’s quota in 2015. The formula allocated 82 All-Alcohol and 16 Wine-and-Malt on-premises licenses, a total of 98. The count of licenses then available is as stated in the city’s home rule petition record described in the following footnote. For comparison, Somerville’s 2020 population of 81,045 yields a current allocation of 105 on-premises licenses, against 96 issued on the formula track and 52 held under special legislation.

89.     Somerville’s home rule petition, approved by the Board of Aldermen and Mayor Joseph Curtatone and sponsored in the Legislature by Representative Denise Provost, requested 65 additional on-premises liquor licenses. The Legislature ultimately authorized 50 additional licenses—35 all-Alcohol and 15 Wine-and-Malt licenses—in An Act Further Regulating the Sale of Alcoholic Beverages in the City of Somerville, St. 2016, c. 142. The licenses were phased in over multiple tranches; most were restricted to designated Transformative and Enhancement Areas, while a smaller number were issued as location-specific, non-transferable licenses. Quota utilization is based on calculation using data from the ABCC fiscal year 2024 annual quota reports. 

90.    An Act Further Regulating the Sale of Alcoholic Beverages in the City of Somerville, St. 2016, c. 142, §§ 3–11. Massachusetts Legislature (Chapter 142).

91.    DLM Interviews, 2026.

92.    DLM Interviews, 2026; St. 2023, c. 76. See also, e.g., St. 2016, c. 109, and St. 2014, c. 126.

93.    DLM Survey, 2025–2026.

94.    DLM Interviews, 2026.

95.      According to the closest census data from 1930, 294 municipalities (84%) had fewer than 14,000 residents, 27 municipalities (8%) had between 14,000 and 25,000 residents, and 30 municipalities (9%) had over 25,000 residents.

96.      As of the ABCC fiscal year 2024 annual quota reports, the 173 quota municipalities with fewer than 14,000 residents have a median quota allocation of 3.43 on-premises licenses per 1,000 residents (34.3 per 10,000), and 129 quota municipalities with 25,000 or more have a median of 1.29 per 1,000 (12.9 per 10,000). The 166% difference in license allocation between municipalities with fewer than and more than 14,000 residents is calculated as follows:  ADD IMAGE ≈166%; 

same comparison as a multiple: ADD IMAGE ≈ 2.7x.

97.      Figures are medians. This study reports the median rather than the average because a small number of very small municipalities receive the statutory minimum allocation spread across few residents, producing extreme per-resident ratios.

98.      Figures are medians. This study reports the median rather than the average because a small number of very small municipalities receive the statutory minimum allocation spread across few residents, producing extreme per-resident ratios. See Footnote 87 on the construction of these figures and Appendix B.

99.      Among quota municipalities, license share is the share of quota formula-allocated licenses. 

100.      DLM Survey, 2025–2026.

Date published: October 13, 2026

Help Us Improve Mass.gov  with your feedback

Please do not include personal or contact information.
Feedback