GHG Emissions Snapshot
This graphic presents a snapshot of Massachusetts’ gross GHG emissions in 2022, the most recent year for which we have a full inventory because of the natural lag in reporting data sources. It also contains information on 2022 biogenic emissions and carbon removed by natural and working lands. For more information about gross emissions, biogenic emissions, and carbon sequestration, refer to Chapter 3 of the Clean Energy and Climate Plan for 2050.
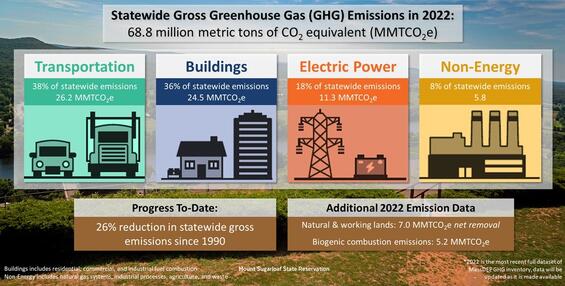
In 2022, transportation contributed 38 percent of statewide greenhouse gas emissions, buildings 36 percent, electric power 18 percent and non-energy 8 percent. Natural and working lands removed approximately 7.0 million metric tons of CO2 equivalent. Overall, Massachusetts has reduced its greenhouse gas emissions by 26 percent since 1990.
Tracking GHG Emissions
The dashboard below presents Massachusetts’ gross GHG emissions for the years 1990-2022. The total emissions for each year are broken down into nine sectors: residential fuel combustion, commercial fuel combustion, industrial fuel combustion, electric power, transportation, natural gas systems, industrial processes, agriculture, and waste.
The bar chart in the upper half of the dashboard shows the emissions trend for these nine sectors across the period 1990-2022. To show the trend for only a single sector, click on one of the categories listed in the legend in the lower-right. The pie chart in the lower half of the dashboard shows the percentage breakdown across the sectors when summing emissions from all years. To show the percentage breakdown for only a single year, click on one of the grey dots in the center of the dashboard. To select multiple sectors and/or years, start by clicking on one category and/or grey dot, and then hold “control” on the keyboard while selecting additional categories and/or dots.
This is a dashboard of annual emissions data from 1990-2022. For details on controlling the dashboard, see above text.
Tracking CECP Implementation
The dashboards below report on key metrics observed and tracked by the Executive Office of Energy and Environmental Affairs for various policy requirements, including implementation tracking of the Clean Energy and Climate Plan for 2025 and 2030. These dashboards use the most recently available data and will be updated regularly.
Scroll down to see information for each sector. Click on the links below to jump to the section for a particular sector.
Transportation
Transportation is the largest single source of GHG emissions in Massachusetts, responsible for 38 percent of statewide emissions in 2022. Pollution from transportation comes primarily from the combustion of gasoline, diesel, and aviation fuel in cars, buses, trucks, ships, and airplanes. Massachusetts’ strategy to reduce pollution from transportation is built around two broad goals. First, the Commonwealth will rapidly transition the vehicles on our roads to electric vehicles (EVs) through a combination of vehicle emission standards, vehicle and charging incentives, and consumer education and outreach. Second, we will reduce the amount that people need to drive in Massachusetts by providing them with more alternatives to personal vehicles to get around. We will do this by improving public transportation, building more housing near public transportation, and providing better bike and pedestrian infrastructure.
The boxes below highlight some recent transportation data for Massachusetts. Scroll down within this section for additional details.
The visualization below shows data on electric vehicles, total vehicles, and vehicle miles traveled in Massachusetts. Click on the tabs at the top of the visualization to switch between information on light-duty vehicles and medium-/heavy-duty vehicles.
Counts of light-duty electric vehicles are broken down into two categories: battery electric vehicles and plug-in hybrid electric vehicles. The number of these vehicles registered in Massachusetts increased during the period 2019-2025. The 2025/2030 CECP states a goal of 200,000 total EVs on the road by 2025 and 900,000 by 2030. By the end of 2025, we had 166,296 EVs on the road.
Vehicle miles traveled (VMT) reflects both the number of vehicles using Massachusetts’ roadways as well as the amount they are driving. These VMT estimates include all vehicles traveling in Massachusetts, regardless of whether the vehicles are registered in the Commonwealth or in another state. CECP modeling projects light-duty VMT to increase to about 57,900 million miles traveled in 2025 and about 59,100 million in 2030, even while per-household VMT is projected to decrease over the same period. In 2024, the most recent year that we have complete data from the US Department of Transportation, light duty vehicles accumulated 58,123 million miles traveled. CECP modeling projects medium-/heavy-duty VMT at about 3,400 million miles traveled in 2025 and about 3,500 million miles in 2030. In 2024, medium-/heavy-duty vehicles traveled 3,889 million miles.
Buildout of electric vehicle charging infrastructure is important in facilitating the expansion of EV ownership in the Commonwealth. As of December 2025, Massachusetts had 10,387 electric vehicle public charging ports. The 2025/2030 CECP estimates the need for 15,000 public charging station ports by 2025 and 75,000 by 2030.
Buildings
Buildings are the second largest source of GHG emissions in Massachusetts, responsible for 36 percent of statewide emissions in 2022. The Commonwealth’s dominant building decarbonization strategies are to maximize energy efficiency and electrify space and water heating systems. Incentive programs make efficient and non-emitting energy technologies, such as heat pumps, more accessible to all households and commercial buildings. Updated stretch energy and specialized energy building codes—which municipalities can choose to adopt—set high efficiency benchmarks that reduce energy use and lower demand on the electric grid.
The boxes below highlight some recent buildings-related data for Massachusetts. Scroll down within this section for additional details.
The visualization below shows data on residential audits, weatherization, and heat pump installations under the Mass Save program. (Note that, due to data limitations, the visualization does not include Municipal Lighting Plants (MLPs) and non-incentivized installations.) Click on the tabs at the top of the visualization to switch between the three types of data.
Installation of residential heat pumps has increased substantially from 2019 through 2025.1 The 2025/2030 CECP estimates heat pumps will be installed in at least 100,000 residential homes between 2020 and 2025 and in at least 500,000 homes between 2020 and 2030. The graph below shows that the Commonwealth achieved its 2025 target one year early at the end of 2024.
The visualization below shows the proportion of Massachusetts households heating their homes using various energy sources during the period 2010-2024 (excluding 2020 due to data availability from the U.S. Census Bureau). Based on 2024 data, natural gas is the most common heating source at about 52 percent of households, with delivered fuels (fuel oil, kerosene, etc.) as the second most common source at about 24 percent and electricity as the third most common source at about 20 percent. With the increasing use of heat pumps, electric heating has increased from just 14 percent in 2010 to nearly 21 percent in 2024.
New construction is a major priority for Massachusetts since the buildings built today will likely all be around in 2050. Ensuring that new buildings are built for this decarbonized future is another key strategy in meeting the Commonwealth’s GHG goals. As of December, 2025, 56 cities and towns had adopted the specialized building energy code and 245 cities and towns had adopted the stretch building energy code (see chart below). These represent, respectively, 60 percent and 32 percent of the state’s residents; collectively this is over 90 percent of the state’s residents. These codes apply to new construction and major renovations. For more information, see the Department of Energy Resources webpage about building energy codes.
In addition, rating residential homes with the Home Energy Rating System (HERS) and certifying larger multi-family buildings (more than 6 units) as Passive House are both progressive steps to drastically reduce the energy needs of new construction in our residential building sector. HERS ratings reflect the energy efficiency of a home (with lower ratings signaling greater energy efficiency), while Passive House is a building performance standard that aims to lower energy use and increase comfort and resilience.
As of late 2025, 29,384 housing units across 345 buildings were enrolled in the passive house program. The number of housing units and buildings enrolled in the Mass Save Passive House incentive has increased over the past several years (see chart below).
Electricity
Electric power is the third-largest source of GHG emissions in Massachusetts, responsible for 18 percent of statewide emissions in 2022. Decarbonization of electric power and ensuring grid reliability and flexibility are critical strategies to support the electrification of transportation, buildings, and other end uses, and ensure that electrification of those end uses provides the maximum amount of GHG emissions reduction possible.
The boxes below highlight some recent clean power and capacity data for Massachusetts. Scroll down within this section for additional details.
The percentage of Massachusetts’ electricity consumption that has been met by clean power follows a similar trend (see table below), approximately 51.6 percent in 2023.
| Year | 2017 | 2018 | 2019 | 2020 | 2021 | 2022 | 2023 |
|---|---|---|---|---|---|---|---|
| % of MA electricity consumption met with clean power | 46.4% | 55.9% | 50.2% | 43.4% | 48.2% | 50.0% | 51.6% |
The visualization below shows clean electricity generation that has been used to serve Massachusetts’ electricity load during the period 2017-2023. The year-to-year variation during this time is driven primarily by changes in the amount of nuclear energy consumed in Massachusetts, which has fluctuated both due to the retirement of units and because of changes to claims of clean energy certificates produced by nuclear generators. Solar photovoltaic generation continues to grow every year. Wind generation through 2023 represents onshore wind; this will grow as offshore wind began producing electricity in 2024. Click on the clean energy sources in the legend to view one clean energy type at a time.
The visualization below shows Massachusetts’ in-state installed renewable electric capacity for the years 2013-2024. Note that in-state electric capacity may be used to serve electricity demand both within Massachusetts and in other states across Independent System Operator (ISO) New England territory. Hover over the bars to see individual capacity values. Click on the bars or the legend to view one renewable energy type at a time.
The 2025/2030 CECP modeling projects 4,470 MW AC of solar capacity by 2025 and 8,360 MW AC of solar capacity by 2030. The 2025/2030 CECP modeling projects 180 MW of wind capacity (all onshore) in 2025 and 3,650 MW of wind capacity (onshore and offshore combined) in 2030. As of 2024[1], Massachusetts has 3,939 MW AC of solar capacity and 105 MW of onshore wind capacity. Offshore wind capacity began coming online in 2024 and will produce significantly more electricity when Vineyard Wind 1 becomes fully operational. Additionally, the New England Clean Energy Connect will bring hydropower from Quebec starting in early 2026. As noted above, given that the Massachusetts power sector operates within a regional market and receives much of the electricity it consumes from neighboring states and provinces, the renewable generation located in-state is only a partial indicator of the state’s progress towards meeting electricity-related GHG emissions goals.
Natural and Working Lands
The balance of carbon sequestration and greenhouse gas emissions occurring on Massachusetts’ natural and working lands (NWL) yields negative net emissions that help offset emissions from other sectors and will help the state to reach net zero emissions by 2050. For 2022, total net removal of greenhouse gases by the state’s NWL is estimated at 7.0 million metric tons of carbon dioxide equivalent, which amounted to about 10 percent of gross emissions in that same year. The Commonwealth’s primary strategies for conserving carbon and reducing emissions on NWL are to protect these lands from conversion to lower carbon land uses, as well as to manage and restore them to maintain carbon stocks and sequestration capacity.
The boxes below highlight some recent NWL-related data for Massachusetts. Scroll down within this section for additional details.
The visualization below shows the GHG emissions trend for NWL for the years 1990-2022, an NWL emissions snapshot for 2022, and biogenic combustion and oxidation emissions for 1990-2022. Click on the tabs at the top of the visualization to switch between these three sets of data.
The emissions trend figure highlights that forest land is the largest emissions sink in Massachusetts, with a magnitude of annual emissions removal that was gradually increasing until 2016 but has been gradually decreasing since. The emissions snapshot shows that in 2022, land converted to settlements was the largest single source of NWL emissions in the Commonwealth. Note that emissions from most agricultural processes (e.g., fertilizer use, livestock) are captured in the non-energy sector—see section below. Definitions of the NWL emissions categories are provided in the Data Sources section at the bottom of the page.
The third tab shows that biogenic combustion emissions—which are carbon dioxide emissions from the burning of biofuel and biomass—have fluctuated over the past three decades, with biogenic combustion for electric generation generally representing the largest single source and combustion of biogenic transportation fuels (e.g., ethanol) representing the next largest single source. This graph also depicts oxidation emissions from landfills, which result from microbially-mediated conversion of landfill-generated methane into carbon dioxide.
The visualization below presents NWL data related to land area and to protected areas. Click on the tabs at the top of the visualization to switch between the two sets of data.
Specifically, the first tab shows NWL area in Massachusetts and, as a key subset of that, forest land area. on an annual basis from 2020 to 2024. Hover over the chart for additional details.
The second tab shows how much area is permanently protected in Massachusetts. This chart includes annual values for the years 2019-2025. Hover over the chart for additional details. The 2025/2030 CECP sets a goal to permanently protect at least 28 percent of undeveloped land and water by 2025 and at least 30 percent by 2030. Massachusetts met its 2025 target.
Industrial and Non-Energy
The industrial and non-energy sectors are the smallest sources of emissions in Massachusetts, responsible for 8 percent of statewide emissions in 2022. Industrial emissions include both those from fuel combustion and those from processes like the production of lime. Other non-energy emissions include natural gas pipeline system leaks, waste (methane from landfills and emissions from wastewater), and agricultural practices (including methane from livestock). The main opportunity for Massachusetts to substantially reduce non-energy emissions involves new and strengthened regulations of fluorinated gases (F-gases), which are substitutes for ozone-depleting gases used in industrial applications but are powerful GHGs.
The visualization below shows trends of these emissions over time. Click on the tabs at the top to switch between data for the industrial sector and data for other non-energy sectors.
The first tab focuses on the industrial sector: the graph on the left displays industrial fuel combustion emissions and industrial processes emissions, and the graph on the right shows the breakdown of industrial fuel combustion CO2 emissions into specific fuels (petroleum, natural gas, and coal). For industrial combustion, there is an emissions target of 50 percent below the 1990 level in 2025 and 57 percent below the 1990 level in 2030 (note that there is an emission sublimit for commercial and industrial combined but not one for industrial alone). For industrial processes, there is a target for emissions growth of 449 percent of the 1990 level in 2025 and 281 percent of the 1990 level in 2030. Industrial processes have a negative reduction (i.e., a percentage increase in emissions) due in large part to the use of hydrofluorocarbons (HFCs, the most common type of F-gas), which were used to replace chlorofluorocarbons (CFCs) beginning in the early 1990s when the ozone hole was discovered. HFCs are much less damaging to the atmospheric ozone layer than are CFCs, but they turn out to be potent greenhouse gases. Emissions from HFCs used in refrigeration, air conditioners, and heat pumps are expected to grow over the next decade. Hover over the charts for additional information.
The second tab shows emissions for other non-energy sectors: waste, natural gas systems, and agriculture. There is a sectoral sublimit of 82 percent below the 1990 level in both 2025 and 2030 for natural gas distribution and service. Hover over the chart for additional information.
Data Sources
Data sources for the information provided in each of the sector sections above are described here.
Transportation
Vehicle counts: all data come from the MassDOT Massachusetts Vehicle Census dashboard. The vehicle count for a year is the total as of January 1 of the following year (e.g., the “2019” count is the total as of January 1, 2020). The electric vehicle counts include vehicles with “Advanced Vehicle Type” of “Electric Vehicle” and “Plug-in Hybrid Electric Vehicle.” The light-duty category includes vehicles with “Weight Class” of “Light Duty”. The medium-/heavy-duty category includes vehicles with “Weight Class” of “Medium/Heavy Duty”.
Vehicle miles traveled: data is sourced from the U.S. Department of Transportation Federal Highway Administration (FHWA) Policy and Government Affairs Office of Highway Policy Information. Total miles traveled can be found on the FHWA Highway Statistics Series: State Statistical Abstracts: Highway Statistics Series - Policy | Federal Highway Administration (dot.gov). To break the annual VMT values out by light duty and medium/heavy duty, the annual Highway Statistics Series Publications were used: Highway Statistics Series - Policy | Federal Highway Administration (dot.gov). Specifically, two tables were used: Section 5.4.1, Table VM-2, “Vehicle-miles of travel by functional system” and Section 5.4.3, Table VM-4, “Distribution of Annual Vehicle Distance Traveled.” By grouping motorcycles, passenger cars, and light trucks into the “light duty” category and single-unit trucks, combination trucks, and buses into the “medium/heavy duty” category, these two tables can be analyzed to estimate the VMT for each vehicle type per year.
Electric vehicle public charging ports: count is sourced from the U.S. Department of Energy Alternative Fuels Data Center. See “Electric (EVSE) ports webpage”.
Buildings
Residential audits: data for 2010-2012 come from the MA Energy Efficiency Advisory Council annual reports; data for 2013-2018 come from Mass Save; data for 2019-2025 come from Mass Save reporting to the Energy Efficiency Advisory Council (EEAC). Preliminary 2025 data is from Mass Save. Mass Save data from 2013-2025 are available on the EEAC website.
Residential weatherization projects: data for 2013-2022 come from Term Report data as filed with the Department of Public Utilities; data for 2023-2025 come from the MA Energy Efficiency Advisory Council (EEAC) annual report. Preliminary 2025 data is from Mass Save. Mass Save data from 2013-2025 are available on the EEAC website.
Residential heat pump installations: annual data for 2019-2023 come from the Mass Save Term Report; data for 2023-2025 come from the MA Energy Efficiency Advisory Council (EEAC) annual report. Preliminary 2025 data is from Mass Save. Mass Save data from 2013-2025 are available on the EEAC website.
Home heating: data are from the U.S. Census Bureau American Community Survey, table S2504 “Physical Housing Characteristics for Occupied Housing Units.” For simplicity, the category “Bottled, tank, or LP gas” has been renamed to “Propane.”
Building code adoption: counts of cities/towns taken from the PDF titled “Massachusetts Building Energy Code Adoption by Municipality,” published on the Department of Energy Resources webpage. Data were last updated on December 4, 2025. Population data is taken from the MA Department of Revenue Division of Local Services Data Analytics and Resources Bureau Municipality Population Table. Data were last updated January 21, 2026.
Passive House: data come from a range of sources, including the MA Energy Efficiency Advisory Council quarterly reports. Mass Save data from 2013-present are available on the EEAC website.
Electricity
Clean generation and percent of MA consumption met with clean power: calculated from a range of public data sources including MassDEP’s Greenhouse Gas Baseline & Inventory.
In-state renewable capacity: for energy types “Anaerobic Digester,” “Biomass,” “Hydrokinetic,” and “Landfill Gas,” the capacities are totaled from the list of RPS Class I qualified generating units. For energy type “Wind,” the capacities are based on the values available on the Department of Energy Resources webpage. For energy type “Hydroelectric,” the capacities were manually compiled from several sources: RPS qualified unit lists, FERC license info, LIHI certificate pages, and Hydropower Reform Coalition database. For energy type “Photovoltaic,” the capacities come from the on-site generating facility reports filed by utilities, as well as the RPS Solar Carve-out and RPS Solar Carve-out II qualified generating units lists.
Electric storage capacity: this capacity estimate is taken from the Energy Storage Initiative webpage on the Department of Energy Resources website. This estimate was last updated on February 15, 2025.
Natural and Working Lands
NWL emissions and non-NWL biogenic/oxidation emissions: estimates for 1990-2022 are taken from MassDEP’s Greenhouse Gas Baseline & Inventory Appendix C.
NWL area and forest land area: derived from U.S. Geological Survey Annual NLCD Land Cover Classification. NWL land area is defined here to include all land cover classes with the exception of barren land, developed land, and developed open space (e.g. golf courses, parks, roadway buffers, low-density residential neighborhoods). Forest land includes all forest land cover classes as well as woody wetlands.
Protected NWL land area: Calculated from MassGIS Protected and Recreational OpenSpace datalayer, maintained by EEA and covering land protected through June 30, 2025. Protected NWL land area is calculated as the sum of all land area Protected though a given fiscal year, generally excluding open water bodies (but including other wetlands, based on MassGIS Data: MassDEP Wetlands (2005). Protected land percentage is calculated from Protected NWL land area divided by Massachusetts’ surveyed land area (excluding open water bodies, including other wetlands). Note that while the Protected and Recreational OpenSpace datalayer has relatively comprehensive and timely coverage of recent land protection with state involvement, coverage of land protection by land trusts and municipalities is less consistent, timely, and complete. Reported values should therefore be considered approximate and likely underestimate actual protected land area in the state.
NWL Emissions Categories
NWL emissions categories are each associated with land use classes that include both land remaining in the same land use, and land recently converted to a given land use (i.e., within the last 20 years). Land use classes are as follows:
- Forest Land: Land use class representing areas with at least 10 percent live tree cover of at least one acre in size, including land that recently had such tree cover and is capable of regenerating it in the near future.
- Cropland & Grassland: Land-use classes that includes areas used for the production of crops (Cropland), including cultivated crops, perennial crops, and hay production; or dominated by grass-like plants or shrubs suitable for grazing and browsing (Grassland), including pasture and native rangelands.
- Wetlands: Land use class that includes land covered or saturated by water for all or part of the year, in addition to lakes, reservoirs, rivers, and coastal wetland areas; excludes some wetlands that fall under other land use classes (e.g., cultivated or tree-covered wetlands are Cropland and Forest Land respectively).
- Settlements: Land use class representing developed areas, including residential, industrial, commercial, and institutional land; urban parks and developed open space; construction sites; transportation and other infrastructure; and small patches of other land uses (e.g., forest land) surrounded by developed land.
Based on definitions in: EPA. 2023. Chapter 6. Land Use, Land-Use Change, and Forestry. In Inventory of U.S. Greenhouse Gas Emissions and Sinks: 1990-2021, Reports and Assessments, U.S. Environmental Protection Agency. Pgs. 6-15 to 6-16.
Industrial and Non-Energy
Industrial and non-energy greenhouse gas emissions: estimates for 1990-present are taken from MassDEP’s Greenhouse Gas Baseline & Inventory.
All content, information, and data included in the graphic and dashboards are provided for informational purposes only. Information presented is based on best-available data from the data sources above. The dashboards provide a snapshot of the Commonwealth’s progress toward its climate goals but may not contain all information necessary to determine compliance with the Commonwealth’s greenhouse gas emissions limits and sector-specific sublimits.