Downloads
Tile downloads:
Download from a spreadsheet of links
Download an index shapefile with links
View interactive map download instructions
Mosaic downloads:
Download mosaics from a spreadsheet of links
Download a mosaics index shapefile with links
Overview

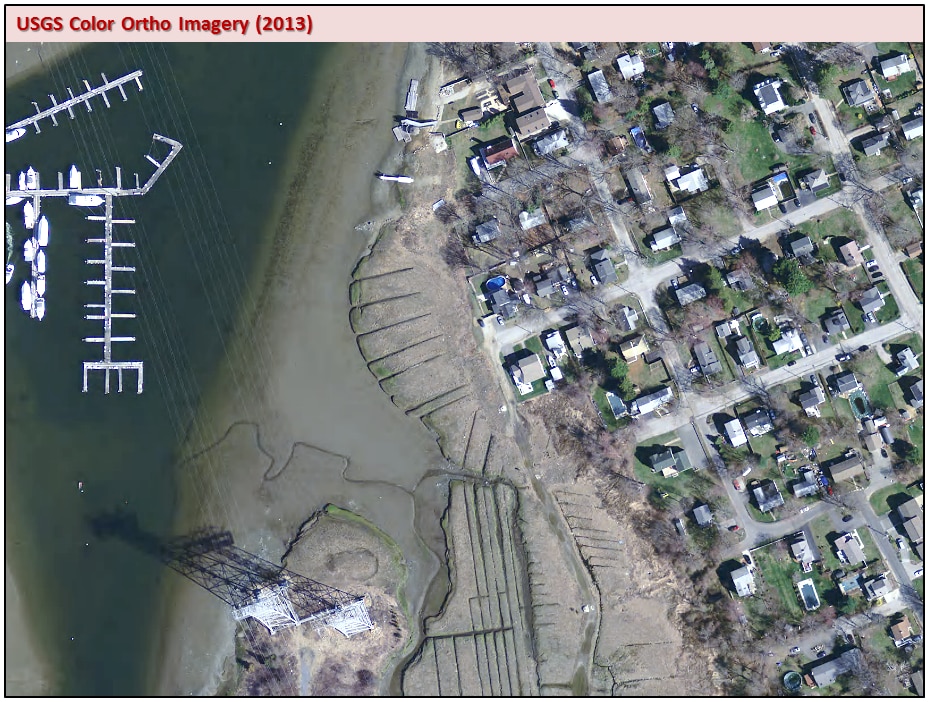
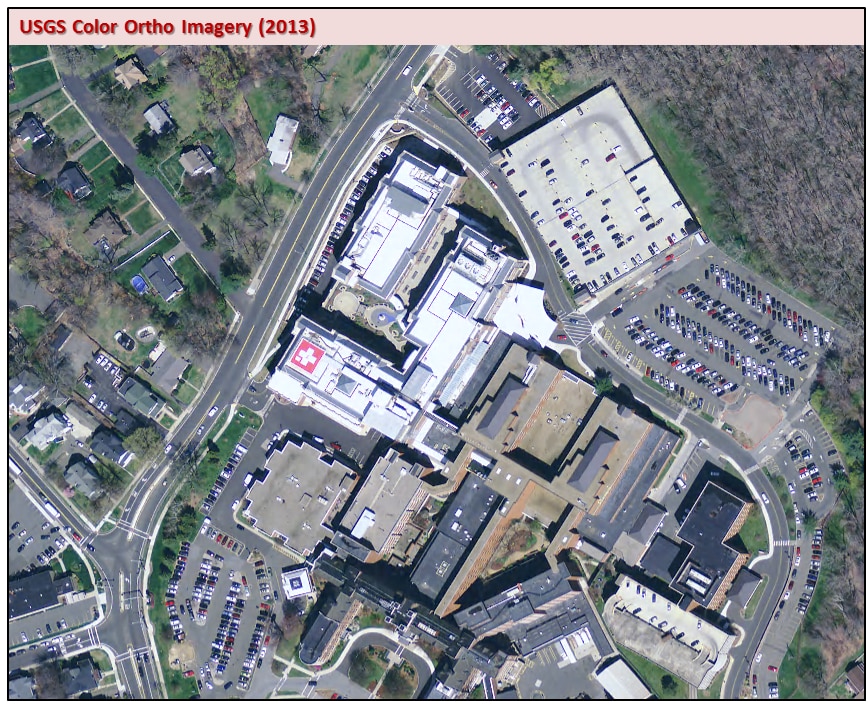
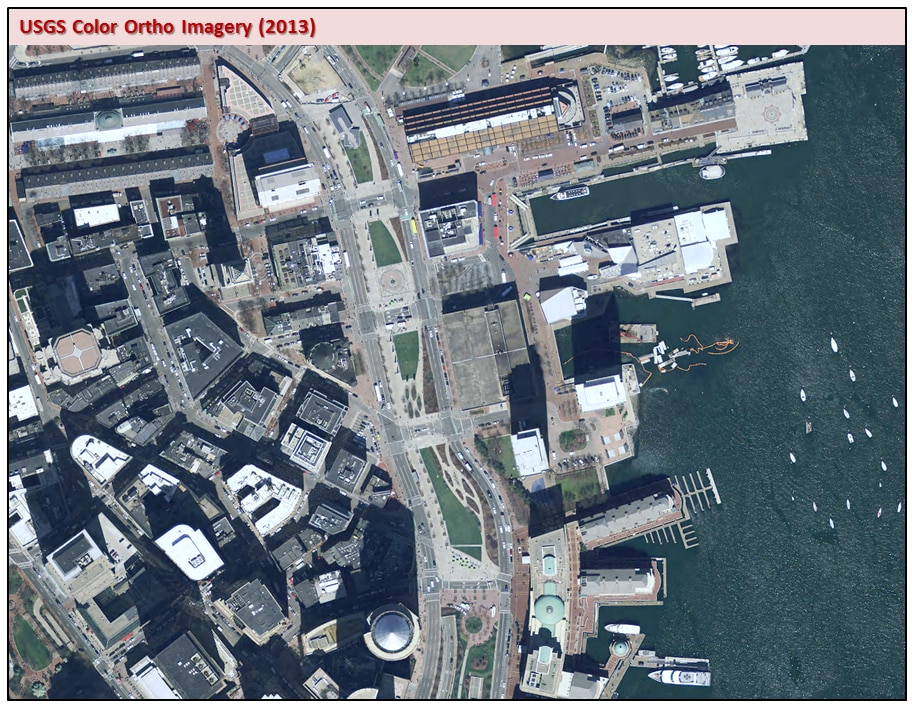
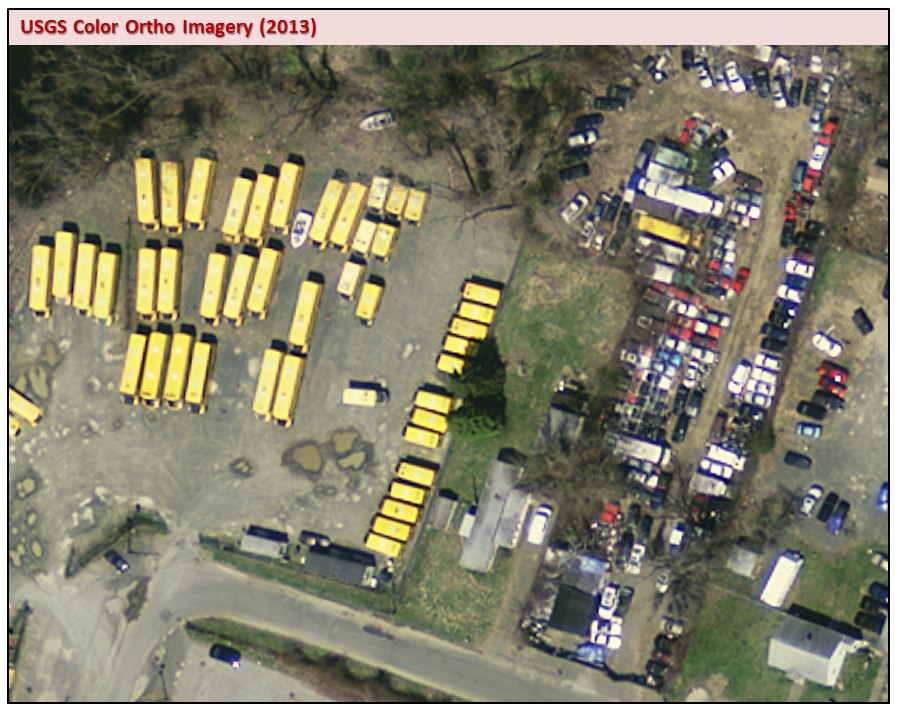
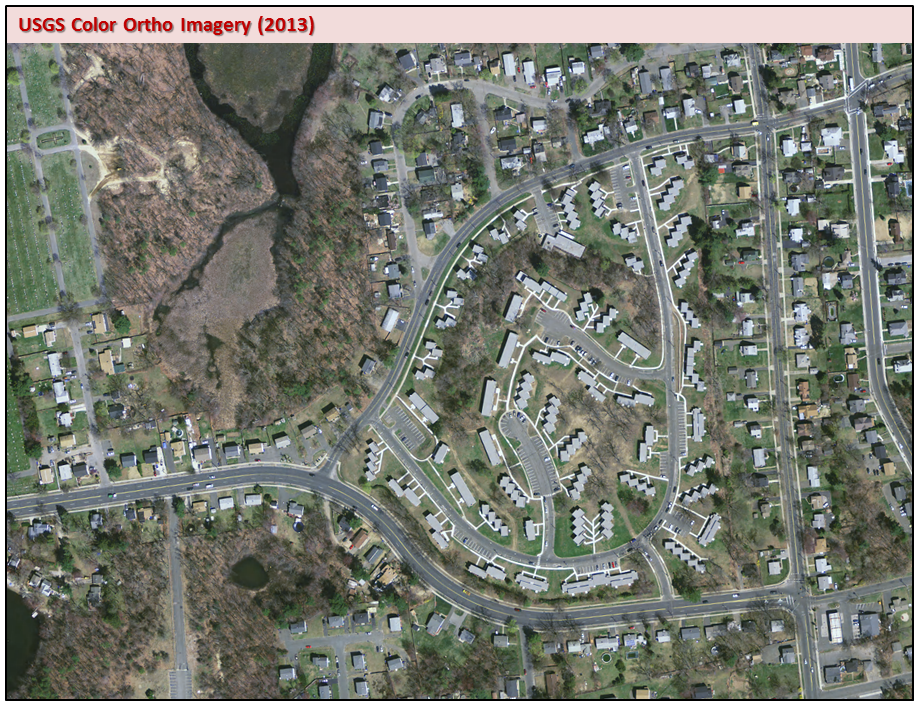
In spring 2013 and 2014, the U.S. Geological Survey contracted for true-color imagery covering three urban areas in Massachusetts as defined by the USGS. In 2013 those areas were the greater metropolitan Boston, Worcester and Springfield areas. The rest of the state was captured in 2014. Image type for all of the areas is 24 bit, 4-band (red, green, blue, and near-infrared RGBN) portions of the spectrum. Each band has pixel values ranging 0-255. Pixel resolution is 0.3 meters (30 centimeters), or approximately one foot.
View Index Map (7MB PDF) of available imagery (based on the 2013/2014 Aerial Imagery Index layer).
This digital orthoimagery can serve a variety of purposes, from general planning, to field reference for spatial analysis, to a tool for data development and revision of vector maps. It can also serve as a reference layer or basemap for myriad applications inside geographic information system (GIS) software.
These image data were created to provide easily accessible geospatial data which are readily available to enhance the capability of Federal, State, and local emergency responders, as well as plan for homeland security efforts. These data also support The National Map.
Production

Aerial Acquisition
The raw ADS80 image data were collected by Fugro EarthData, Inc. at about 2,896 meters above mean terrain during mid to late April in 2013 and 2014. The source imagery is cloud free, and was acquired in generally leaf-off conditions.
Ground Control
TerraSurv, Inc. was contracted by Fugro to provide ground control survey to support photogrammetric mapping and blind QC points. The National Spatial Reference System (NSRS) was used to provide control for the network. The KeyNetGPS Virtual Reference System (VRS) service was used to georeference each station. This VRS network is consistent with the National CORS at the centimeter level. The horizontal datum was the North American Datum of 1983 (2011), and the vertical datum was the North American Vertical Datum of 1988. The GEOID12A model was used.
Spatial Data Quality - Horizontal Positional Accuracy
The design accuracy is estimated not to exceed 1.52-meters NSSDA 95% confidence (0.88-meters Root Mean Squared Error (RMSE)) XY (0.62 meter RMSE X or Y). The Horizontal Positional Accuracy Values are 0.50 meters (Boston-Providence and Worcester) and 0.52 meters (Springfield). These are estimates of the accuracy of the horizontal coordinate measurements in the datasets derived using the Federal Geographic Data Committee, 1998, Geospatial Positioning Accuracy Standard, Part 3, National Standard for Spatial Data Accuracy, FGDC-STD-007.3-1998. Detailed accuracy reports were delivered to MassGIS.

Processing
Each orthoimage tile provides imagery over a 1500-meters by 1500-meters block on the ground. There is no image overlap between adjacent tiles in a footprint. The Worcester Footprint overlaps the Boston footprint (although this overlap was removed for distribution by MassGIS). While dozens of tiles for New Hampshire and the open ocean were delivered by USGS, MassGIS is not distributing them here. A small portion of southeast Duxbury Beach (affecting territory in both Duxbury and Plymouth) was not flown.The final digital ortho product delivered to MassGIS was a set of GeoTIFF files. The coordinate systems for the data are UTM Zone 19N for the Boston and Worcester areas, and UTM Zone 18N for Springfield, all referenced to the NAD83 datum.
The tile naming convention is based on the U.S. National Grid (USNG), taking the coordinates of the southwest corner of the orthoimage.
The following software was used for validation of the imagery and surface modeling: Pixel Factory 3.2, Linux; Bentley MicroStation; ESRI's ArcMap; ERDAS Imagine; TerraScan/TerraModel; SimActive Correlator3D; Fugro EarthData proprietary software; Adobe Photoshop; and GPro.
The Pixel Factory process was used in the generation of the orthoimagery covering all project tiles. An autocorrelated surface was generated to support the development of the orthophotography. This surface was edited into a bare earth digital elevation model (DEM) for use in orthorectification. The rectification process was then run using the processed digital surface model (DSM) on each flight line.

A "quicklook" (reduced resolution rectification) of each flight line was exported out of Pixel Factory. Radiometric adjustments were made to the quicklooks using Fugro proprietary tools. Radiometry was verified by visual inspection of the digital orthophoto. Slight systematic radiometric differences may exist between adjacent orthoimage files; these are due primarily to differences in source image capture dates and sun angles along flight lines. These differences can be observed in an image's general lightness or darkness when it is compared to adjacent orthoimages.
Tonal balancing may have been performed over a group of images during the mosaicking process, which served to lighten or darken adjacent images for better color tone matching. The radiometrically balanced imagery was then re-imported into the Pixel Factory system and the histogram from the quicklook was applied to the full resolution imagery.
Mosaic lines were placed, joining the ADS80 imagery strips. An initial QA/QC was performed by a technician to ensure that the mosaic lines were appropriately placed and that there was appropriate imagery coverage. Seamline mismatches were not corrected unless the overall displacement exceeded 0.6 meters. Orthoimages were visually inspected for completeness to ensure that no gaps or image misplacements existed within and between adjacent images.

The final imagery data set was removed from the Pixel Factory environment in a process called "packaging", where the individual tiles were created. All data processing in the Pixel Factory system was performed in UTM Zone 18N or 19N meters; it was during packaging that final datum and projection were defined.
The tiles were reviewed to ensure the output was successful and ground control points were measured and verified for accuracy. QA/QC was performed to look for anomalies, smears and other indications of problems within the digital orthophoto creation process, and interactive radiometric adjustment was applied where needed. Additional global radiometric adjustments were applied to the completed orthos in Adobe Photoshop to enhance the color and/or contrast as needed.
All GeoTIFF tagged data and image file sizes were validated using commercial GIS software to ensure proper loading before being archived. This validation procedure ensured correct physical format and field values for tagged elements. The final digital ortho products were delivered to USGS in GeoTIFF format by the end of June.
As requested by the Mass. Executive Office of Public Safety, MassGIS "deresolved" (blurred) the imagery in a few areas for security reasons.
Data captured in 2014 delivered as GeoTiffs to MassGIS were referenced to the NAD_1983_2011_UTM_Zone_18N and NAD_1983_2011_UTM_Zone_19N coordinate systems. The JPEG 2000 and MrSID versions MassGIS distributes are referenced to the NAD_1983_UTM_Zone_18N and NAD_1983_UTM_Zone_19N, respectively.
Distribution and Download
2. Regional MrSID Mosaics: 3 bands (RGB) created from the 0.3 meter GeoTIFF imagery (compression ratio 30:1)
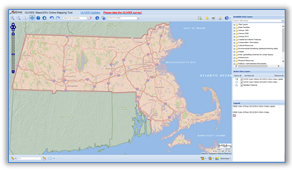
- Use the 2013/2014 Ortho Mosaic Downloader application. Click on a tile, then click on the download link in the popup.
- Mosaics are based on the COQ2013MOSAICS30CM_POLY index, or see this map.
Web Service
- The statewide 2013-2014 aerial imagery Web service may be added to ArcMap and other GIS software and applications.
Because of the large size of the GeoTIFFs, you can download the imagery in the compressed JPEG 2000 and MrSID formats. The imagery is also available as a Web service.
Free Download
1. 1,500m × 1,500m JPEG2000 tiles: 4 bands (RGBN), created from the 0.3 meter GeoTIFF imagery (compression ratio 20:1)
- Open MassMapper and use the Identify tools to select your area of interest.
- In the Identify results box click on the layer '2013/2014 30cm Aerial Imagery Index'. Click on each link to download a .zip file.
- To download many images in a more automated way, click the 'Save all records as' dropdown and save to an Excel file. Then:
- Open Excel, copy only the cells with the links and paste them into Notepad or other text editor and save as a text file.
- Download the free WinWGet software and load the text file into a new job. Run the job and all the zipped images will be downloaded to a folder you choose.

2. Regional MrSID Mosaics: 3 bands (RGB) created from the 0.3 meter GeoTIFF imagery (compression ratio 30:1)
- Use the 2013/2014 Ortho Mosaic Downloader application. Click on a tile, then click on the download link in the popup.
- Mosaics are based on the COQ2013MOSAICS30CM_POLY index, or see this map.
Web Service
- The statewide 2013-2014 aerial imagery Web service may be added to ArcMap and other GIS software and applications.
Displaying the images
For ArcGIS Desktop users, to facilitate the display and management of multiple JPEG2000 images, load the downloaded data into an unmanaged Raster Catalog inside a File Geodatabase, then add the Raster Catalog into ArcMap. With this approach, you will have only one item (the Catalog) in your table of contents.
What to do after downloading the JP2 data:
- Download the zipped file geodatabase MassGIS has prepared, containing two Raster Catalogs (for use in ArcGIS 9.3 and above)
- Unzip the download
- In ArcCatalog, go into the file geodatabase and right-click the raster catalogs (one for imagery referenced to UTM Zone 19N and one for imagery referenced to UTM Zone 18N) and choose Load.
See the Raster Catalog Instructions(PDF) for illustrated details.
Also, users may find that ArcMap automatically applies a Gamma Stretch of type Percent Clip when images are added to a map. If this is not desired, before adding the imagery to the map, go to the Customize menu > ArcMap Options... > Raster tab > Raster Layer tab and check the box for 'Enable Custom Rendering Defaults'. Change the Stretch Type to 'None' and keep the 'Apply Gamma Stretch' box unchecked. Changing the 'Display Resampling' to Bilinear or Cubic will give the imagery a smoother appearance. Then click Apply and OK. (See screen shot of this dialog). These settings are not saved after ArcMap is closed even if the MXD was saved. However, images added to a saved MXD will retain these display settings when the MXD is reopened.
Maintenance
The datalayer was produced by the USGS Earth Resources Observation and Science Center.
Customer Services
U.S. Geological Survey
EROS Data Center
47914 252nd Street
Sioux Falls,SD 57198-0001
VOICE: 1-800-252-4547
TDD/TTY 1-605-594-6933
FAX: 1-605-594-6589
EMAIL: custserv@usgs.gov
HOURS: Monday through Friday 8:00 AM to 4:00 PM (Central Time)
Additional information concerning the technical details of the project may be available upon request.