Downloads
All data downloads contain an ArcGIS 10.4+ layer file for use in ArcMap
Overview

Each location in this layer is associated with a land cover class value as well as a parcel use code.
Although both land cover and land use information are included, each of these aspects can be accessed independently, or in interesting and useful combinations with one another. For instance, a user can simply display impervious surfaces (land cover), or commercial parcels (land use). In combination, it is possible to display and measure the portions of the commercial parcels that are covered by impervious surfaces or the portions of residential parcels used as developed open space.
This layer is the result of a cooperative project between MassGIS and the National Oceanic and Atmospheric Administration’s (NOAA) Office of Coastal Management (OCM). Funding was provided by the Mass. Executive Office of Energy and Environmental Affairs.
This land cover/land use dataset does not conform to the classification schemes or polygon delineation of previous land use data from MassGIS (1951-1999; 2005).
MassGIS stores the data as a single statewide polygon feature class named LANDCOVER_LANDUSE_POLY in the spatial reference of NAD_1983_Contiguous_USA_Albers (EPSG: 5070).
Data development

The following sections describe the development and features of the two components, land cover and land use, as well as the final combined dataset.
Land cover
The thematic land cover dataset was created in raster format by NOAA's Coastal Change Analysis Program (C-CAP). C-CAP has produced numerous standardized land cover products which are included in the National Land Cover Database. These products are used in numerous ways to assess urban growth, inventory wetlands, coastal intertidal areas, and adjacent uplands, and delineate wildlife habitat to monitor changes in these areas. This information helps in the understanding of the landscape's response to natural and human-caused changes.
OCM worked in close coordination with MassGIS to produce the land cover. OCM delivered the data to MassGIS in an Albers projection.
This 2016 land cover information was initially developed as a 1-meter, 6-category draft raster derived from 2016 USDA National Agricultural Imagery Program (NAIP) aerial multispectral imagery. Classes were impervious, bare, grass, shrub, tree, and water. Additional reference data were used to create this 19-class version, including: 2016 WorldView multispectral satellite imagery, lidar-based terrain elevation data, 2016-era 2D structures data, and other ancillary data such as MassDOT Roads, MassDEP Wetlands, etc.

The wetlands in the final land cover product are exclusively from the C-CAP program, derived through a modeling process which used ancillary data such as Soils (SSURGO), the National Wetlands Inventory (NWI) and topographic derivatives, and in many locations will differ from the MassDEP Wetlands data.
The classes used in the C-CAP 2016 Massachusetts High-Resolution Land Cover product:
| Class Number | Class Name |
|---|---|
| 2 | Impervious |
| 5 | Developed Open Space |
| 6 | Cultivated Land |
| 7 | Pasture/Hay |
| 8 | Grassland |
| 9 | Deciduous Forest |
| 10 | Evergreen Forest |
| 12 | Scrub/Shrub |
| 13 | Palustrine Forested Wetland (C-CAP) |
| 14 | Palustrine Scrub/Shrub Wetland (C-CAP) |
| 15 | Palustrine Emergent Wetland (C-CAP) |
| 16 | Estuarine Forested Wetland (C-CAP) |
| 17 | Estuarine Scrub/Shrub Wetland (C-CAP) |
| 18 | Estuarine Emergent Wetland (C-CAP) |
| 19 | Unconsolidated Shore |
| 20 | Bare Land |
| 21 | Open Water |
| 22 | Palustrine Aquatic Bed (C-CAP) |
| 23 | Estuarine Aquatic Bed (C-CAP) |
The land cover information in this product is consistent with C-CAP’s High-Resolution Land Cover Classification Scheme (PDF), which contains detailed descriptions of the above 19 categories. Also see General information about C-CAP High-Resolution Land Cover.
**Download the land cover data in raster format from the NOAA Data Access Viewer (search for an area by name or use the pencil button to draw an extent to limit the amount of data).**
Land use
The land use component of the data layer is represented by the Property Type Classification Code associated with each parcel in MassGIS' Property Tax Parcels layer. These "use codes" come from the Mass. Department of Revenue Division of Local Services (DLS), along with custom use codes some municipalities include in their parcel data.
For this project, MassGIS created a parcel layer using data deliverables as close as possible to the time of the 2016 NAIP imagery used for the land cover. Since parcel data complying with Level 3 of the MassGIS standard was not available from every municipality for the year 2016, some information was selected from a different year to use data as close to 2016 as possible, with the following rules:
If Fiscal Year (FY) 2016 data was available, it was used. Otherwise, data was used from other years in the following order: 2017 (+1), 2015 (-1), 2018 (+2), 2014 (-2), 2013 (-3), 2012 (-4), 2011 (-5). Fiscal year values were retained in the final product to help indicate relative reliability of the USECODE.
MassGIS merged these parcel data into one feature class and dissolved them based on these fields:
| Name | Description |
|---|---|
| USE_CODE | Use code from DOR DLS, along with custom use codes some municipalities include in their parcel data. |
| FY | Fiscal year |
| POLY_TYPE | Parcel type (FEE, TAX, ROW, WATER, PRIV_ROW, RAIL_ROW) |
| TOWN_ID | Town ID (1-351) |
| GEN_CODE | Generalized use code chosen by MassGIS for this project to simplify the 1,600+ USE_CODEs for map display. The codes are the same as USEGENCODE (see table below). |

Combined Land Cover – Land Use Data
For efficient processing and distribution, MassGIS split up the statewide land cover raster into 291 smaller, regularly sized and spaced tiles, each 10km by 10km (10,000 x 10,000 pixels).
The Create Fishnet tool produced a polygon index that precisely fit the tiles. The tiles were identified with a TILENAME value based on row and column position. For example, TILENAME “R07C17” identifies the tile in row 7, column 17. The index is named LANDCOVER_USE_INDEX_POLY. Aside from TILENAME, the other field is SHP_LINK, which stores a link to download a zipped land cover-land use shapefile for each tile. Download the index (zipped shapefile)
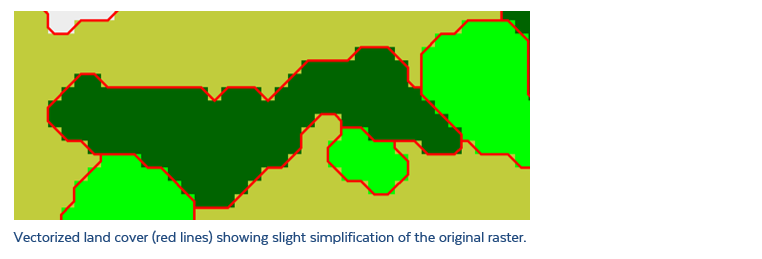
In order to match the data model of the land use ahead of combining the two datasets, each land cover image was converted to a polygon shapefile ("vectorization") using a Raster to Shapefile model in ERDAS IMAGINE. This method preserves the thematic attributes and simplifies the polygons very slightly.
MassGIS carried out the following steps in ArcGIS 10.6.1:
- Reprojected the land use polygons from Massachusetts State Plane to the same Albers projection of the land cover.
- Used the Identity tool to geometrically combine the land cover polygons with the dissolved parcel data to produce a land cover-land use feature class for each tile.
- Checked and repaired the geometry of the Identity output.
- Converted all multipart polygons to single-part polygons in the Identity output.
The Identity created numerous very small polygons because the two components (land cover and land use) were not spatially correlated. To preserve the input data, MassGIS decided not to eliminate polygons or perform any other cartographic refinement at this point. Users can easily perform these operations if desired.
The fields in the final land cover-land use data are:
| Field | Type | Description |
|---|---|---|
| COVERNAME | Char / 50 | Land cover class name |
| COVERCODE | Integer / 5 | Land cover class code |
| USEGENNAME | Char / 50 | Generalized land use name |
| USEGENCODE | Integer / 5 | Generalized land use code |
| USE_CODE | Char / 4 | Detailed parcel use code |
| POLY_TYPE | Char / 15 | Parcel polygon type |
| FY | Integer / 5 | Fiscal year of parcel data |
| TOWN_ID | Integer / 5 | City/Town ID (1-351). Polygons with a TOWN_ID of zero are in areas where the land cover occurs offshore. |
| TILENAME | Char / 6 | Index tile name used for shapefile distribution |
See the C-CAP table above for a list of the COVERNAME and COVERCODE values. The generalized use codes are as follows:
| USEGENCODE | USEGENNAME |
|---|---|
| 0 | Unknown |
| 2 | Open land |
| 3 | Commercial |
| 4 | Industrial |
| 6 | Forest |
| 7 | Agriculture |
| 8 | Recreation |
| 9 | Tax exempt |
| 10 | Mixed use, primarily residential |
| 11 | Residential - single family |
| 12 | Residential - multi-family |
| 13 | Residential - other |
| 20 | Mixed use, other |
| 30 | Mixed use, primarily commercial |
| 55 | Right-of-way |
| 88 | Water |
Displaying the data

MassGIS includes a layer file for use in ArcMap 10.4+ and ArcGIS Pro with each download. (Users will need to apply the symbology or reset the data source for each download.) The LYR uses the 'Unique values, many fields' option with COVERCODE and USEGENCODE and symbolizes all impervious polygons (COVERCODE = 2) based on their generalized use code; all non-impervious land cover polygons are symbolized by their land cover category. The idea behind this method is to use both cover and use codes to provide a truer picture of how land is being used: parcel use codes may indicate allowed or assessed, not actual use; land cover alone (especially impervious) does not indicate actual use.
Using USE_CODE for symbology is another option. For example, polygons representing cranberry bogs (with standard USE_CODE of 270 or 710) could be selected and displayed with their own symbol. Be aware, though, that some municipalities may not use these standard codes, and features like cranberry bogs may appear to stop abruptly at the town line.

Users, however, may choose to display the data on only land cover, or just by parcel use code, with any custom symbology. NOAA presents the land cover data with its C-CAP classes. MassGIS also distributes an ArcGIS layer file symbolizing the data on the land cover name (COVERNAME) field, using the C-CAP raster colormap symbols. Downloaded this layer file here: LandCover_LandUse_2016_CCAP.lyr (apply to data or reset the data source)

Specific combinations of land cover and land use categories may be queried for analysis and display. For example, users may want to determine the amount of lawns (open space developed, from land cover) on single family residential parcels by using a definition query of 'COVERCODE = 5 AND USEGENCODE = 11'.
For fastest draw time, MassGIS suggests displaying the data in small geographic areas and setting maximum scales. Also, if using Esri software, ArcGIS Pro (on a computer with a good graphic card and a large amount of RAM - see specs) displays the data more quickly than ArcMap.
Further reading
For more information on the data development process and data accuracy reporting, see the full detailed description document.
Also see: