Downloads
Overview
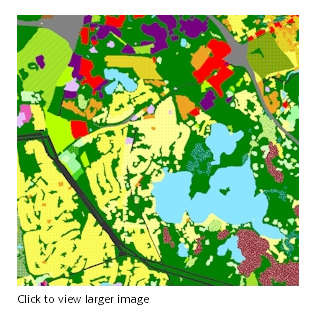
The Land Use (2005) datalayer is a Massachusetts statewide, seamless digital dataset of land cover / land use, created using semi-automated methods, and based on 0.5 meter resolution aerial imagery captured in April 2005.
The classification scheme is based on the coding schema used for previous Massachusetts land use datasets, with modifications. The categorization is represented by two fields: LU05_DESC (land use description) and LUCODE (land use code). Code descriptions are described below.
These data were prepared by Sanborn, and delivered to MassGIS in 10 separate edge-matched delivery area shapefiles.
The minimum mapping unit (MMU) is generally 1 acre, but a MMU as low as ¼ acre may be found in some areas, e.g. in urban areas where assessor parcels were used to enhance the mapping of multi-family residential areas.
The formerly used “MacConnell” schema combined land cover and land use categories, and was designed for manual interpretation of aerial photos. In this project, that protocol was modified so that it was useful in an automated environment, but it still maintains much compatibility with the older system. The spatial accuracy of the current method is excellent, since the land use map is derived directly from the ortho image.
The project started with a preliminary analysis of a small Test Area, to establish rules and buffer distances. Once these rules were established, they were applied to three larger Pilot Areas covering about 5% of the area of the state, and chosen to include a great deal of development, and a variety of land use types. The Test Area and Pilot Area delineations were then thoroughly reviewed by MassGIS staff, and suggestions were communicated to Sanborn until the product was considered acceptable. The final rules were then applied to a full production process. The data were created and checked in the 2007-2009 time frame. There was a hiatus in production from June to December 2007 due to contractual issues.
In ArcSDE the layer is named LANDUSE2005_POLY.
Production
The process of delineating and coding the data was carried out by Sanborn using semi-automated methods for the classification of the 4-band 2005 ortho imagery, attributes from the manually-compiled 1999 data, and assessor parcels and other ancillary data. Throughout the course of the quality assurance (QA) phase, MassGIS edited extensively, incorporating additional ancillary data, and information from the imagery. Although the statewide data were delivered for 10 separate delivery areas, production was done on even smaller production areas to meet the limitations of various software tools. All production and delivery areas were edge-matched by Sanborn prior to delivery.
For urban classes, (residential, commercial, etc.) the impervious surface data derived from the 2005 ortho image were used as a foundation, and land use labels were transferred to the impervious surface dataset. The 2005 Impervious Surface dataset primarily depicts human-made impervious surfaces that are visible in the 2005 ortho image. Certain surfaces, because of their particular spectral response (color) in the imagery, were difficult to capture. Additionally, patches of pavement or rooftops etc. that are were in deep shade were frequently missed. Before labeling, MassDOT Roads centerlines were buffered in order to mask out underlying impervious, and to separate the impervious features on either side of the road.
Where no change took place from 1999 to 2005, the labels were derived from the use code in MassGIS' Property Tax Parcels data (where parcel data existed), and from the 1999 land use data wherever no parcel data was available. Where change had occurred, the land use category was assigned manually.
Wherever parcel data was available, and the parcel use code could be associated in a one-to-one relationship with a single land use code, the use code values were "crosswalked" to the 2005 land use codes. For example, a parcel with an assessor use code of 324 indicates that a supermarket is on the parcel, and so the land use polygon that covers the portion of the parcel with the building and parking lot must be coded 15 – Commercial. On the other hand, when a developed assessor use code can logically be assigned more than one acceptable land use code (a one-to-many relationship), the land use classification required a visual assessment or other approach that can discriminate appropriately. An example might be when the use code is 101, a single-family residence is present, but the land use value could be 11, 12, 13, or 38, depending on the density of residences in the vicinity.
Buffer Labeled Impervious Data
An initial buffering of the impervious data produced the preliminary boundaries of the land uses for urban classes. Before buffering, small (< 20 m2) free-standing impervious clumps were erased. Most of these were identified as small isolated structures such as sheds, etc. Depending on the land use label assigned to the clumps, various buffer distances and priority rules were applied.
Create Pervious Classification
The non-impervious (pervious) uses were classified separately through image segmentation using Definiens® software. The segmented classification was filtered to generalize / smooth the class boundaries, and features smaller than about 1 acre were dissolved into surrounding features.
Label Pervious Data
Where logical combinations of segment labels and 1999 land use labels occurred, the segment was labeled with the 1999 class which contained the largest portion of the segment (using a zonal majority rule). When the combination was illogical, the pervious data were flagged and then corrected in a manual review.
Secondary Buffer
The buffered and labeled impervious and labeled pervious data were combined through a second buffer using ESRI's ArcGIS®. This buffer incorporated natural classes into urban class delineations, e.g. lawns (pervious segment) into residential (buffered and labeled impervious). It allowed impervious features of certain classes to grow into pervious areas of specific classes. This buffer was allowed to grow a specified distance beyond the edge of the first buffer. The buffer distance and class hierarchy were specified in an automated model.
Note: A significant result of the semi-automated method of production is that low and very low density residential areas are mapped so that the “useable area” (the residence and landscaped area immediately around it) is depicted. For example, a neighborhood of houses on relatively large wooded lots will be shown as polygons around the developed portions of the properties embedded in a matrix of Forest.
Wetlands
Wetlands from the DEP Wetlands datalayer were added to the land use classification, replacing any underlying interpreted polygons. The wetlands polygons were not modified in any way, and the coastline was based on this dataset. No interpretation of wetlands was done except for cranberry bogs.
Clean Data / Post-production
A series of filters was applied to smooth the polygon boundaries, and to maintain a minimum mapping area. (Isolated polygons with developed uses in rural areas were kept, even though the area may have been less than the 1 acre MMU.)
A final manual quality control (QC) review of the data was performed by Sanborn, and polygons that did not delineate appropriately through the automated method were corrected in terms of geometry and labeling. During this phase of production, MassGIS provided input based on local knowledge and onsite field verification.
Two areas were specifically addressed post production: the under-representation of multi-family housing in areas where there were no parcel data, and the residential class densities. Multi-family housing was delineated through the use of an assessment dataset geocoded to NAVTEQ road centerlines (Warren Group points), and identified manually in areas where there were significant concentrations of these points.
MassGIS QA
Upon receipt of the data, MassGIS performed extensive QA steps. These included comparing the draft land use with numerous ancillary datasets, manual photo interpretation, and field visits. Draft data was graciously reviewed by several Regional Planning Agencies across the state.
MassGIS carried out an additional post production step to further improve the mapping of residential, commercial, and industrial land use. In municipalities where assessors' parcels were available, the developed portions of residential, commercial, or industrial parcels with use codes that unambiguously corresponded to single land use codes were incorporated into the land use data. Additionally, in order to make the statewide dataset more manageable, polygons were simplified and slivers were removed.
During QA, MassGIS combined the data into a single statewide layer, and then split it into more manageable County-sized pieces for distribution. For more efficient display and spatial indexing, the final statewide version includes the county boundaries. County boundaries are based on the Municipalities layer.
Attributes
The layer's polygon attribute table contains the following items:
| Field name | Description |
|---|---|
| LU05_DESC | Land Use Description (text) |
LUCODE | Land Use Code (short integer) |
AREA stores the polygons area in square meters, LEN the perimeter in meters, both generated by ArcGIS software.
Land Use Code Definitions
| Land Use Code | Land Use Description | Detailed Definition |
|---|---|---|
| 1 | Cropland | Generally tilled land used to grow row crops. Boundaries follow the shape of the fields and include associated buildings (e.g., barns). This category also includes turf farms that grow sod. |
| 2 | Pasture | Fields and associated facilities (barns and other outbuildings) used for animal grazing and for the growing of grasses for hay. |
| 3 | Forest | Areas where tree canopy covers at least 50% of the land. Both coniferous and deciduous forests belong to this class. |
| 4 | Non-Forested Wetland | DEP Wetlands (1:12,000) WETCODEs 4, 7, 8, 12, 23, 18, 20, and 21. |
| 5 | Mining | Includes sand and gravel pits, mines and quarries. The boundaries extend to the edges of the site’s activities, including on-site machinery, parking lots, roads and buildings. |
| 6 | Open Land | Vacant land, idle agriculture, rock outcrops, and barren areas. Vacant land is not maintained for any evident purpose and it does not support large plant growth. |
| 7 | Participation Recreation | Facilities used by the public for active recreation. Includes ball fields, tennis courts, basketball courts, athletic tracks, ski areas, playgrounds, and bike paths plus associated parking lots. Primary and secondary school recreational facilities are in this category, but university stadiums and arenas are considered Spectator Recreation. Recreation facilities not open to the public such as those belonging to private residences are mostly labeled with the associated residential land use class not participation recreation. However, some private facilities may also be mapped. |
| 8 | Spectator Recreation | University and professional stadiums designed for spectators as well as zoos, amusement parks, drive-in theaters, fairgrounds, race tracks and associated facilities and parking lots. |
| 9 | Water-Based Recreation | Swimming pools, water parks, developed freshwater and saltwater sandy beach areas and associated parking lots. Also included are scenic areas overlooking lakes or other water bodies, which may or may not include access to the water (such as a boat launch). Water-based recreation facilities related to universities are in this class. Private pools owned by individual residences are usually included in the Residential category. Marinas are separated into code 29. |
| 10 | Multi-Family Residential | Duplexes (usually with two front doors, two entrance pathways, and sometimes two driveways), apartment buildings, condominium complexes, including buildings and maintained lawns. Note: This category was difficult to assess via photo interpretation, particularly in highly urban areas. |
| 11 | High Density Residential | Housing on smaller than 1/4 acre lots. See notes below for details on Residential interpretation. |
| 12 | Medium Density Residential | Housing on 1/4 - 1/2 acre lots. See notes below for details on Residential interpretation. |
| 13 | Low Density Residential | Housing on 1/2 - 1 acre lots. See notes below for details on Residential interpretation. |
| 14 | Saltwater Wetland | DEP Wetlands (1:12,000) WETCODEs 11 and 27. |
| 15 | Commercial | Malls, shopping centers and larger strip commercial areas, plus neighborhood stores and medical offices (not hospitals). Lawn and garden centers that do not produce or grow the product are also considered commercial. |
| 16 | Industrial | Light and heavy industry, including buildings, equipment and parking areas. |
| 17 | Transitional | Open areas in the process of being developed from one land use to another (if the future land use is at all uncertain). Formerly identified as "Urban Open". |
| 18 | Transportation | Airports (including landing strips, hangars, parking areas and related facilities), railroads and rail stations, and divided highways (related facilities would include rest areas, highway maintenance areas, storage areas, and on/off ramps). Also includes docks, warehouses, and related land-based storage facilities, and terminal freight and storage facilities. Roads and bridges less than 200 feet in width that are the center of two differing land use classes will have the land use classes meet at the center line of the road (i.e., these roads/bridges themselves will not be separated into this class). |
| 19 | Waste Disposal | Landfills, dumps, and water and sewage treatment facilities such as pump houses, and associated parking lots. Capped landfills that have been converted to other uses are coded with their present land use. |
| 20 | Water | DEP Wetlands (1:12,000) WETCODEs 9 and 22. |
| 23 | Cranberry bog | Both active and recently inactive cranberry bogs and the sandy areas adjacent to the bogs that are used in the growing process. Impervious features associated with cranberry bogs such as parking lots and machinery are included. Modified from DEP Wetlands (1:12,000) WETCODE 5. |
| 24 | Powerline/Utility | Powerline and other maintained public utility corridors and associated facilities, including power plants and their parking areas. |
| 25 | Saltwater Sandy Beach | DEP Wetlands (1:12,000) WETCODEs 1, 2, 3, 6, 10, 13, 17 and 19 |
| 26 | Golf Course | Includes the greenways, sand traps, water bodies within the course, associated buildings and parking lots. Large forest patches within the course greater than 1 acre are classified as Forest (class 3). Does not include driving ranges or miniature golf courses. |
| 29 | Marina | Include parking lots and associated facilities but not docks (in class 18) |
| 31 | Urban Public/Institutional | Lands comprising schools, churches, colleges, hospitals, museums, prisons, town halls or court houses, police and fire stations, including parking lots, dormitories, and university housing. Also may include public open green spaces like town commons. |
| 34 | Cemetery | Includes the gravestones, monuments, parking lots, road networks and associated buildings. |
| 35 | Orchard | Fruit farms and associated facilities. |
| 36 | Nursery | Greenhouses and associated buildings as well as any surrounding maintained lawn. Christmas tree (small conifer) farms are also classified as Nurseries. |
| 37 | Forested Wetland | DEP Wetlands (1:12,000) WETCODEs 14, 15, 16, 24, 25 and 26. |
| 38 | Very Low Density Residential | Housing on > 1 acre lots and very remote, rural housing. See notes below for details on Residential interpretation. |
| 39 | Junkyard | Includes the storage of car, metal, machinery and other debris as well as associated buildings as a business. |
| 40 | Brushland/Successional | Predominantly (> 25%) shrub cover, and some immature trees not large or dense enough to be classified as forest. It also includes areas that are more permanently shrubby, such as heath areas, wild blueberries or mountain laurel. |
Notes on residential categories (10, 11, 12, 13, 38):
- Residential densities were determined either from the parcel data, or by visually comparing the house to surrounding houses, observing the spacing between the houses as well as the relative amount of yard space between them. If housing in an area seemed to fall between two classes, the most accurate density was chosen in an attempt to maintain consistency throughout blocks and subdivisions or neighborhoods.
- Residential land use polygons cover buildings and the surrounding landscaped area. They usually assume a rounded shape and extend (buffered) approximately 30 feet from the edge of the impervious feature. In some cases, because of the semi-automated method using buffered impervious surfaces, driveways passing through forests or other non-residential land uses may not be included in the residential category.
Maintenance
MassGIS is maintaining this layer.