Downloads
Download Statewide Land Use Polygons (108 MB)
Shapefile and ArcGIS layer files for 21- and 37-class symbology
Download Statewide Historical Land Use Table
(self-extracting .zip containing the file LANDUSE_POLY_HISTORY.dbf, which stores the historical landuse codes for 1951, 1990, 1991 and 1997, where available; the resulting .dbf is 10 MB)
Download Statewide Land Use Status Layer
(polygon shapefile that stores the years of most recent photography used for land use interpretation)
Overview
Please see the Land Use Status Map, which displays the years for which land use data were interpreted for each town. In ArcSDE the layer is named LANDUSE_POLY.
The year of most recent photography used for land use data interpretation is stored in a single statewide polygon layer called LUSTAT_POLY. This layer was necessitated because some towns contain partial coverage for a certain year, which eliminated the one-to-one link between town-ID and year.
MassGIS has produced Land Use Summary Statistics, by municipality, for all three years for which land use is available statewide. These tables summarize acreage for each land use type by year, as well as land use change from 1971 to 1985 and 1985 to 1999.
Production

Photointerpretation and automation were done by the Resource Mapping Project at the University of Massachusetts, Amherst. The RMP staff aggregated the 104 classes of their original 1971 interpretation into 21 categories and digitized the data into individual community digital coverages using a PC version of Arc/INFO software. The RMP staff then visually compared the 1971 photography and 1985 photography and produced a digital map of only 1971-85 change for each community. Interpretation was made from 1:40,000 9"x 9" color infrared photos flown in Summer 1985. Southeastern Mass was flown in September 1984. The flight and photography were funded by the Massachusetts Dept. of Environmental Management for another project. Several additional categories of land use were added for parts of Massachusetts. Ten communities in the Southeastern Regional Planning & Economic Development District (SRPEDD) west of Buzzards Bay plus Bourne and Falmouth have a total of 28 land use classes. The 28 classes include the original 21 categories plus 23,24,25,26,27,28 and 29 (see Code Definitions below).
In 1990, the Cape Cod Commission funded an update of Cape Cod. These data are categorized into 26 land use classifications, expanding the original codes to include 23,26,29 and 30. These additional codes, along with the original 21, are listed in LU37_CODE. The Massachusetts Water Resources Authority (MWRA) funded land use interpretation in 1991 for 14 towns. The 33 code scheme for this update includes codes 23,24,29,30,31,32,33,34,35,36 and 37 in addition to the original 21 codes. The Executive Office of Transportation and Construction (EOTC, now part of MassDOT Highway Division) also funded a 1991 update for 113 towns using the same set of codes as the MWRA except for code 37. The UMass RMP staff updated some other towns not included in the 1990-1991 update based on digital orthophotography flown during 1992, 1995, and 1997. The towns that have been updated between 1985 and 1999 are listed below. The minimum mapping unit used was one acre.
Each land use coverage was plotted at a scale of 1:25,000 by the RMP before delivery to MassGIS. MassGIS used a workstation version of Arc/INFO to combine data from different years. Each coverage, therefore, may have contained many small polygons that may have been one land use type in, say, 1971. Over the years the land may have been split up for different uses, and the linework in the current layer reflects the land use boundaries for all these uses during the many years of interpretation. The process of combining the data from different years created some 'sliver polygons'. These result when a theoretically coterminous line in each coverage is actually offset due to it having been digitized twice, e.g. the shore of a lake. Many of these slivers were eliminated by screening for an area/perimeter ratio beyond normal limits.
NOTE: This project was funded by the Massachusetts Executive Office of Environmental Affairs (EOEA), the Executive Office of Transportation and Construction, Massachusetts Water Resources Authority and several regional planning agencies. Photointerpretation and digitizing were completed by the UMASS-Amherst Department of Forestry Resource Mapping Project (RMP).
In 1999, EOEA funded the acquisition of statewide 1:25,000 aerial color infrared photography for use in the latest round of land use interpretation. Again, photointerpretation and digitizing were completed by the UMASS Department of Forestry Resource Mapping Project. As part of the 1999 update RMP staff also removed slivers generated in earlier updates, fine-tuned edgematching between towns, and reinterpreted some historical land use codes.
The photography used for the land use interpretation were in hardcopy form only. They are currently housed at the UMass Amherst library as part of its aerial photo collection. Visit https://www.library.umass.edu/collections/maps/aerial-photo-collection/ for details.
The polygon data stores land use codes for 1971, 1985 and 1999. A "history table" stores codes only for years other than 1971, 1985 and 1999 (see the section Additional Land Use Interpretation).
Attributes
The layer's polygon attribute table contains the following items:
| Field name | Description |
|---|---|
| TILE_NAME | Town-ID (1-351, from Municipalities Layer) |
| LU_ID | Unique polygon ID for the town |
| LU21_1971 | 21-category landuse code for 1971 |
| LU21_1985 | 21-category landuse code for 1985 |
| LU37_1985 | 37-category landuse code for 1985 |
| LU21_1999 | 21-category landuse code for 1999 |
| LU37_1999 | 37-category landuse code for 1999 |
| RELATEID | Item combining the TILE_NAME and LU_ID items, zero-filled so that the LU_ID portion of this item spans five digits. This item uniquely identifies each polygon within the state. |
| AREA_ACRES | Area of polygon in acres |
For older land use codes (1951-1997, where interpreted), see the section Additional Land Use Interpretation.
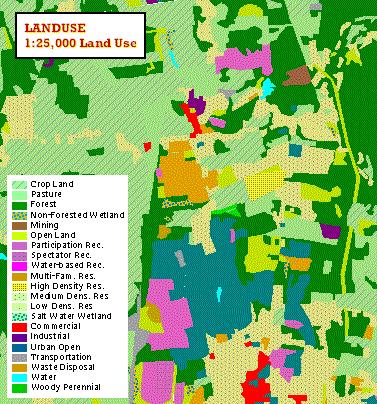
Land Use Code Definitions
The land use code items (LU21_* and LU37_*) in the polygon attribute and history tables represent two classifications of land use. The 21-category classification aggregates the categories in the 37-category classification as follows:
| CODE | ABBREV | CATEGORY | DEFINITION |
|---|---|---|---|
| 1 | AC | Cropland | Intensive agriculture |
| 2 | AP | Pasture | Extensive agriculture |
| 3 | F | Forest | Forest |
| 4 | FW | Wetland | Nonforested freshwater wetland |
| 5 | M | Mining | Sand; gravel & rock |
| 6 | O | Open Land | Abandoned agriculture; power lines; areas of no vegetation |
| 7 | RP | Participation Recreation | Golf; tennis; Playgrounds; skiing |
| 8 | RS | Spectator Recreation | Stadiums; racetracks; Fairgrounds; drive-ins |
| 9 | RW | Water Based Recreation | Beaches; marinas; Swimming pools |
| 10 | R0 | Residential | Multi-family |
| 11 | R1 | Residential | Smaller than 1/4 acre lots |
| 12 | R2 | Residential | 1/4 - 1/2 acre lots |
| 13 | R3 | Residential | Larger than 1/2 acre lots |
| 14 | SW | Salt Wetland | Salt marsh |
| 15 | UC | Commercial | General urban; shopping center |
| 16 | UI | Industrial | Light & heavy industry |
| 17 | UO | Urban Open | Parks; cemeteries; public & institutional greenspace; also vacant undeveloped land |
| 18 | UT | Transportation | Airports; docks; divided highway; freight; storage; railroads |
| 19 | UW | Waste Disposal | Landfills; sewage lagoons |
| 20 | W | Water | Fresh water; coastal embayment |
| 21 | WP | Woody Perennial | Orchard; nursery; cranberry bog |
| 22 | - | No Change | Code used by MassGIS only during quality checking |
The additional categories in the LU37_* fields are:
| CODE | ABBREV | CATEGORY |
|---|---|---|
| 23 | CB | Cranberry bog (part of #21) |
| 24 | PL | Powerlines (part of #6) |
| 25 | RSB | Saltwater sandy beach (part of #9; no longer used) |
| 26 | RG | Golf (part of #7) |
| 27 | TSM | Tidal salt marshes (part of #14; no longer used) |
| 28 | ISM | Irregularly flooded salt marshes (part of #14; no longer used) |
| 29 | RM | Marina (part of #9) |
| 30 | - | New ocean (areas of accretion; part of #20) |
| 31 | UP | Urban public (part of #17) |
| 32 | TF | Transportation facilities (part of #18) |
| 33 | H | Heath (part of #17) |
| 34 | CM | Cemeteries (part of #17) |
| 35 | OR | Orchard (part of #21) |
| 36 | N | Nursery (part of #21) |
| 37 | - | Forested wetland (part of #3; no longer used) |
All land use categories were aggregated from 104 categories originally defined in 1971. Further information on them can be obtained from Professor William MacConnell at the Dept. of Forestry, University of Massachusetts, Amherst.
Additional Land Use Interpretation
In addition to the statewide land use codes for 1971, 1985, and 1999, some towns have had land use interpreted for other years (1951, 1990, 1991, 1992 and 1997). To store these additional codes, a related "Polygon History table" (LANDUSE_POLY_HISTORY) was created. The RELATEID field joins this table to the polygons. (The history table does not contain data for 1992. To obtain this data please contact MassGIS).
Important note when joining to the historical land use tables: Users may need to define a query (e.g. a "definition query" in ArcMap) or select the history table records for a particular year and export the selected records to a new table, and then join the polygons to the subset of the table, for a one-to-one relationship between the tables for a single year.
The LANDUSE_POLY_HISTORY table contains the following items:
| Field name | Description |
|---|---|
| TILE_NAME | Town-ID |
| LU_ID | Unique polygon ID for the town |
| LU21_CODE | 21-category landuse code (for YEAR) |
| LU37_CODE | 37-category landuse code (for YEAR); Code will be same as LU21_CODE for pre-1990 data (except 10 SRPEDD towns for 1985, as noted above). |
| YEAR | Date of historical data (Year of photography used in land use compilation - 1951, 1990, 1991, 1997) |
| RELATEID | Item combining the TILE_NAME and LU_ID items, zero-filled so that the LU_ID portion of this item spans five digits. This item uniquely identifies each polygon within the state. |
The following towns have been updated by UMass-Amherst using orthophotography flown during the years listed in parentheses:
| Town ID | Town Name | Year |
|---|---|---|
| 4 | ADAMS | 1997 |
| 8 | AMHERST | 1997 |
| 11 | ASHBURNHAM | 1997 |
| 12 | ASHBY | 1997 |
| 13 | ASHFIELD | 1997 |
| 15 | ATHOL | 1997 |
| 29 | BERNARDSTON | 1997 |
| 47 | BUCKLAND | 1995 |
| 53 | CHARLEMONT | 1997 |
| 66 | COLRAIN | 1997 |
| 68 | CONWAY | 1997 |
| 74 | DEERFIELD | 1997 |
| 91 | ERVING | 1997 |
| 98 | FLORIDA | 1997 |
| 103 | GARDNER | 1997 |
| 106 | GILL | 1997 |
| 108 | GOSHEN | 1997 |
| 111 | GRANBY | 1997 |
| 114 | GREENFIELD | 1997 |
| 117 | HADLEY | 1997 |
| 127 | HATFIELD | 1997 |
| 129 | HAWLEY | 1997 |
| 130 | HEATH | 1997 |
| 140 | HUBBARDSTON | 1992,1997 |
| 154 | LEVERETT | 1997 |
| 156 | LEYDEN | 1997 |
| 190 | MONROE | 1997 |
| 192 | MONTAGUE | 1997 |
| 204 | NEW SALEM | 1992 |
| 209 | NORTH ADAMS | 1997 |
| 214 | NORTHAMPTON | 1997 |
| 217 | NORTHFIELD | 1997 |
| 223 | ORANGE | 1997 |
| 234 | PETERSHAM | 1992 |
| 235 | PHILLIPSTON | 1992,1997 |
| 237 | PLAINFIELD | 1997 |
| 253 | ROWE | 1997 |
| 255 | ROYALSTON | 1997 |
| 263 | SAVOY | 1997 |
| 268 | SHELBURNE | 1995,1997 |
| 279 | SOUTHWICK | 1997 |
| 289 | SUNDERLAND | 1997 |
| 294 | TEMPLETON | 1992,1997 |
| 312 | WARWICK | 1997 |
| 319 | WENDELL | 1992,1997 |
| 331 | WESTHAMPTON | 1997 |
| 332 | WESTMINSTER | 1992,1997 |
| 337 | WHATELY | 1997 |
| 340 | WILLIAMSBURG | 1997 |
| 341 | WILLIAMSTOWN | 1997 |
| 343 | WINCHENDON | 1997 |
UMass-Amherst also interpreted land use for 1951 for the 15 communities on Cape Cod:
| Town ID | Town Name |
|---|---|
| 20 | BARNSTABLE |
| 36 | BOURNE |
| 41 | BREWSTER |
| 55 | CHATHAM |
| 75 | DENNIS |
| 86 | EASTHAM |
| 96 | FALMOUTH |
| 126 | HARWICH |
| 172 | MASHPEE |
| 224 | ORLEANS |
| 242 | PROVINCETOWN |
| 261 | SANDWICH |
| 300 | TRURO |
| 318 | WELLFLEET |
| 351 | YARMOUTH |
The following is a list of town IDs and names for which 1990/1991 land use is available. The organization that completed the updates is listed in parentheses.
| Town ID | Town Name | Organization |
|---|---|---|
| 1 | ABINGTON | EOTC |
| 2 | ACTON | EOTC |
| 7 | AMESBURY | EOTC |
| 9 | ANDOVER | EOTC |
| 10 | ARLINGTON | MWRA |
| 14 | ASHLAND | EOTC |
| 16 | ATTLEBORO | EOTC |
| 18 | AVON | EOTC |
| 19 | AYER | EOTC |
| 20 | BARNSTABLE | CAPE |
| 23 | BEDFORD | EOTC |
| 25 | BELLINGHAM | EOTC |
| 26 | BELMONT | MWRA |
| 28 | BERLIN | EOTC |
| 30 | BEVERLY | EOTC |
| 31 | BILLERICA | EOTC |
| 32 | BLACKSTONE | EOTC |
| 34 | BOLTON | EOTC |
| 35 | BOSTON | MWRA |
| 36 | BOURNE | CAPE |
| 37 | BOXBOROUGH | EOTC |
| 38 | BOXFORD | EOTC |
| 40 | BRAINTREE | EOTC |
| 41 | BREWSTER | CAPE |
| 42 | BRIDGEWATER | EOTC |
| 44 | BROCKTON | EOTC |
| 46 | BROOKLINE | MWRA |
| 48 | BURLINGTON | EOTC |
| 49 | CAMBRIDGE | MWRA |
| 50 | CANTON | EOTC |
| 51 | CARLISLE | EOTC |
| 52 | CARVER | EOTC |
| 55 | CHATHAM | CAPE |
| 56 | CHELMSFORD | EOTC |
| 57 | CHELSEA | MWRA |
| 64 | CLINTON | EOTC |
| 65 | COHASSET | EOTC |
| 67 | CONCORD | EOTC |
| 71 | DANVERS | EOTC |
| 73 | DEDHAM | EOTC |
| 75 | DENNIS | CAPE |
| 78 | DOVER | EOTC |
| 79 | DRACUT | EOTC |
| 81 | DUNSTABLE | EOTC |
| 82 | DUXBURY | EOTC |
| 83 | EAST BRIDGEWATER | EOTC |
| 86 | EASTHAM | CAPE |
| 88 | EASTON | EOTC |
| 92 | ESSEX | EOTC |
| 93 | EVERETT | MWRA |
| 96 | FALMOUTH | CAPE |
| 99 | FOXBOROUGH | EOTC |
| 100 | FRAMINGHAM | EOTC |
| 101 | FRANKLIN | EOTC |
| 105 | GEORGETOWN | EOTC |
| 107 | GLOUCESTER | EOTC |
| 115 | GROTON | EOTC |
| 116 | GROVELAND | EOTC |
| 118 | HALIFAX | EOTC |
| 119 | HAMILTON | EOTC |
| 122 | HANOVER | EOTC |
| 123 | HANSON | EOTC |
| 125 | HARVARD | EOTC |
| 126 | HARWICH | CAPE |
| 128 | HAVERHILL | EOTC |
| 131 | HINGHAM | EOTC |
| 133 | HOLBROOK | EOTC |
| 136 | HOLLISTON | EOTC |
| 138 | HOPEDALE | EOTC |
| 139 | HOPKINTON | EOTC |
| 141 | HUDSON | EOTC |
| 142 | HULL | EOTC |
| 144 | IPSWICH | EOTC |
| 145 | KINGSTON | EOTC |
| 146 | LAKEVILLE | EOTC |
| 147 | LANCASTER | EOTC |
| 149 | LAWRENCE | EOTC |
| 155 | LEXINGTON | EOTC |
| 157 | LINCOLN | EOTC |
| 158 | LITTLETON | EOTC |
| 160 | LOWELL | EOTC |
| 163 | LYNN | EOTC |
| 164 | LYNNFIELD | EOTC |
| 165 | MALDEN | EOTC |
| 166 | MANCHESTER | EOTC |
| 167 | MANSFIELD | EOTC |
| 168 | MARBLEHEAD | EOTC |
| 170 | MARLBOROUGH | EOTC |
| 171 | MARSHFIELD | EOTC |
| 172 | MASHPEE | CAPE |
| 174 | MAYNARD | EOTC |
| 175 | MEDFIELD | EOTC |
| 176 | MEDFORD | MWRA |
| 177 | MEDWAY | EOTC |
| 178 | MELROSE | EOTC |
| 179 | MENDON | EOTC |
| 180 | MERRIMAC | EOTC |
| 181 | METHUEN | EOTC |
| 182 | MIDDLEBOROUGH | EOTC |
| 184 | MIDDLETON | EOTC |
| 185 | MILFORD | EOTC |
| 187 | MILLIS | EOTC |
| 188 | MILLVILLE | EOTC |
| 189 | MILTON | EOTC |
| 196 | NAHANT | EOTC |
| 198 | NATICK | EOTC |
| 199 | NEEDHAM | EOTC |
| 205 | NEWBURY | EOTC |
| 206 | NEWBURYPORT | EOTC |
| 207 | NEWTON | EOTC |
| 208 | NORFOLK | EOTC |
| 210 | NORTH ANDOVER | EOTC |
| 211 | NORTH ATTLEBOROUGH | EOTC |
| 213 | NORTH READING | EOTC |
| 215 | NORTHBOROUGH | EOTC |
| 216 | NORTHBRIDGE | EOTC |
| 218 | NORTON | EOTC |
| 219 | NORWELL | EOTC |
| 220 | NORWOOD | EOTC |
| 224 | ORLEANS | CAPE |
| 229 | PEABODY | EOTC |
| 231 | PEMBROKE | EOTC |
| 232 | PEPPERELL | EOTC |
| 238 | PLAINVILLE | EOTC |
| 239 | PLYMOUTH | EOTC |
| 240 | PLYMPTON | EOTC |
| 242 | PROVINCETOWN | CAPE |
| 243 | QUINCY | EOTC |
| 244 | RANDOLPH | EOTC |
| 245 | RAYNHAM | EOTC |
| 246 | READING | EOTC |
| 248 | REVERE | EOTC |
| 251 | ROCKLAND | EOTC |
| 252 | ROCKPORT | EOTC |
| 254 | ROWLEY | EOTC |
| 258 | SALEM | EOTC |
| 259 | SALISBURY | EOTC |
| 261 | SANDWICH | CAPE |
| 262 | SAUGUS | EOTC |
| 264 | SCITUATE | EOTC |
| 266 | SHARON | EOTC |
| 269 | SHERBORN | EOTC |
| 270 | SHIRLEY | EOTC |
| 274 | SOMERVILLE | MWRA |
| 277 | SOUTHBOROUGH | EOTC |
| 284 | STONEHAM | MWRA |
| 285 | STOUGHTON | EOTC |
| 286 | STOW | EOTC |
| 288 | SUDBURY | EOTC |
| 291 | SWAMPSCOTT | EOTC |
| 293 | TAUNTON | EOTC |
| 295 | TEWKSBURY | EOTC |
| 298 | TOPSFIELD | EOTC |
| 300 | TRURO | CAPE |
| 301 | TYNGSBOROUGH | EOTC |
| 303 | UPTON | EOTC |
| 304 | UXBRIDGE | EOTC |
| 305 | WAKEFIELD | MWRA |
| 307 | WALPOLE | EOTC |
| 308 | WALTHAM | MWRA |
| 314 | WATERTOWN | EOTC |
| 315 | WAYLAND | EOTC |
| 317 | WELLESLEY | EOTC |
| 318 | WELLFLEET | CAPE |
| 320 | WENHAM | EOTC |
| 322 | WEST BRIDGEWATER | EOTC |
| 324 | WEST NEWBURY | EOTC |
| 328 | WESTBOROUGH | EOTC |
| 330 | WESTFORD | EOTC |
| 333 | WESTON | EOTC |
| 335 | WESTWOOD | EOTC |
| 336 | WEYMOUTH | EOTC |
| 338 | WHITMAN | EOTC |
| 342 | WILMINGTON | EOTC |
| 344 | WINCHESTER | MWRA |
| 346 | WINTHROP | EOTC |
| 347 | WOBURN | MWRA |
| 350 | WRENTHAM | EOTC |
| 351 | YARMOUTH | CAPE |
Land Use Status
The polygon attribute table for the LUSTAT_POLY coverage contains the following items:
| Field name | Description |
|---|---|
| TOWN-ID | Town-ID (1 - 351, from Municipalities Layer) |
| TOWN | Town name |
| ISLAND | 1 = Island polygon (a coastal water area sealed off from the ocean) |
| SRC_CODE | Code of organization that funded a pre-1999 data update (EOTC, MWRA, Cape Cod Commission) |
| LUYEAR | Date of most recent data (all currently are 1999) |
| LU_YR_PREV | Date of most recent previous data |
The Land Use Status Map displays the years for which land use data were interpreted.
Maintenance
MassGIS is maintaining this layer. Data available from MassGIS prior to March 31, 2005, used the old Land Use data model, in which only the most recent year was stored in the attribute table of the polygons, with older years' data in the history table. The current model stores the three years for which land use data are available statewide with the polygons, with the history table storing codes for years where interpretation was done only regionally.
MassGIS has produced Land Use Summary Statistics, by municipality, for all three years for which land use is available statewide. These tables summarize acreages for each land use type by year, as well as land use change from 1971 to 1985 and 1985 to 1999.
For newer land use data, see Land Use (2005).
| Date published: | January 1, 2002 |
|---|---|
| Last updated: | January 1, 2002 |