Downloads
Download these layers:
DEM (Floating Point Values) (IMAGINE file-2.8 GB)
DEM (Integer Values) (IMAGINE file-221 MB)
Shaded Relief Image (IMAGINE file-439 MB)
Breaklines and Mass Points (ESRI- FGDB file-493 MB)
Overview
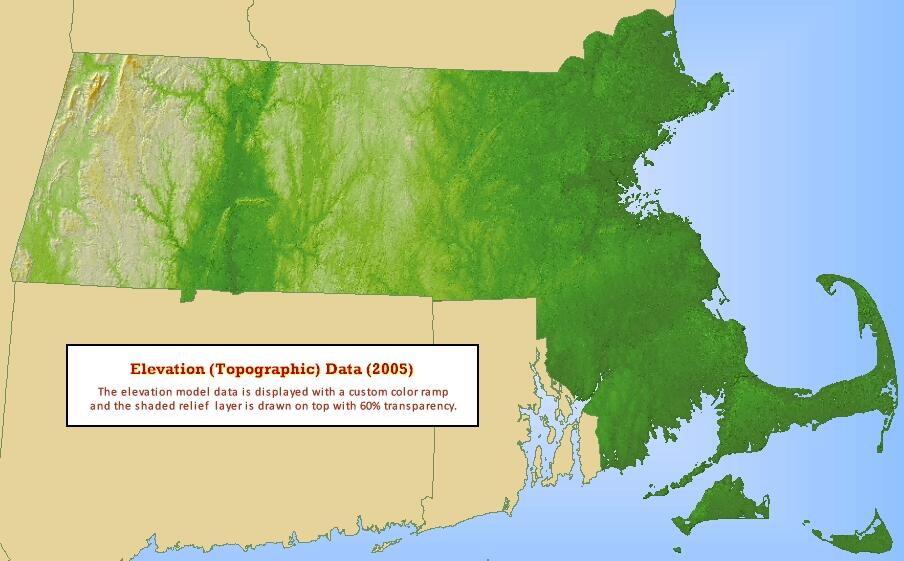
These data represent the "bare earth" elevation of the terrain surface without vegetation and artificial features. As a requirement for the orthorectification process of the 2005 Aerial Imagery, elevation points were compiled photogrammetrically by human operators from imagery acquired by Sanborn, Inc. in April 2005. The shape of the bare earth terrain is represented by irregularly spaced mass points, as well as by hard breaklines and soft breaklines. The spatial distribution of mass points and breaklines varies with surface roughness and compilation style. These data are described below.
Elevation measurements are referenced horizontally to Massachusetts State Plane NAD83 meters and vertically to NAVD88. These data capture more detail, and are more accurate and precise than is necessary to simply orthorectify the aerial imagery.
Data were processed using Leica ERDAS Imagine 9.1 and ESRI ArcGIS 9.2.
Because of tidal variations along the coast at the times of image acquisition, features subject to tidal waters with elevations less than mean sea level may have been submerged, and were therefore not visible. A continuous “zero elevation” breakline at the coast was created. MassGIS has maintained the integrity and continuity of this breakline. Data for Nomans Land and Muskeget were not delivered and 1990s elevation data were substituted in these areas in order to provide full coverage.
The elevation data were delivered in the form of text files with a pair of files (*.lin for lines and *.pnt for points) corresponding to each tile in the MassGIS Digital Orthophoto Index. Each record in these files denotes a measured location on the modeled terrain surface: x/y/z. The format of the text data files was modified in order to create point and line shapefiles in ArcGIS. MassGIS created 3D mass point and hard and soft breakline shapefiles directly from the text files. All shapefiles of each type were merged to create seamless statewide shapefiles.
Production
The original data files contain a Digital Terrain Model (DTM) consisting of mass points and breaklines in ESRI line and point ASCII file format. The data covers the commonwealth of Massachusetts and was generated using photogrammetric mapping techniques from digital camera imagery acquired in April 2005. The DTM adheres to an accuracy using the NSSDA standard of 2 meters at the 95% confidence level, assuming a normal distribution of errors. The ground control used to support the mapping was collected by photographic identification of strategic points and via GPS ground survey techniques. Aerial Triangulation was performed on softcopy workstations using Intergraph ISAT software for photo measurement and matching. The final bundle adjustment was performed using BINGO 5.2 software. The new DTM model was stereo compiled for the entire State from the newly acquired 2005 imagery. The DTM includes mass points, soft breaklines and hard breaklines.
Supplemental_Information: The source imagery was acquired with a Vexcel Ultracam camera at a flying height of 5,070 meters above mean terrain and an approximate pixel resolution of 45 cm. The coordinate system is NAD83 (horizontal) Massachusetts State Plane and NAVD (vertical) Meters. A Digital Terrain Model (DTM) consists of a collection of breaklines, which are supplemented with a dense network of accurately placed mass points. Breaklines may include manmade features such as paved roads, curbs, paved parking, paved driveways, paved alleys, retaining walls, concrete drains. Other breaklines may include lakes, rivers, drains, paved shoulders and gravel roads. Elevations within a lake or pond represent the value of the bottom quartile of elevations on the lake surface, or the value of the lowest elevation measured along the lake shore. Elevations at the seacoast represent a continuous breakline representing the lowest measurable shoreline elevation. The elevation of the breakline may be higher or lower than 0.0 (zero) meters depending on the stage of the tide at the time of image acquisition. This DTM was generated using standard sampling techniques in a fully stereo photogrammetric environment, and utilizing First Order analytical stereo plotters. Overall average density spacing of the mass points is 100 meters apart. The density of mass points and other terrain-defining elements depends upon the map the complexity and ruggedness of the terrain. Sanborn Map Company of Colorado Springs, CO did this work.
The elevation data was delivered to MassGIS in the form of text files with a pair of files (*.lin for lines and *.pnt for points) corresponding to each tile in the MassGIS ortho quad tiling scheme. Each record in these files denotes a measured location on the modeled terrain surface: x/y/z. The format of the text data files was modified in order to create point and line shapefiles in ArcGIS. MassGIS created 3D mass point, hard and soft breakline shapefiles directly from the text files. All shapefiles of each type were merged to create seamless statewide shapefiles. In order to preserve the precise locations of small features, triangulated irregular networks (TINs) were created from the irregularly spaced points and lines in the shapefiles. Gridded models with uniformly spaced values were derived from the measured values in the TINs by estimating the terrain elevation at the centers of each raster cell. Linear interpolation insures that the elevation values of the grid cells adhere closely to the values of the input data points, and that the range of values in the raster is restricted to the range of values in the input data. TINs were made larger than each raster in order to insure correct interpolation along each raster edge. The gridded model is a less accurate representation of the terrain than the TIN, but it is much easier to store and manipulate in a GIS. It is appropriate for relatively small-scale applications where positional accuracy is not a primary concern. A cell size of 5 meters is small enough to capture most details, but large enough so that analysis can be performed relatively quickly and efficiently. The gridded datasets were merged into one large .img file in Massachusetts State Plane (NAD83) projection, with 32-bit floating point elevation values and two decimal places represented.
Data Formats
Raster/Gridded Form
In order to preserve the precise locations of small features, triangulated irregular networks (TINs) were created from the irregularly spaced points and lines in the shapefiles. Gridded models with uniformly spaced values were derived from the measured values in the TINs by estimating the terrain elevation at the centers of each raster cell. Linear interpolation ensures that the elevation values of the grid cells adhere closely to the values of the input data points, and that the range of values in the raster is restricted to the range of values in the input data. TINs were made larger than each raster in order to ensure correct interpolation along each raster edge.
Because of the interpolation process, the gridded model is a less accurate representation of the terrain than the TIN, but it is much easier to store and manipulate in a GIS. It is appropriate for relatively small-scale applications where positional accuracy is not a primary concern. The cell size of 5 meters is small enough to capture most details, but large enough so that analysis can be performed relatively quickly and efficiently. The gridded datasets were merged into one large Imagine (.img) file in Massachusetts State Plane (NAD83) projection, with 32-bit floating point elevation values and two decimal places represented. The floating point raster dataset is named IMG_ELEV2005_FP.
In addition, an integer version was created. The elevation values have been rounded to nearest integer, and are represented by signed 16 bit integer values. The integer elevation raster dataset is named IMG_ELEV2005_INT.
Shaded Relief
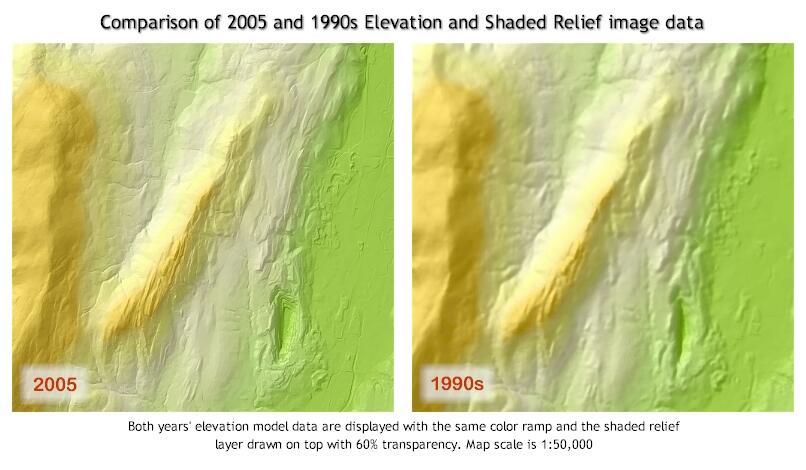
This monochromatic image dataset was generated from the elevation surface so that for a specific position of the sun, the values in the image represent the amount of light theoretically reflected to a position directly above the scene.
The position of the sun was chosen as follows:
- Solar azimuth: 315 degrees measured clockwise from due north (northwest).
- Solar elevation: 45 degrees above the horizon.
Slopes that face the direction of the sun appear highlighted and slopes that face away from the sun appear in darker shades. The data values have been scaled so that a value of 1 represents zero light reflectance, and a value of 255 represents maximum light reflectance. Shaded relief images are used in analysis, as well as making it easier visually to interpret slope, aspect, and changes in elevation. Shadows are not modeled.
The layer is named IMG_SHADEDRELIEF2005.
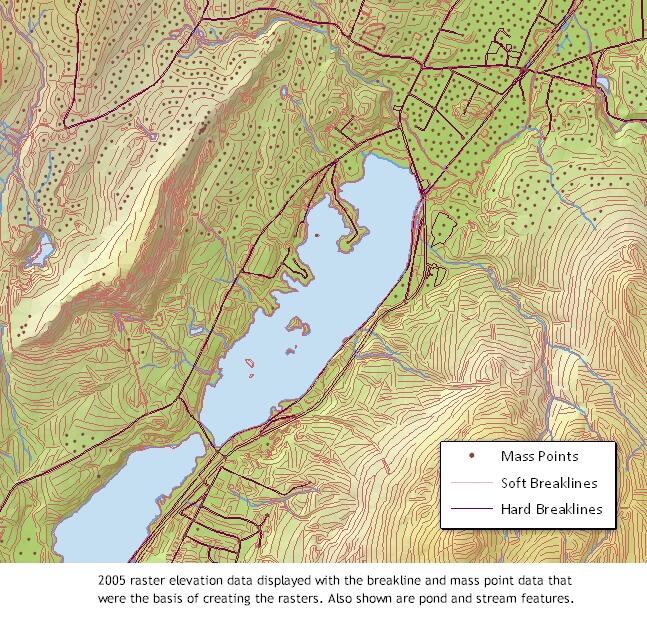
Breaklines and Mass Points

Mass points represent spot elevations, and linear features are delineated with breaklines indicating a change in the smoothness of the surface. Soft breaklines maintain known elevation values along linear features, but do not represent an interruption in the smoothness of the surface. Hard breaklines define an abrupt change in surface smoothness. Elevations of lakes and rivers are elevations of the water surface at the time of image acquisition.
As mentioned above, MassGIS created 3D mass point, hard and soft breakline shapefiles directly from the text files delivered by Sanborn. In addition, MassGIS created a 2D version of the mass points with the Z (elevation) value in the point feature attribute table. The 3D layer does not include this; rather the Z values are stored as part of the layer's geometry (appearing as "Point ZM" in the SHAPE field) and may be displayed in ArcScene in a three-dimensional view.
The mass point layers are named ELEVATIONS2005MASS_PT (2D version) and ELEVATIONS2005MASS_PTZ (3D version). The 2D version has the ELEV attribute, which stores elevation in meters above and below sea level.
The breakline layers are Polyline ZM feature types, allowing for three-dimensional display in ArcScene. These line layers are named BRKLN2005HARD_ARC and BRKLN2005SOFT_ARC. Neither layer has any attributes.
Maintenance
No updates are planned for these data. Any questions about the data and processing methods should be directed to Philip John at philip.john@mass.gov
Also see the statewide LiDAR Terrain Data.
| Date published: | April 1, 2005 |
|---|---|
| Last updated: | April 1, 2005 |