
Overview

Lidar flight area for Central and Eastern MA
Detailed elevation mapping (at Quality Level 1) for most of the Eastern half of Massachusetts was completed using Lidar data acquired in the spring of 2021. With that acquisition, all of Eastern Massachusetts has a single consistent elevation dataset. Products derived from the 2021 acquisition include topographic contours with a one-foot interval. The 2021 acquisition was funded with a grant from the US Geological Survey’s 3D Elevation Program. Grant matching funds were provided by the Executive Office of Technology and Security Services, the Executive Office of Energy and Environmental Affairs, MassDOT, and the Cape Cod Commission.
USGS contracted NV5 Geospatial (NV5) in the spring of 2021 to produce highly detailed elevation mapping for an area of 5,246 square miles. Elevation mapping in Eastern Massachusetts had previously been a patchwork of numerous projects with varying levels of accuracy.
Several older (2013-2015) QL1 and QL2 delivery areas, plus 2018 QL2 data from the town of Nantucket, have been added to this QL1 data to provide high quality statewide coverage, which collectively we are calling the “Latest and Best Lidar Terrain Data.”
| Year / Project Name | Acquisition Dates | Projection / Units | DEM Size / Resolution | LAS Point Size | Full Metadata |
|---|---|---|---|---|---|
| 2021 Central-Eastern Mass. | Spring 2021 | NAD 1983 2011 UTM Zone 19N / Meters | 200 GB / 0.5 m (.tif) | 7.3 TB | See below |
These data can be used for emergency response, drainage studies and hydrologic / floodplain modeling, development suitability analysis and infrastructure planning, identification of structures and other man-made features, habitat classification, vegetation mapping, and many other purposes.
Want to learn more about lidar?
>> View an interesting, simply presented explanation of Lidar and its fascinating uses.
Other Project Areas

In an effort to create statewide coverage of high quality (QL1 and QL2), areas that are not covered by the 2021 (QL1) acquisition described above are included as part of the "latest and best" collection of lidar data:
- 2018 Nantucket (QL2) - covers the entirety of Nantucket Island and was acquired in the Spring of 2018 by the Town of Nantucket. See the NOAA Point Cloud page for details.
- 2015 Massachusetts - QL1 covers some of the Westfield and Deerfield Watersheds, and most of the Connecticut Watershed. QL2 covers the rest of Western Massachusetts. All data acquired in Spring and Fall of 2015 in UTM Zone 18 NAD83 (2011)/NAVD88 Meters.
- 2013-2014 Sandy (QL2) - covers roughly the western third of Worcester County acquired in the Fall of 2013 and Spring of 2014 after Hurricane Sandy in UTM Zone 18 NAD83 (2011)/NAVD88 Meters.
The following table summarizes data for the projects and contains links to download full project-specific metadata:
| Year / Project Name | Acquisition Dates | Projection / Units | ** DEM Size / Resolution | ** LAS Point Size | * Full Metadata |
|---|---|---|---|---|---|
| 2018 Nantucket | Spring 2018 | NAD 1983 2011 Mass. State Plane Island Zone / Feet | 10 GB / 1 ft (.tif) | 7.5 GB | ZIP (1 MB) |
| 2015 Massachusetts | Spring & Fall 2015 | UTM Zone 18N & 19N / Meters | 21 GB 1 m (.img) | 600 GB | ZIP 163 MB |
| 2013-2014 Sandy | Fall 2013 & Spring 2014 | UTM Zone 18N & 19N / Meters | 4.67 GB 1 m (.img) | 121 GB | ZIP 2 MB |
* Metadata .ZIP files include an overview text file and various documentation (PDFs, Word docs, and text files on acquisition, processing, QA, etc.) as delivered to MassGIS. Metadata varies by project area.
** DEM and Point file sizes represent the sum of all files as bzip2 or laz compressed archives for a project area and are provided to aid in downloading the data. The data file sizes will be larger when uncompressed, which is necessary in order to use the files in GIS and other software. Files sizes of individual rasters differ among and within project areas.
Products, Downloads and Web Services
DEM and LAS
The following products are available for download:
Digital Elevation Model (DEM)
- 14,912 "small" tiles: 32-bit floating point, 0.5 or 1 meter resolution, ERDAS IMAGINE (.IMG) or Tiff format (varies by project area). Images for Nantucket have a 1 foot resolution. The images are based on this tile index.
- 31 regional tiles: 16-bit signed integer, 0.5 meter resolution, ERDAS IMAGINE (.IMG) format; pixels have both meters and feet values. The images are organized based on this tile index. Offshore areas are clipped, with background areas set to have a pixel value of 1099.
- Statewide: 16-bit signed integer, 0.5 meter resolution, JPEG 2000 (.jp2) format; pixels have both meters and feet values. This was created as a mosaic from the 31 regional tiles.
DEM tiles download instructions:
- Open MassMapper and use the Identify tools to select your area of interest.
- In the Identify results box click on the layer 'Latest and Best Lidar Index'. The Feature details section will display the link for each tile you selected. Click on each link to download a .zip file containing the DEM.
- To download many images in a more automated way, click the 'Save all records as' dropdown and save to an Excel file. Then:
- Open Excel or a similar spreadsheet program, copy only the cells with the links and paste them into Notepad or other text editor and save as a text file.
- Download the free WinWGet software and load the text file into a new job. Run the job and all the zipped images will be downloaded to a folder you choose.
The illustrated instructions on the download process for the Lidar DEMs are identical as those for the 2019 Aerial Imagery.
LAS
For LAS point cloud data, the link below points to the NOAA Data Access Viewer. LAS is a file format for the interchange of 3-dimensional point cloud data. Data downloads may be in the zipped .LAZ format. Here are the steps to download data for a custom area of interest:
- On the NOAA site, draw a box for your area of interest. A list of results with appear in the right-hand pane.
- Click the cart button in the result listing for the data you want to download (e.g. "2021 USGS Lidar: Central Eastern Massachusetts") to add that item to your cart.
- Draw boxes for other areas of interest if needed and add them to your cart.
- Click the blue cart button in the upper right (it will have a green circle indicating the number of items in your cart) and click 'Next'.
- In the Lidar > Output Options section, select your desired Output Product (e.g., "Point") and Output Format (e.g., "Points - LAS"). You can also choose raster formats. ** You need to do this for each item in your cart. **
- Follow the prompts to submit the request.
- You will receive an email with a link to the data containing all the points (or rasters) that fall within your area of interest.
Optionally, you can click the "BULK DOWNLOAD" link in the result to access full file listings, but you will need to determine which files to download based on the Lidar Index layer.
Once downloaded, extract the contents from the .zip file(s). LAS files may be added directly to software like ArcGIS Pro, ArcMap and QGIS, among others. In Arc programs, you can add individual LAS files to a LAS dataset.
Derived Raster Products
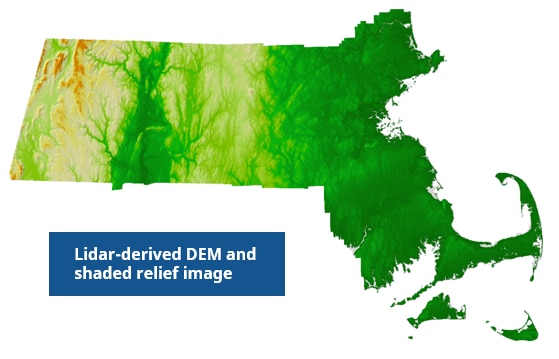
From the lidar DEM, MassGIS created the following statewide image products:
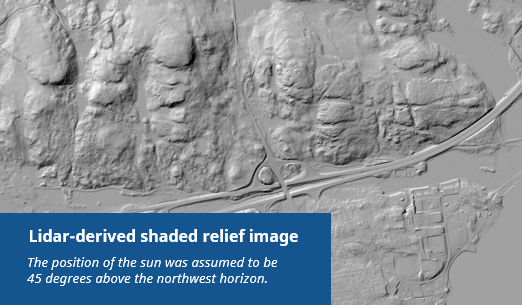
Shaded Relief
- The shaded relief image was generated from a half-meter lidar-based bare-earth DEM. A shaded relief image provides an illustration of variations in elevation using artificial shadows. Based on a specified position of the sun, areas that would be in sunlight are highlighted and areas that would be in shadow are shaded. In this instance, the position of the sun was assumed to be 45 degrees above the northwest horizon. The shaded relief image shows areas that are not in direct sunlight as shadowed. It does not show shadows that would be cast by topographic features onto the surrounding surface.
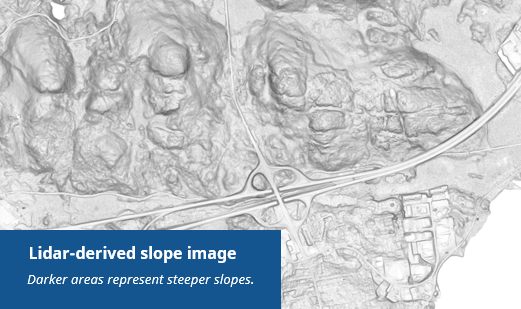
Slope
- The slope image shows the variation in elevation (steepness), expressed in degrees (0 is flat, 89 is nearly vertical). A 3X3 window was used to calculate the slope at each pixel. MassGIS is distributing a statewide half-meter JPEG 2000 image with NoData background value of 91. A web tile service is also available.
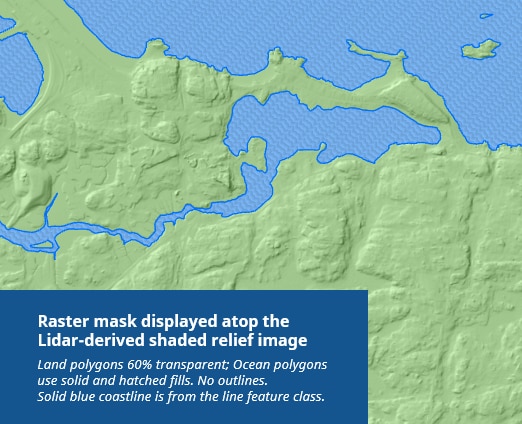
In producing the derived raster products, MassGIS masked the ocean so that they would have a cartographically pleasing, smoother coastline. The coastline portion of the mask was generated from "Waters Edge" breaklines delivered with the Central-Eastern lidar data. The outer land extent was based on the pixels themselves. Once a line feature class was complete, it was converted to polygons, and the polygons were split for better spatial indexing and faster display. The line feature class contains only a coastline and the outer edges of the raster.
1-Foot Vector Contours
MassGIS created 1-foot contour lines from the 2021 Central and Eastern MA lidar point data. See the 1-foot contours metadata for details and links to data download.
Technical details of the new USGS 3DEP Central Eastern Massachusetts Lidar
The 8 Terabytes of lidar data were delivered to MassGIS in 6,038 square tiles.
| Item | Description |
|---|---|
| Vertical accuracy RMSEz: | 10 cm |
| Nominal pulse spacing: | Less than or equal to 0.35 meter/Greater than or equal to 8 points per sq. meter |
| DEM cell size: | 0.5 meter |
| Horizontal Projection: | NAD83(2011)/UTM zone 19N |
| Horizontal Datum: | NAD83 (NSRS 2011) |
| Horizontal Units: | meters |
| Vertical Datum: | NAVD88 – Geoid18 (m) |
| Vertical Units: | meters |
See also: 3DEP Lidar Base Specification
For detailed information about acquisition, processing, and accuracy of these data see: Central_East_MA_NIR_lidar_Report.pdf
Classified Point Cloud (LAS 1.4)
ASPRS LAS Classifications Applied in This Project:
| Class | Description |
|---|---|
| 0 | Created, Never Classified |
| 1 | Default/Unclassified |
| 2 | Ground |
| 3 | Low Vegetation |
| 4 | Medium Vegetation |
| 5 | High Vegetation |
| 6 | Building |
| 7 | Low Noise (Withheld) |
| 8 | Water |
| 17 | Bridge |
| 18 | High Noise (Withheld) |
| 20 | Ignored Ground |
| 22 | Temporal Exclusion |
The LAS data files include all data points that were collected. No points were removed or excluded.

Lidar point cloud classes: Ground, Building, and Low, Medium, and High Vegetation
Building Classification
Buildings were classified using an automated algorithm which was customized for the study area and data collection specifications. Manual review and cleanup of results was not within scope.
This project called for the classification of vegetation within certain height thresholds, which is done after building classification is complete, and is performed on all remaining unclassified data. This can result in some building walls and roof edges being incorrectly classified as vegetation. The automated building classification is useful in determining building locations as well as approximate building sizes and heights.
Bridge Classification
Bridge decks were removed from the ground model, classified to class 17 (bridge deck), and supplemented with bridge breaklines as necessary to prevent artificial triangulation from obscuring the ground below.
Vegetation Classification
Lidar returns from vegetation were classified into three different height classes using automated routines:
- Low Vegetation: 0.5 – 2 meters
- Medium Vegetation: 2 – 5 meters
- High Vegetation: 5+ meters
This classification was the final classification routine on the point cloud dataset and was applied to all remaining unclassified points. Any additional features that were not correctly classified as building or bridge deck, including vehicles, fences, signs, etc. may be misclassified as low, medium, or high vegetation. Nevertheless, the vegetation classification provides valuable information.
Maintenance
MassGIS maintains this layer and will update it should new LiDAR data be acquired.
| Date published: | May 30, 2023 |
|---|---|
| Last updated: | May 30, 2023 |