
Authors: Courtney Cardello (Bureau of Accounts Public Finance Section) and Tony Rassias (Deputy Director of Accounts)
In the July 2026 edition of City & Town, the DLS Financial Management Resource Bureau authored an article on capital planning best practices. This accompanying article focuses on municipal debt, providing a statewide overview of trends in debt since the end of the Great Recession (December 2007 to June 2009) through June 30, 2025.
The data for this report comes from two sources, the Schedule A and the Statement of Indebtedness (SOI). The Schedule A is a year-end statement of revenues and other financing sources, expenditures and other financing uses, changes in fund balances, certain balance sheet and other information. This Statement of Indebtedness is the annual report submitted by municipal treasurers reflecting complete and accurate records of indebtedness incurred by cities, towns and districts as required by G.L. Ch. 44, §28. Both the Schedule A and SOI are filed annually with DLS by municipalities on a non-audited basis. Also note that debt issued by a regional school district (RSD) is not accounted for in this report as members is not reported to the DLS Bureau of Accounts (BOA) and district members typically account for it as part of their total assessment, not separately as debt service.
Cities and towns may incur debt mostly under Massachusetts General Laws (G.L.) ch. 44 and ch. 70B (school construction). The debt/borrowing section of our Training & Resource Center provides a large library of materials on the subject. There are two types of debt, long-term and short-term. Long-term debt involves an instrument (“bond”) in which the issuer promises to repay principal and interest to the buyer by a specified future date determined by a debt schedule, and a promise to complete payment by the date of maturity (“maturity date”), typically greater than one year. Short-term debt is aloan in anticipation of a particular revenue source with an instrument (“note”) in which the issuer promises to pay the buyer the note amount at a specified time, typically one year or less. The graph below shows total municipal debt balances reported as of June 30theach fiscal year since the official end of the Great Recession in June of 2009, through FY2025.
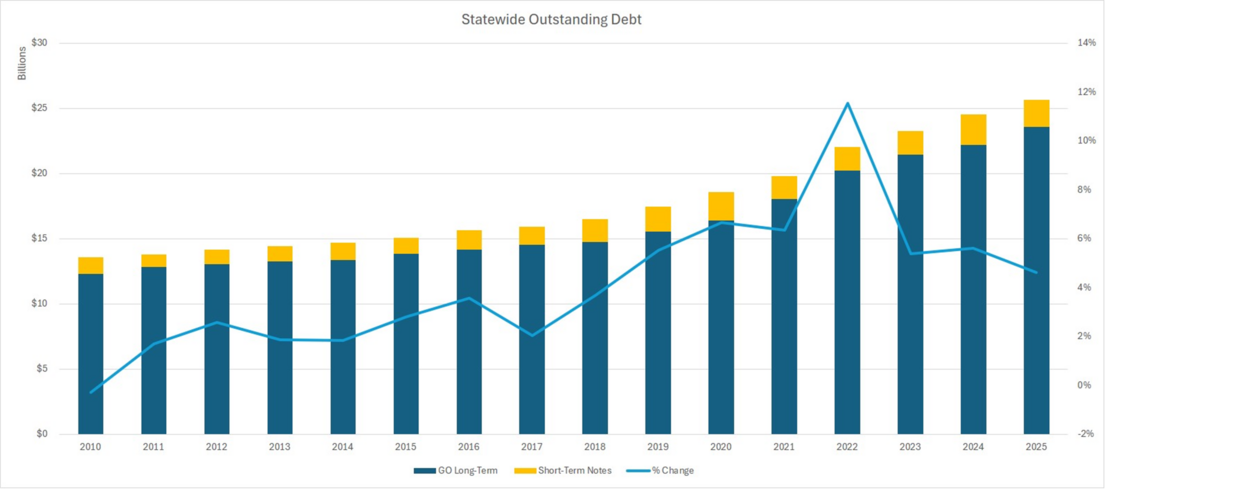
Since FY11, outstanding debt has increased each FY, with the range being approximately 2%-3.5% between FY11 and FY17, then increasing to between approximately 4%-6.5% between FY18 and FY25. One notable exception was FY22, when outstanding debt increased more than 11%, driven, in part, by large school construction projects and the issuance of pension obligation bonds (POB’s) by a few communities as allowed by special legislation.
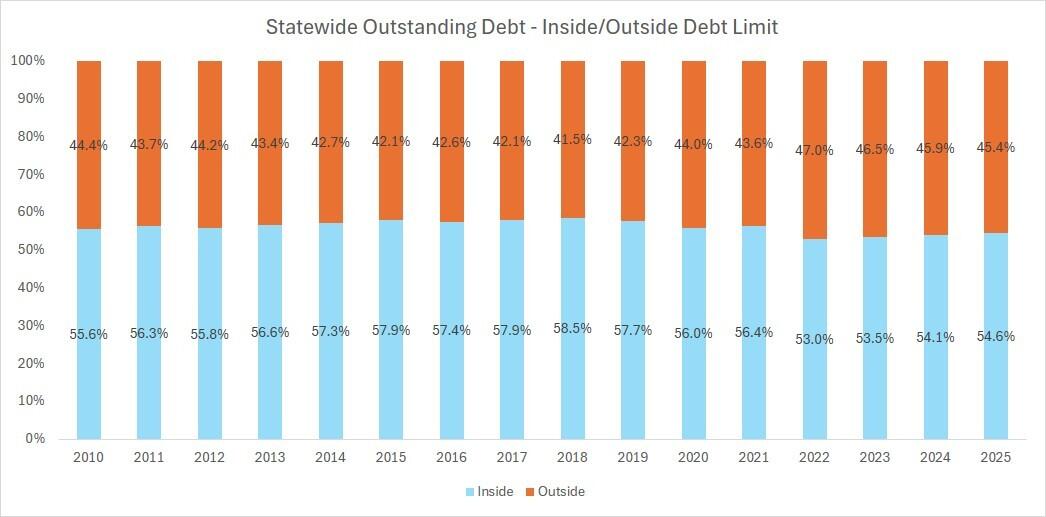
Known as the Debt Limit, G.L. c. 44, § 10 states that debt authorized by cities and towns under certain sections of law, primarily G.L. c. 44, § 7, cannot be authorized in total in excess of 5% of their most recent Equalized Valuation (EQV), or not in excess of 10% of the EQV if approved by the Municipal Finance Oversight Board (MFOB). Not all debt is subject to the limit: G.L. c. 44, § 8, and G.L. c. 70B provide for debt issued for certain reasons to be outside the debt limit. Examples of “outside the debt limit” include school projects partially funded by the Massachusetts School Building Authority (MSBA), landfill capping and large water/sewer projects.
The following graph categorizes this data between inside and outside the debt limit. As it shows, the majority of the debt is inside the debt limit and the split has been relatively consistent over the data set (roughly 55%/45% split).
The next graph shows the purposes for which long-term debt was issued during the same period.
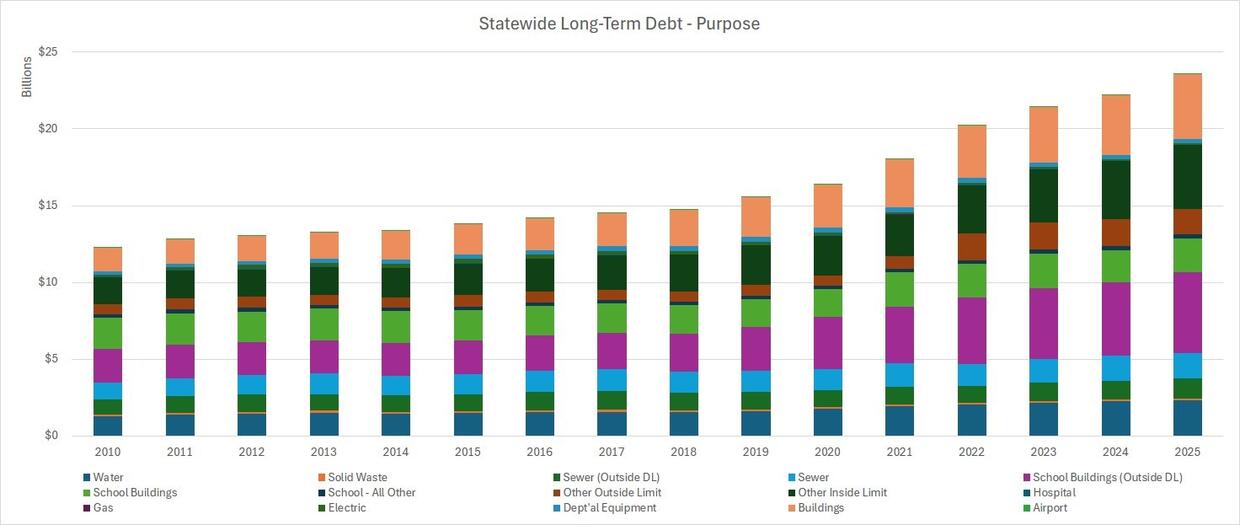
The above graph shows that the increase has been driven by school and municipal building projects, which have increased $3B (136%) and $2.7B (175%), respectively. In addition, the Other Inside Limit category, which may include Pension Obligation Bonds, Highway and Other Roadwork projects, grew $2.4B (136%) and Water increased $1.1B (84%).
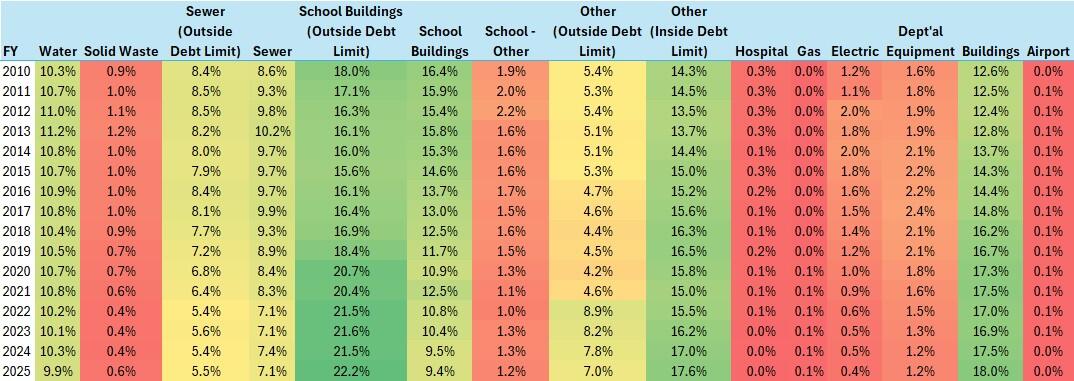
The following table shows each category as a percent of total outstanding long-term debt. To summarize:
- School Buildings outside the debt limit comprise the largest share total /outstanding long-term debt (22.2%), followed by Buildings (municipal facilities) (18%) and Other Inside Limit (17.6%).
- School Buildings outside the debt limit have grown from 18% of total outstanding long-term debt to 22.2%.
- Buildings (municipal facilities) have increased from 12.6% to 18%.
- Other Inside Limit has increased from 14.3% to 17.6%.
Debt that has been authorized by the appropriate municipal authority does not have to be issued in its entirety all at once. The capital needs of the project may be such or a change of commitment toward a capital project may leave authorized debt unissued. For example, if $50 million was authorized for a project and $30 million was issued for the first phase of the project, $20 million is authorized/unissued. At some time in the future, however, that $20 million may still be issued as long term debt.
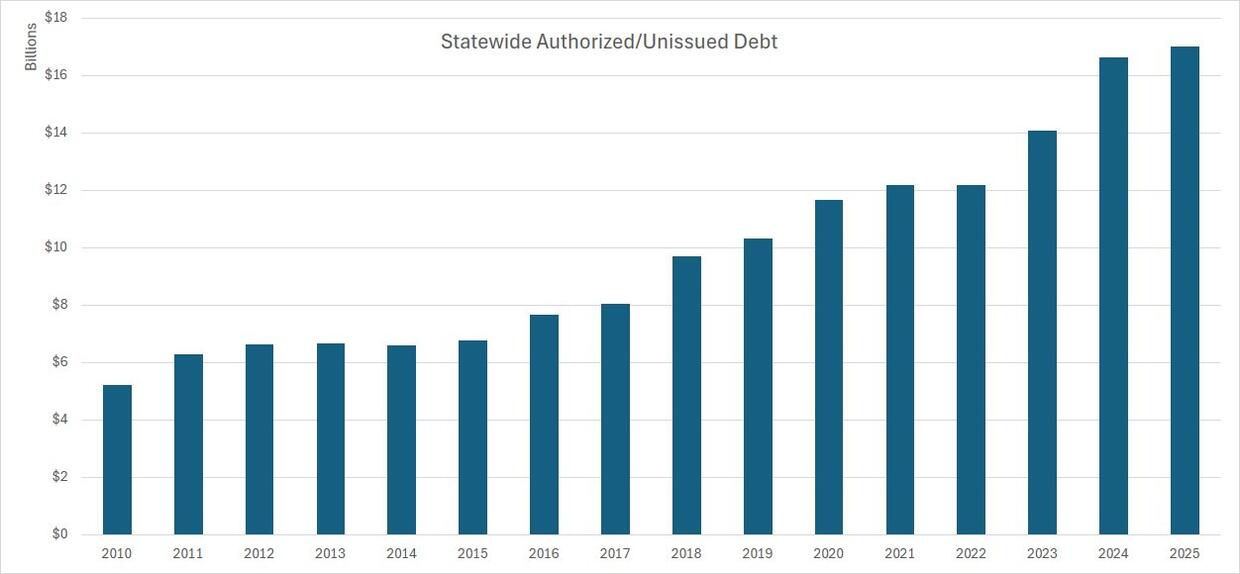
In addition to the existing outstanding debt shown above, there is a total of $17B in authorized/unissued debt. As shown in the following table, the amount has increased significantly since FY2010, when there was $5B of authorized/unissued debt. Some of this growth is due to the increase in the cost of MSBA-supported school projects: municipalities are required to get a bond authorization for the total cost of the project, not just their share. For example, if the project is $200M and the MSBA reimburses 50% of the cost, then $100M of the $200M bond authorization is included as authorized/unissued. The bond authorization vote approved by the local legislative body includes language that the amount authorized will be reduced by the amount received by the MSBA. Therefore, using this example, the $100M will ultimately not be included in the authorized/unissued once all MSBA reimbursements are received and the remaining debt authorization is automatically rescinded.
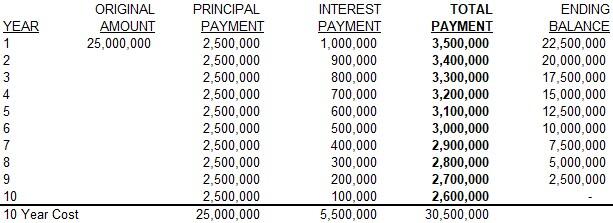
Once bonds are issued on a long-term basis, they must be paid back annually on a schedule agreed upon at issuance. Known as debt service, this is the annual payment of principal and interest owed by the municipality. Below is an example of a debt service schedule for a $25M bond with a 10-year amortization schedule and a 4% interest rate, using a level-principal structure. (Note that debt can also be issued on a level debt service basis, where the payments are structured so that the annual debt service is the same for the life of the bond. See DLS Tools & Template to download a debt service calculator.) In the following example, debt service in the first year is $3.5M and it declines annually until it reaches $2.6M in the final year.
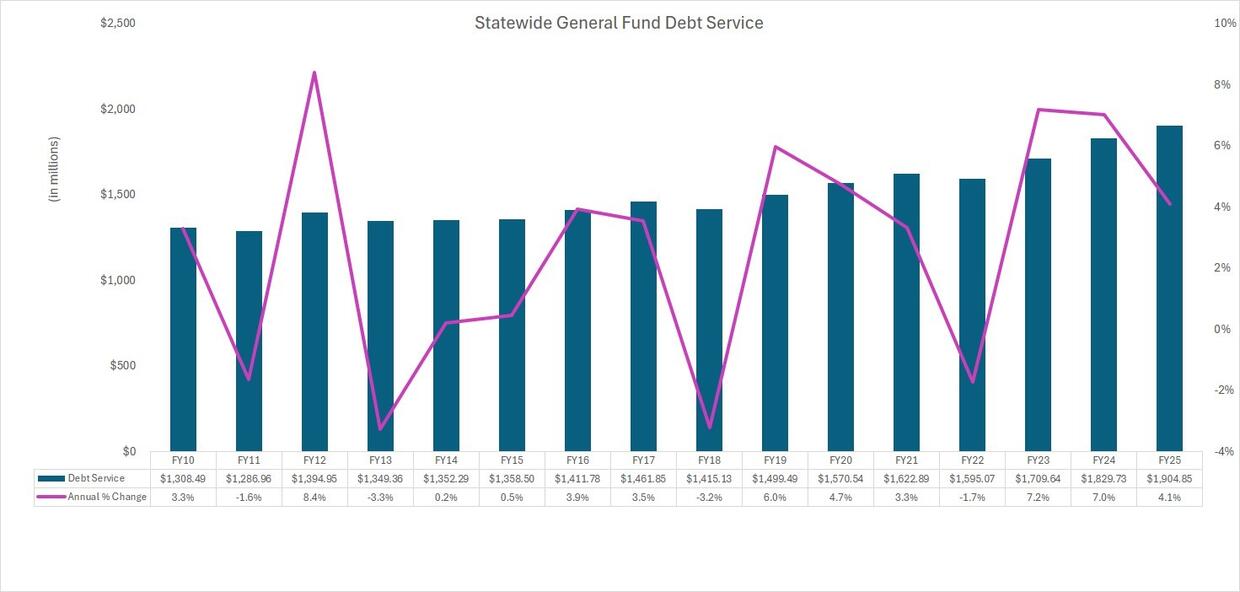
The graph below shows total statewide general fund debt service. As it shows over this time period, general fund debt service has increased from $1.3B to $1.9B, or 46%.
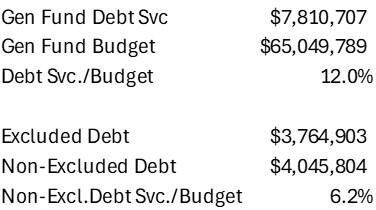
Debt service as a percent of budget is a common metric used to measure the impact of debt service on a community’s budget. Low percentages could indicate an under-investment in a community’s infrastructure whereas a high percentage could indicate budgetary pressure that potentially crowds out the ability to provide services. Somewhat complicating this metric for Massachusetts municipalities is how, under Proposition 2 ½, debt service can essentially be funded with a dedicated revenue stream (additional property taxes) via a Debt Exclusion. Because of this, a municipality could have a high debt service as a percent of budget but, since most is covered via a Debt Exclusion(s), the amount of “pressure” on the budget is much lower. For example, take the following community: the standard measure for this community shows 12% of the budget consisting of debt service; however, when debt service associated with Debt Exclusions is backed out, the metric drops to 6.2%, a figure that is more is more in line with recommended debt service levels.
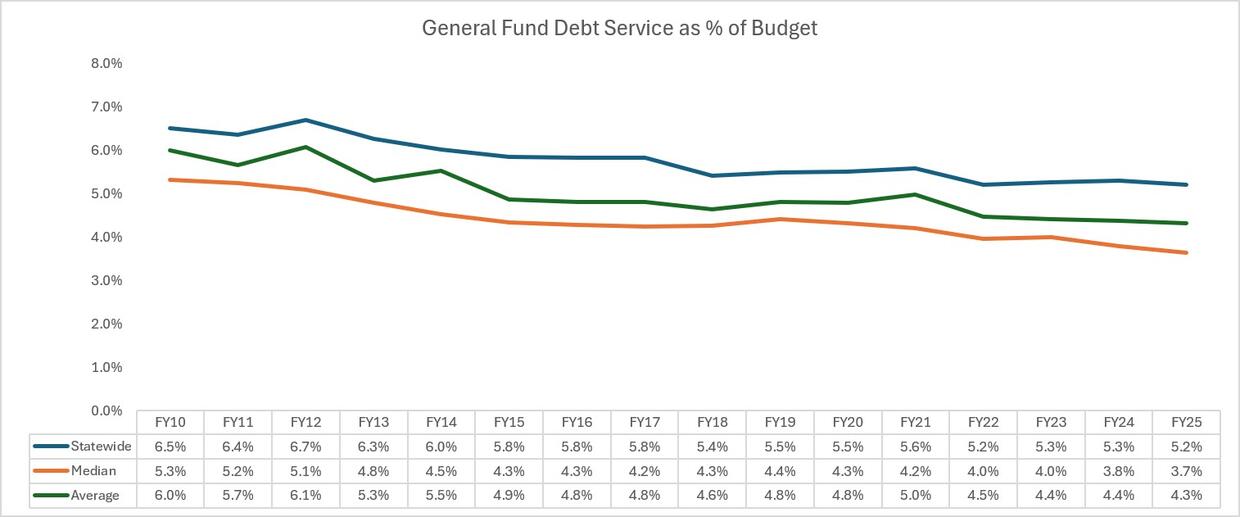
The following graph depicts this metric on a statewide basis. Each of the three measures used shows debt service as a percent of budget declining over time:
- the FY25 statewide figure (total statewide general fund debt service divided by total statewide general fund budgets) is 5.2%, an amount that has dropped by more than a percentage point over the data series (from 6.5% in FY10)
- the FY25 median is 3.7%, an amount that has dropped by more than 1.5 percentage points over the data series (from 5.3% in FY10)
- the FY25 average of each community is 4.3%, an amount that has dropped by close to 2 percentage points over the data series (from 6% in FY10)
Some of this reduction can be attributed to changes in accounting. For example, there are now more enterprise funds in use across the state, with debt service now accounted for in those funds rather in the general fund. Another reason is simple math: statewide general fund budgets have increased nearly twice as fast (82%) over this time period compared to the increase in debt service (46%).
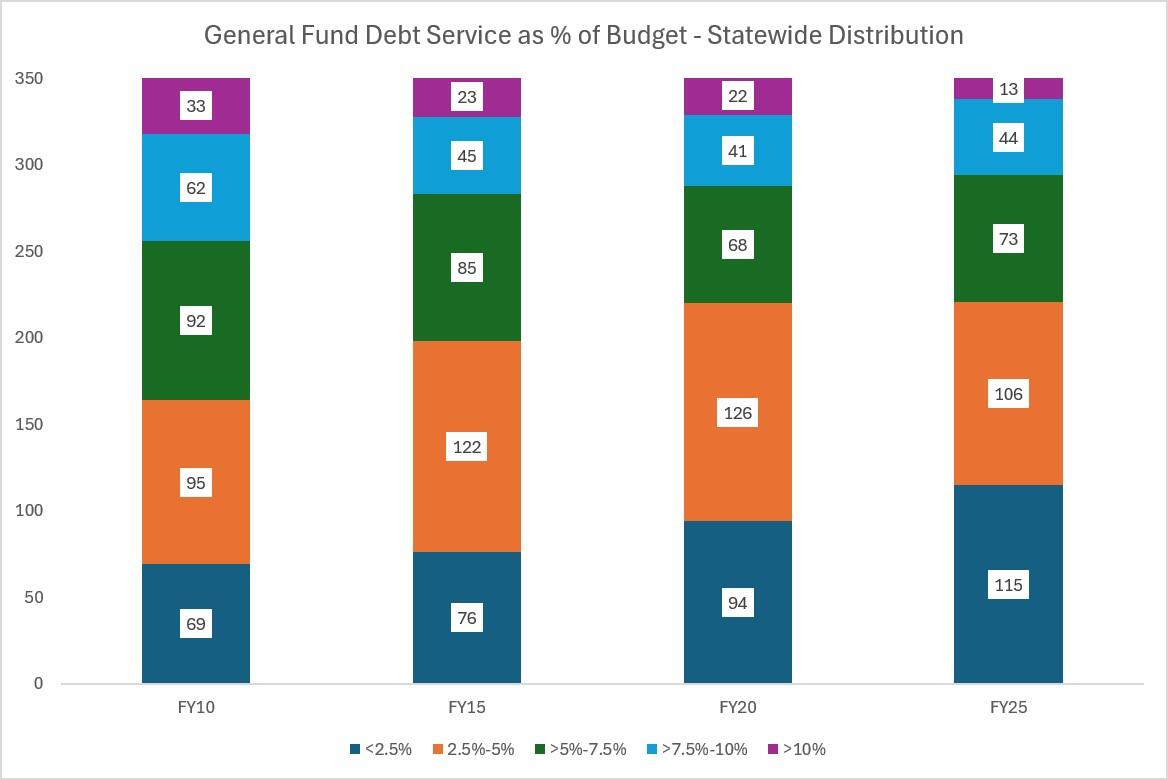
The next graph shows the distribution by range for four fiscal years, each five years apart. In FY25, the largest group was debt service equal to <2.5% of budget, with 115 municipalities falling into that range. The smallest was >10%, with only 13 municipalities in that group. It is notable that the distributions have changed significantly since FY10, with shifts from the higher levels to the lower levels:
- the >5% groups went from 187 (33+62+92) to 130 (13+44+73), a decrease of 30%
- <5% groups went from 164 (95+69) to 221 (106+115), an increase of 35%
The data used in this report is available in the DLS Databank. If you are interested in viewing this data for a specific community, the Municipal Finance Trend Dashboard includes a debt category with data for each of the 351 cities and towns. In addition, the Databank includes numerous debt-related reports.
Helpful Resources
City & Town is brought to you by:
Editor: Dan Bertrand
Editorial Board: Sean Cronin, Scott Ditto, Janie Dretler, Jessica Ferry, Christopher Ketchen, Paula King, Jen McAllister, Brianna Ortiz and Tony Rassias
| Date published: | October 1, 2026 |
|---|