New Growth is the dollar increase in the annual levy limit that reflects the additional tax revenue generated by new construction, renovations, and other increases in the property tax base during a calendar year. Proposition 2½ allows a municipality a 2½% annual increase to the levy limit restrictions imposed by MGL Ch. 59 §21C, but the levy limit also increases each year with the addition of New Growth as a standard part of the levy limit calculation. This additional increase to the levy limit is permitted based upon the valuation of new construction and other increases to the tax base that are not attributed to market value changes. It does not include value increases caused by normal market forces or by revaluations. For additional information on New Growth, you can read the following articles from the past couple of years including our two-part series (part 1 & part 2) on New Growth and our piece outlining the importance of understanding New Growth’s impact on a community’s fiscal well-being.
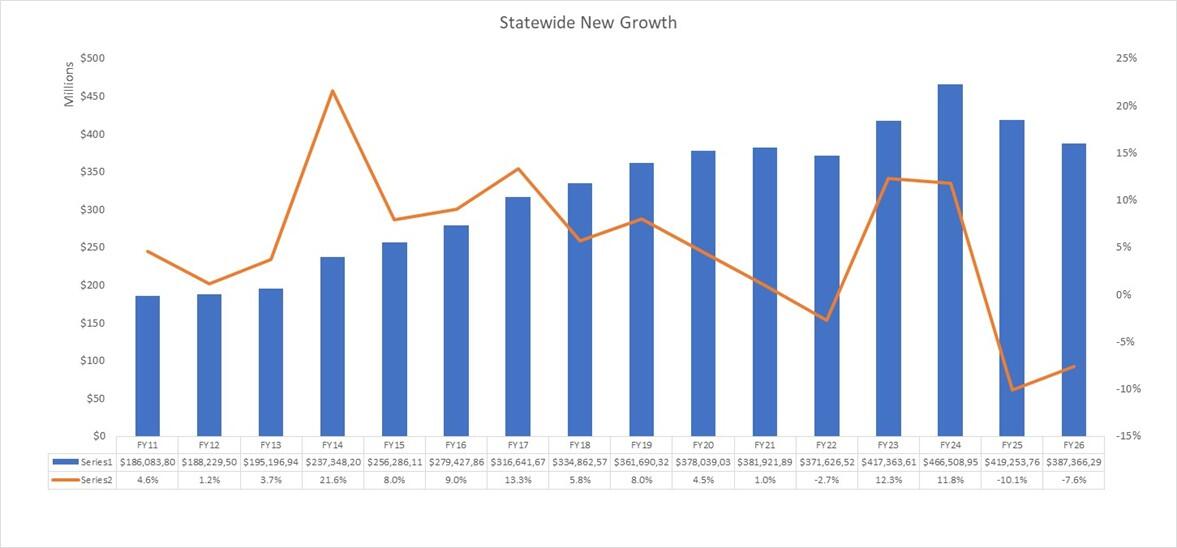
This article provides New Growth data and provides an analysis of recent trends in this important metric using data collected from 348 of Massachusetts’ 351 municipalities. FY2026 New Growth totaled $387.4M, a decrease of 7.6% ($31.9M) from FY2025. Of the decrease, more than 70% is attributable to Boston and Cambridge, who comprise approximately 30% of all New Growth each year. As shown in the graph below, this was the first time New Growth decreased in consecutive years:
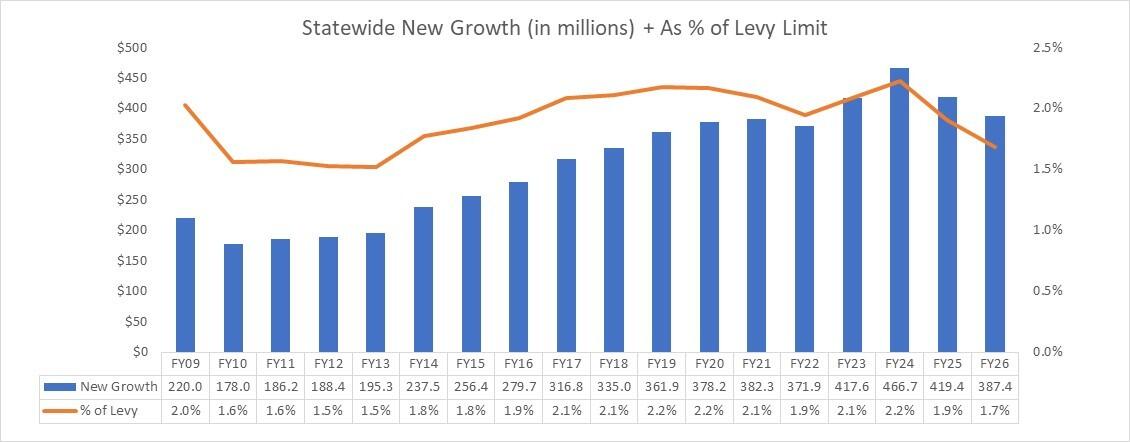
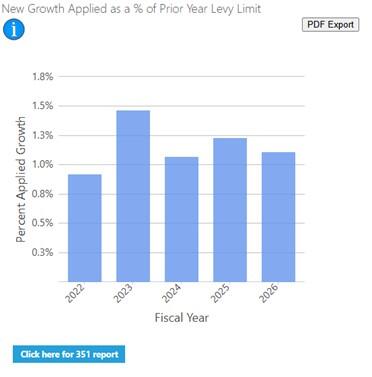
When measured as a percent of the prior year levy limit, the 1.7% in FY2026 was the lowest since the FY2010-2013 period, when it was between 1.5% - 1.6%. This is shown in the graph below.
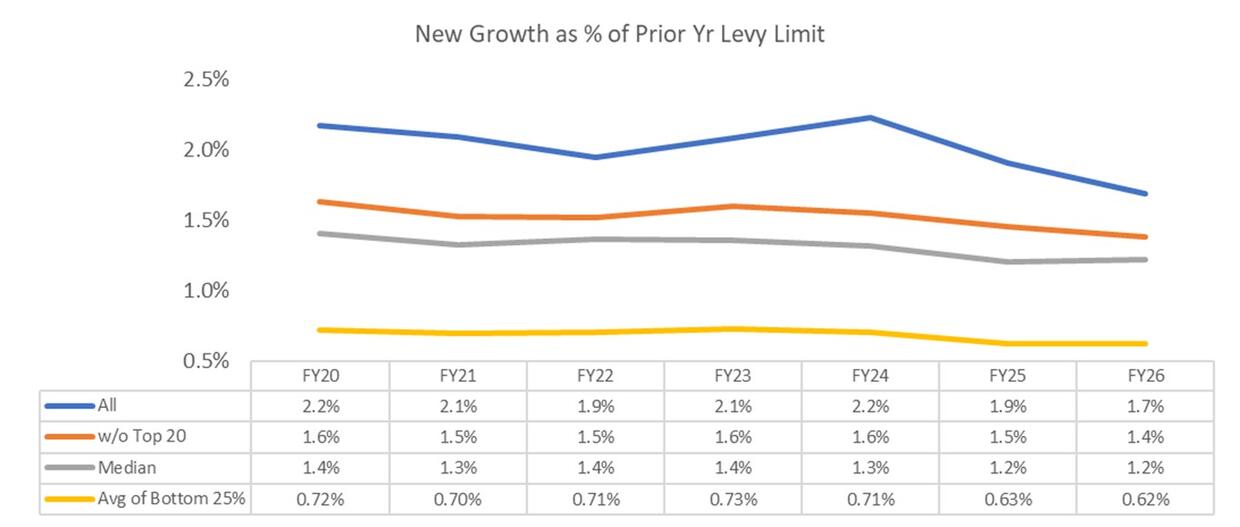
The top 20 municipalities in terms of New Growth generated comprise nearly 50% of all New Growth, so it can be helpful to analyze this data without those 20 cities and towns. The table below shows New Growth measured as a percent of the prior year levy limit without those municipalities. Doing so drops the metric from 1.7% in FY2026 to 1.4%. The graph also includes the statewide median, which is at 1.2% in FY2025. Lastly, for the municipalities in the bottom 25% in terms of total New Growth, the metric is 0.6%.
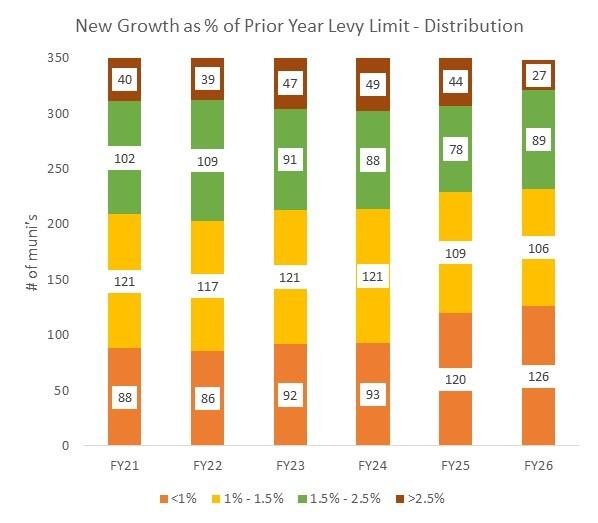
The next graph depicts the distribution, again measured as a percent of the prior year levy limit, by FY. It shows that there was a relatively consistent composition in the high range (greater than 2.5%), but a trend of an increase in the lowest range (less than 1%). This changed in FY2026, with only 27 municipalities in the high range. Looking at this data since FY21, it clearly indicates a shrinking at the high end (from 40 to 27) and an expansion at the low end (from 88 to 126). Two-thirds have this metric at being no more than 1.5%.
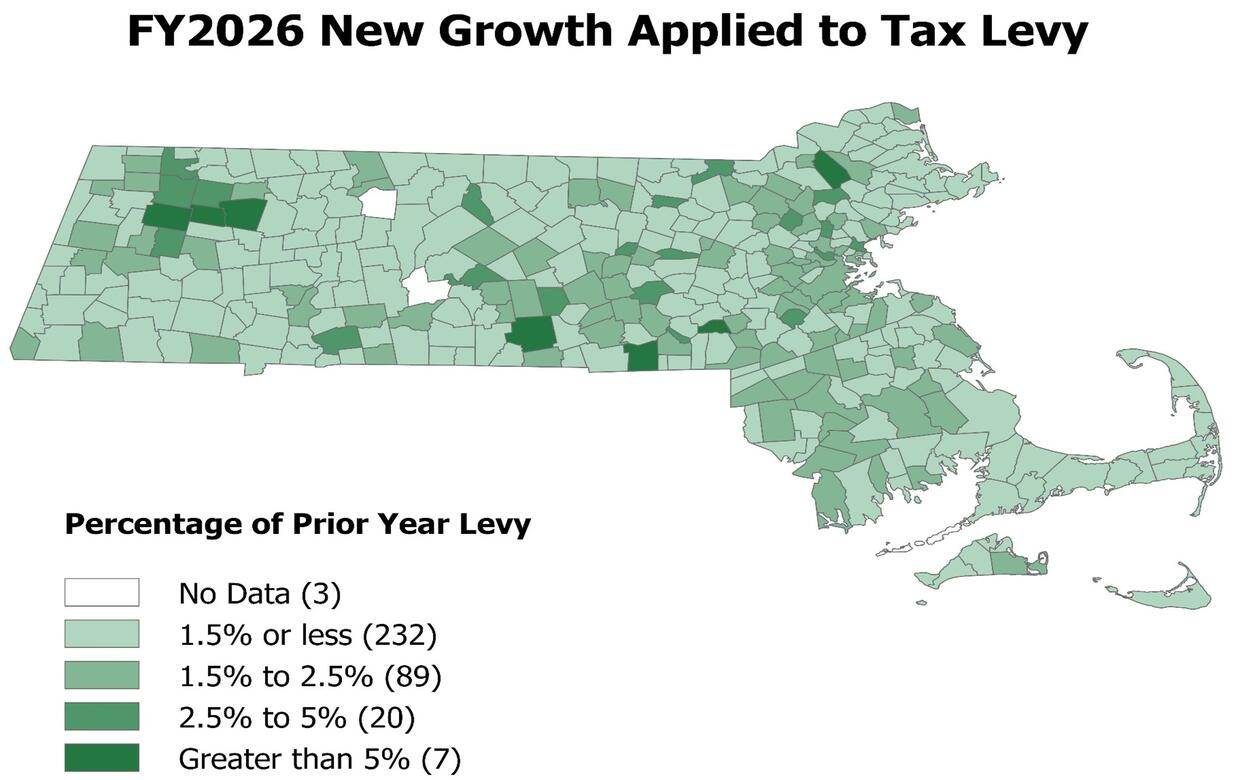
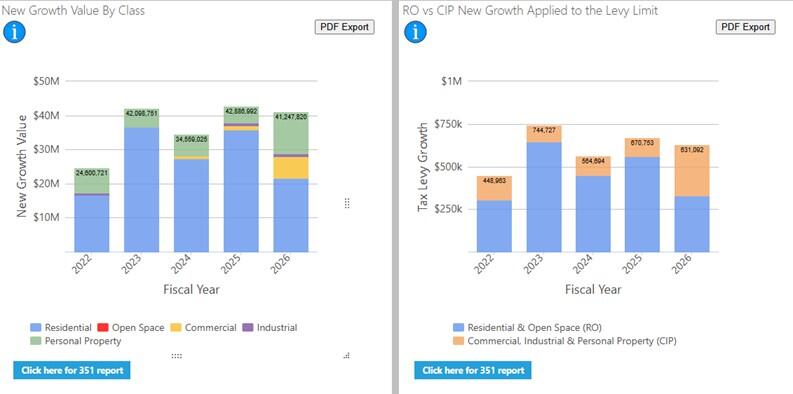
DLS provides data by community and depicted on the Municipal Finance Trend Dashboard, a snapshot of which is shown below. Also visit the BLA Dashboard for additional information.
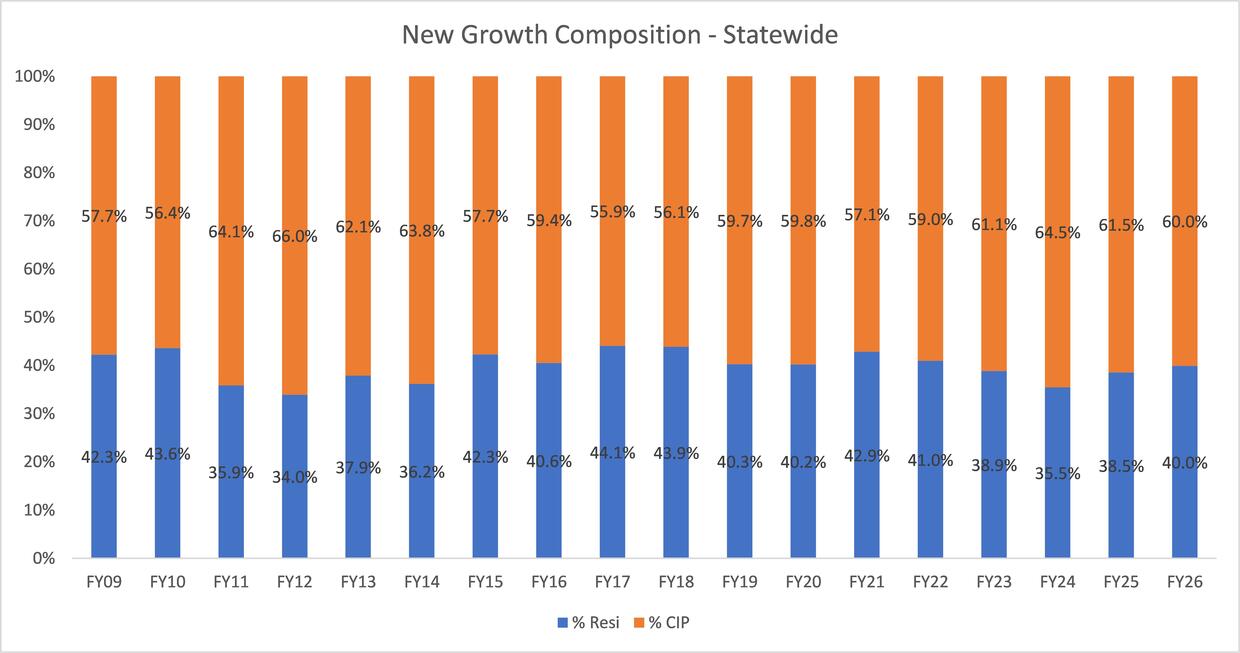
Another data set related to New Growth is its composition, i.e., from what classification of property is New Growth is being generated. As shown in the graph below, it continues to be the Commercial/Industrial/Personal Property (CIP) category that generates the majority of New Growth. The split between Residential and CIP has been relatively consistent.
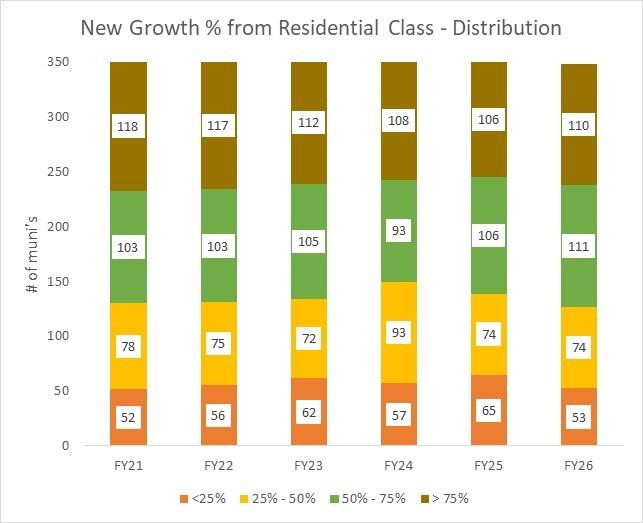
While in total dollar terms most of the $387M in New Growth comes from the CIP class, for most municipalities New Growth comes from the Residential class. As shown in the graph below, the number of municipalities dependent upon the Residential class for generating New Growth has been very consistent, with an average of approximately 215 (61%) cities and towns having more than 50% of New Growth come from the Residential class. Looked at another way, the CIP class accounts for the majority of New Growth in less than 40% of municipalities, on average, even though the state as a whole relies on the CIP for most New Growth.
DLS provides data by community and depicted on the Municipal Finance Trend Dashboard, a snapshot of which is shown below. Also visit the BLA Dashboard for additional information.
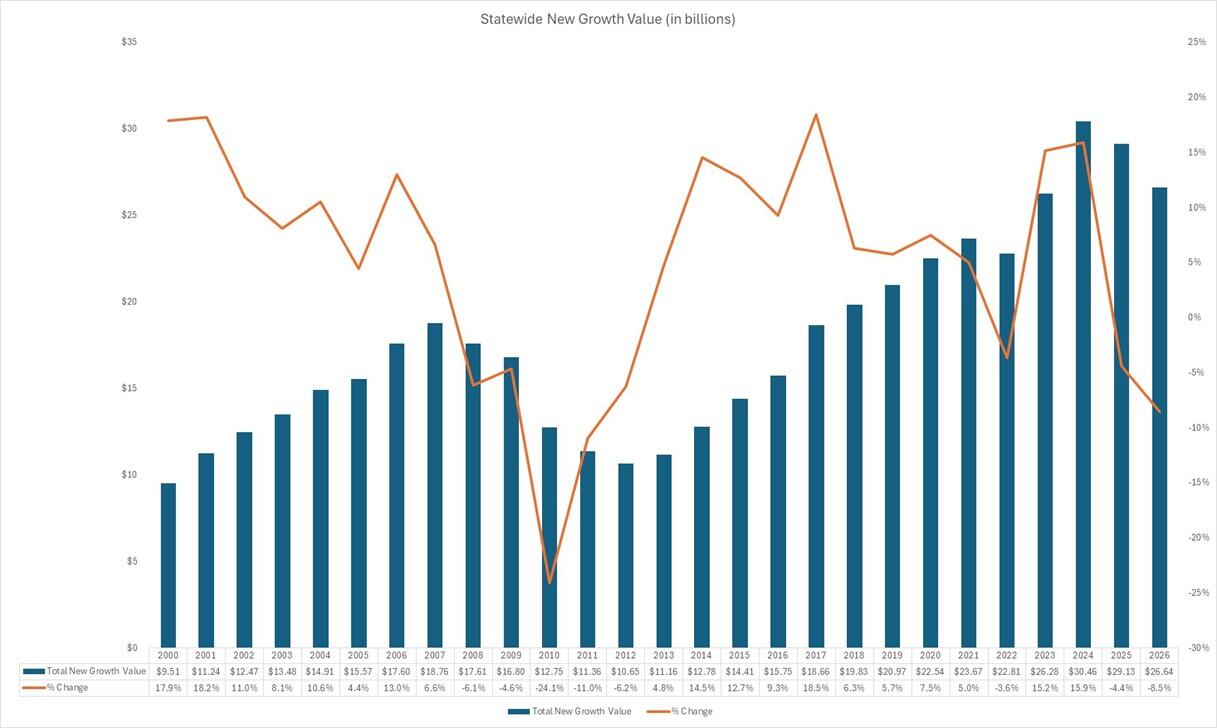
To this point, this article has focused on New Growth in terms of the amount of property taxes generated. This next data set shows the value of New Growth, which totaled $26.6B in FY2026. The graph below depicts the New Growth value and clearly shows the drop in New Growth caused by the Great Recession that occurred in CY2007 – CY2009. Since FY2014, New Growth value has increased significantly, from $12.8B to $29.1B. However, as previously noted, FY2026 was the second year in a row with a decrease.
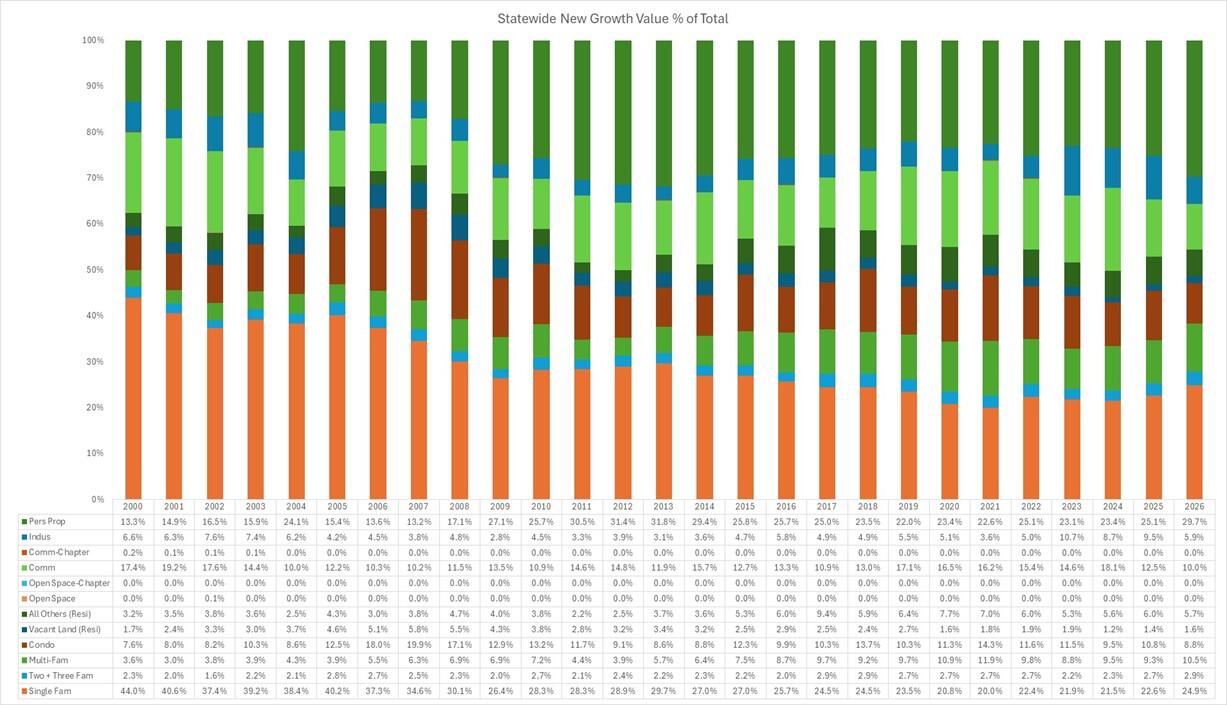
The next graph shows New Growth value broken out by property type (single family, condos, commercial, etc.). A few trends can be gleaned from the data set: (1) single family parcels have gone from comprising 44% of all New Growth value to an annual figure in the low-to upper-20%’s, (2) personal property has gone from comprising less than 15% to an annual figure approximately 25% - 30% annually and (3) commercial has declined to 10% of total value.
We hope you've found this article interesting and informative. If you have feedback or suggestions for future City & Town analysis, contact us at dls_alerts@dor.state.ma.us.
Helpful Resources
City & Town is brought to you by:
Editor: Dan Bertrand
Editorial Board: Tracy Callahan, Sean Cronin, Janie Dretler, Brianna Ortiz, Christopher Ketchen, Paula King, Jen McAllister, Jessica Sizer and Tony Rassias
| Date published: | February 5, 2026 |
|---|