Downloads
Overview
The MassDEP Wetlands Change layer contains polygon features identified as being a wetland change area based on one of the following MassGIS color ortho imagery (aerial photography) products: 2001-2003, 2005, 2008-2009 and 2011-2012. The attribute codes in the polygon layer describe different types of wetland environments and different types of reasons for the wetlands change.
The layer is named WETCHANGE_POLY.
Limitations/Disclaimer
The MassDEP Wetlands Change datalayer has been developed and is made available for distribution for the purpose of serving as a tool to monitor changes within the wetland areas which MassDEP has included in its statewide wetlands datalayer.
The MassDEP Wetlands Change datalayer is based on the interpretation of aerial photographs and digital aerial imagery. Because the changes represented on these maps have been determined solely through photo-interpretation, they do not represent, and should not be used as, wetlands delineation under the Wetlands Protection Act (M.G.L. c. 131, sec. 40) and the implementing regulations (310 CMR 10.00 et seq.).
While aerial photography can be a useful and reliable tool for ascertaining the existence, past or present, of wetland resource areas, it is not a substitute for and should be used in conjunction with appropriate ground survey observation (vegetation; history of hydrology; soil profiles, etc.).
Production
Introduction
In the fall of 2002, the Massachusetts Department of Environmental Protection (MassDEP) launched an innovative project to evaluate its wetlands protection efforts over the previous decade utilizing remote sensing. This project, known within the agency as the Wetlands Change Project, made use of state wetlands maps produced using aerial photography over the previous eleven years by the Wetlands Conservancy Program (WC Program), a three-person mapping division within the MassDEP’s Office of Watershed Management. Using the datalayer, which by 2002 had been produced for 70% of the state, the WC Program was able to develop a digital database of areas of apparent wetlands alteration occurring roughly from 1990 to April of 2001, by employing a GIS-based computer analysis methodology it had developed in conjunction with the National Oceanic and Atmospheric Administration (NOAA) Center for Coastal Fisheries and Habitat Research. This methodology involved superimposing images from later aerial flyovers on the original, base wetlands maps produced by the WC Program, to highlight changes over time. Differences detected in areas previously mapped as wetlands on these maps, such as clearing, building, or filling, indicated that some wetlands alteration had occurred.
Methodology
The Wetlands Change Project is based on the digital comparison using the following digital orthophoto (ortho) imagery:
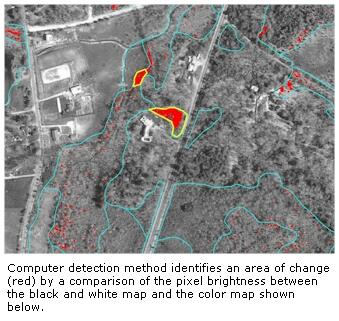
MassGIS 1990's Aerial Imagery, 2001/2003 Aerial Imagery, 2005 Aerial Imagery, 2008/2009 Aerial Imagery and 2011/2012 Aerial Imagery. The semi-automated digital analysis involved a comparison of the individual pixel (digital picture units) by making the assumption that the wetland pixels are dark (wetlands customarily display a dark photo-signature from the wet soil conditions) and comparing it to the actual pixel brightness value displayed in the later orthophotos. After experimentation, a proper minimum level of brightness was determined and a procedure was developed for the pixel by pixel analysis of the brightness values of the newer map compared to the assigned values of the earlier. This process, known as clustering is well known in the field of digital image analysis.
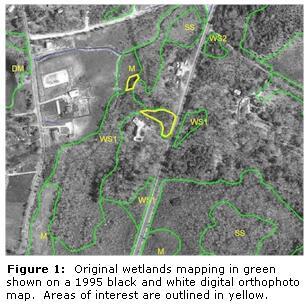
Areas previously mapped as upland were screened out of this process, in an effort to focus only on the mapped wetland areas. A digital comparison of the individual picture units (pixels) was then conducted, with pre-set ranges of difference in pixel lightness and darkness values within wetland boundaries between the different orthophotos were flagged for further analysis (see Figure1).
This process was done first using the differences between the 1990s (1993-1999) aerial imagery and the 2001-2003 aerial imagery. The 2005 analysis used differences between the 2001/2003 aerial imagery and the 2005 aerial imagery and the 2008/2009 analysis used differences between the 2005 and the 2008/2009 aerial imagery. The Western MassDEP region was not included in the first analysis because the wetlands mapping had not been completed when the project was launched. Although the Central MassDEP region was included in the first analysis, the wetlands change catchment period for this region is greatly reduced relative to that for the Northeast and Southeast MassDEP regions (3 years versus 8-11 years) because the base wetlands mapping for the Central region was not completed until 1999.
Each possible wetlands change area in the project database was given a unique identifying number consisting of the initials WC for the 1993-1999 to 2001/2003 analysis, WC2 for the 2005 analysis and WC3 for the 2008/2009 analysis, followed by a project code number indicating the specific city or town in which the change area was located, and then followed by a discrete number ranging from one up to the total number of change areas for that community. (For example WC-27-3 would be a site in Berkeley from the 2001 imagery, WC2-27-3 would be a site in Berkeley from the 2005 imagery and WC3-27-3 would be a site in Berkeley from the 2008/2009 imagery).
Each of these wetlands change areas in the database was linked to a specific potential wetlands alteration site circled in yellow on the aerial image of the community, and referred to by project staff as a “wetlands change polygon.” These wetlands change polygons could be observed on aerial images of the entire state on a computer using GIS software, or on hard-copy printouts generated for each individual community.
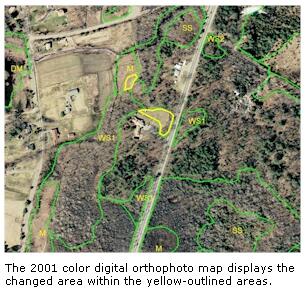
The size of impact of each wetlands change area was determined by viewing the particular site on both orthophotos. The photo-interpreter then hand digitized the area of change on the color orthophoto map, enlarging the images if necessary to get accurate readings for entry into the wetlands change database. Project photo-interpreters also determined the probable activity resulting in the change and the type of wetland impacted by visual interpretation of the aerial change image orthophotos.
Project photo-interpreters could choose from the following nine activity categories: agriculture, clearing/filling unknown reason, commercial activity, cranberry bog activity, gravel operation, logging/clearing, other, residential development, and transport infrastructure. Similarly, project photo-interpreters categorized wetlands change areas according to the following thirteen wetland types: barrier beach – shrub swamp, bog, coastal bank bluff or swamp, cranberry bog, deep marsh, marsh, open water, salt marsh, shallow marsh meadow, shrub swamp, wooded swamp coniferous, wooded swamp deciduous, and wooded swamp - mixed tree.
Attributes
The wetlands change polygon feature class is populated with these fields:
| Field Name | Type | Description |
|---|---|---|
| POLY_ID | Text | Unique polygon feature ID |
| TOWN | Text | MassGIS Town Name |
| WETCODE | Long | Wetland Conservancy codes. See Wetlands Datalayer |
| IT_VALC | Text | Wetland label abbreviations. See Wetlands Datalayer |
| IT_VALDESC | Text | Description of wetland labels. See Wetlands Datalayer |
| POLY_CODE | Long | Simplified POLY_CODE adapted from 1:25,000 hydrography. See Wetlands Datalayer |
| CHGTYPE | Text | Photo-interpreted change type |
| PHOTOYEAR | Text | Year of orthophoto used to detect feature (2001, 2003, 2005, 2008, 2009, 2011, 2012) |
| DETECTYEAR | Short | Year of orthophoto on which the change area is first detectable |
| AREAACRES | Float | Area of the feature in acres |
| AREASQFT | Float | Area of the feature in Square Feet |
| POLY_NUM | Float | Internal MassDEP Development ID |
The items WETCODE, IT_VALC, IT_VALDESC and POLY_CODE are taken from the underlying polygons from the . Please refer to that layer for a complete description.
Maintenance/Availability
This datalayer has been developed by the MassDEP Wetlands Conservancy Program with GIS support and data management assistance provided by the MassDEP GIS Program. The field DETECTYEAR was added to the layer in 2011. In August 2011 one change feature (WC3A-292-5) in Swansea was added.
For questions please contact the MassDEP Wetlands Program at email: DEP.Wetlands@mass.gov.