

Telephone calls are one of the primary ways that claimants interact with the Department of Unemployment Assistance (DUA) as a means to apply for unemployment benefits, obtain assistance with their claims, and address questions or issues. Despite the importance of claimant access to DUA services through telephone calls, DUA did not establish performance standards, including metrics for timely responses to claimant inquiries made via telephone. Additionally, DUA could not demonstrate that call log data was being monitored at all to evaluate call-handling performance.
Our review of the call log data identified significant wait times for the majority of callers. DUA received a total of 735,750 calls during the period August 26, 2024 through August 26, 2025. Our analysis of the call log data determined that a DUA call center agent or automated voice prompt took 30 minutes to respond to 381,915 (52%) inbound calls during this period. Of these 381,915 calls, wait times exceeded 60 minutes for 173,601 (24% of the total calls). See Figure 4.
Figure 4. Total Number of Inbound Calls by Wait Time
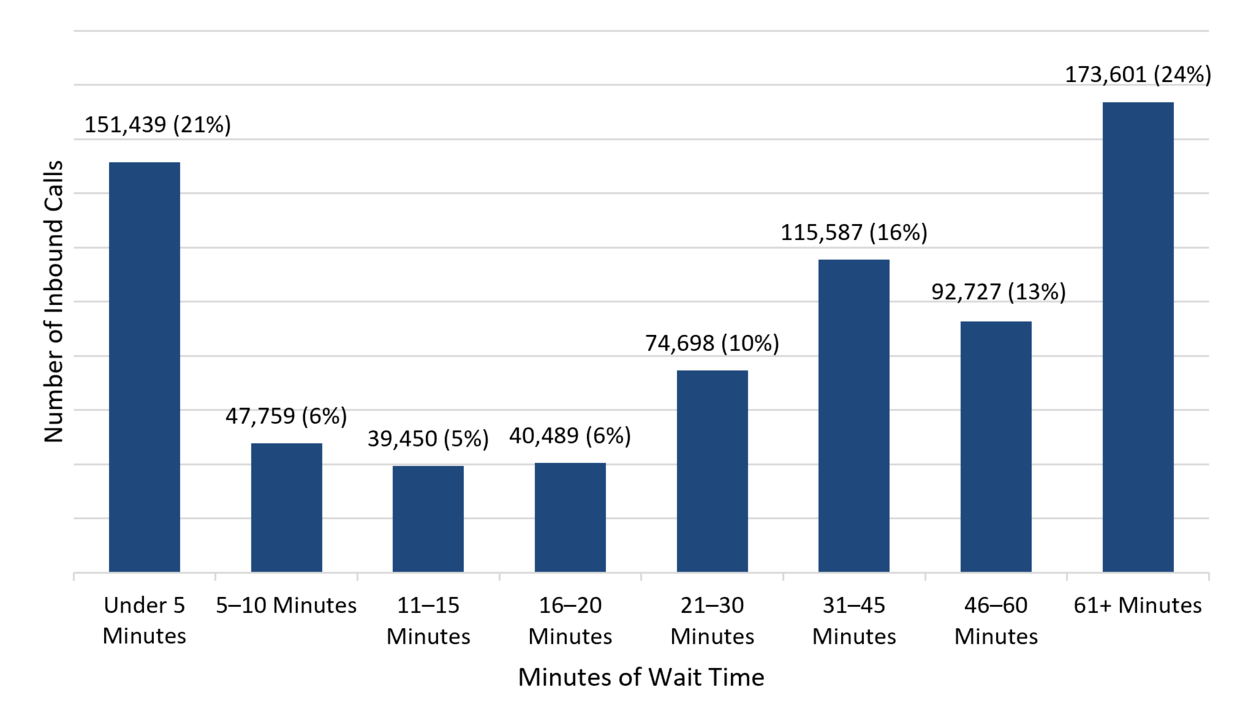
Note: Percentages were rounded to the nearest whole number.
Call Handling Times
Industry best practices, as outlined by New York State call center standards, provide a benchmark for evaluating call center efficiency. These standards recommend an average call handling time of approximately four to six minutes per call. Call handling time refers to the total time a call center agent spends actively assisting a caller after the call is connected to the call center agent. This includes time talking and any time the caller is placed on hold by the call center agent during the interaction, as well as after-call work. It excludes any time a caller spends waiting in a queue or on hold before reaching a call center agent.
Table 2 shows DUA’s monthly average call handling time in minutes and seconds for the period August 26, 2024 through August 26, 2025. As shown in the table, DUA’s average call handling time was consistently more than double the benchmark range of four to six minutes, indicating potential inefficiencies in call handling processes.
Table 2. Average Call Handling Times
| Month and Year | Total Talk Time in Seconds | Total Hold Time in Seconds | Total After-Call Work Time in Seconds | Total Time of Customer Interaction in Seconds | Total Number of Calls Handled | Average Call Handling Time in Minutes |
|---|---|---|---|---|---|---|
| August 2024* | 3,371,065 | 557,112 | 106,638 | 4,034,815 | 3,711 | 0:18:07 |
| September 2024 | 14,212,607 | 2,137,620 | 452,313 | 16,802,540 | 15,328 | 0:18:16 |
| October 2024 | 14,819,681 | 2,177,901 | 452,408 | 17,449,990 | 15,000 | 0:19:23 |
| November 2024 | 12,400,585 | 1,930,973 | 368,805 | 14,700,363 | 12,568 | 0:19:30 |
| December 2024 | 12,893,231 | 1,865,017 | 395,354 | 15,153,602 | 13,626 | 0:18:32 |
| January 2025 | 13,424,335 | 1,887,013 | 402,783 | 15,714,131 | 14,059 | 0:18:38 |
| February 2025 | 12,167,807 | 1,452,251 | 374,410 | 13,994,468 | 13,831 | 0:16:52 |
| March 2025 | 41,552,916 | 2,276,140 | 1,312,230 | 45,141,286 | 47,947 | 0:15:41 |
| April 2025 | 43,232,687 | 1,206,162 | 1,530,892 | 45,969,741 | 58,632 | 0:13:04 |
| May 2025 | 40,534,347 | 2,413,393 | 1,697,747 | 44,645,487 | 52,427 | 0:14:12 |
| June 2025 | 38,643,406 | 1,898,283 | 1,837,411 | 42,379,100 | 54,589 | 0:12:56 |
| July 2025 | 33,070,498 | 1,840,600 | 1,586,921 | 36,498,019 | 45,139 | 0:13:29 |
| August 2025** | 21,238,977 | 1,262,846 | 968,199 | 23,470,022 | 27,913 | 0:14:01 |
* This month contains only 5 days of call log data because our data was from August 25, 2024 through August 26, 2025.
** This month contains only 26 days of call log data because our data was from August 25, 2024 through August 26, 2025.
Call Abandonment Rates
According to the New York State call center’s standards, call abandonment rates should generally be maintained below 5%. Table 3 shows DUA’s monthly call abandonment rates for the period August 26, 2024 through August 26, 2025. As shown, DUA’s call abandonment rates were consistently above the 5% benchmark for most of the period—in most instances, almost six times the 5% standard—indicating challenges in managing call volume and access to service.
Table 3. DUA Call Abandonment Rates
| Month and Year | Number of Abandoned Calls | Number of Inbound Calls | Call Abandonment Rates | Average Wait Time Before Abandonment (Minutes) |
|---|---|---|---|---|
| August 2024* | 3,081 | 10,782 | 29% | 38 |
| September 2024 | 12,405 | 42,798 | 29% | 37 |
| October 2024 | 12,734 | 43,352 | 29% | 40 |
| November 2024 | 11,196 | 37,728 | 30% | 44 |
| December 2024 | 11,542 | 41,094 | 28% | 48 |
| January 2025 | 10,831 | 40,054 | 27% | 49 |
| February 2025 | 11,457 | 39,607 | 29% | 45 |
| March 2025 | 8,122 | 69,468 | 12% | 20 |
| April 2025 | 3,365 | 69,708 | 5% | 18 |
| May 2025 | 10,769 | 88,139 | 12% | 20 |
| June 2025 | 20,382 | 113,242 | 18% | 25 |
| July 2025 | 19,403 | 112,808 | 17% | 27 |
| August 2025** | 13,244 | 70,106 | 19% | 27 |
* This month contains only 5 days of call log data because our data was from August 25, 2024 through August 26, 2025.
** This month contains only 26 days of call log data because our data was from August 25, 2024 through August 26, 2025.
Of the 148,531 abandoned calls during the period August 26, 2024 through August 26, 2025, 138,383 (93%) calls were abandoned while the caller was waiting to reach a call center agent and were not included in DUA’s average call handling time in Table 2. The remaining 10,148 (7%) abandoned calls had callers who reached a DUA call center agent before abandoning the call; and these calls were included in the average call handling time data (Table 2). This likely reduced the reported average call handling time for all 374,770 calls shown, making performance appear more favorable than the actual time required to fully serve callers.
It is also important to note that abandoned calls are included in the wait time data in Figure 4. Across the total number of 148,531 abandoned calls, the average wait time before callers disconnected was approximately 34 minutes. For abandoned calls that were disconnected before reaching a DUA call center agent, the recorded wait time ended when the caller disconnected. As a result, the wait time data does not capture how much longer these callers may have waited if they had remained on the line until reaching a call center agent. Because 93% of abandoned calls did not reach an agent, the inclusion of these calls in the wait time data makes the overall wait times appear more favorable than they would have been if these callers had stayed on the line.
Figure 5 shows the call abandonment rate relative to the number of calls that DUA received during the audit period, and how that rate compares to the 5% benchmark.
Figure 5. Number of Inbound and Abandoned Calls and Call Abandonment Rates Compared to the 5% Benchmark
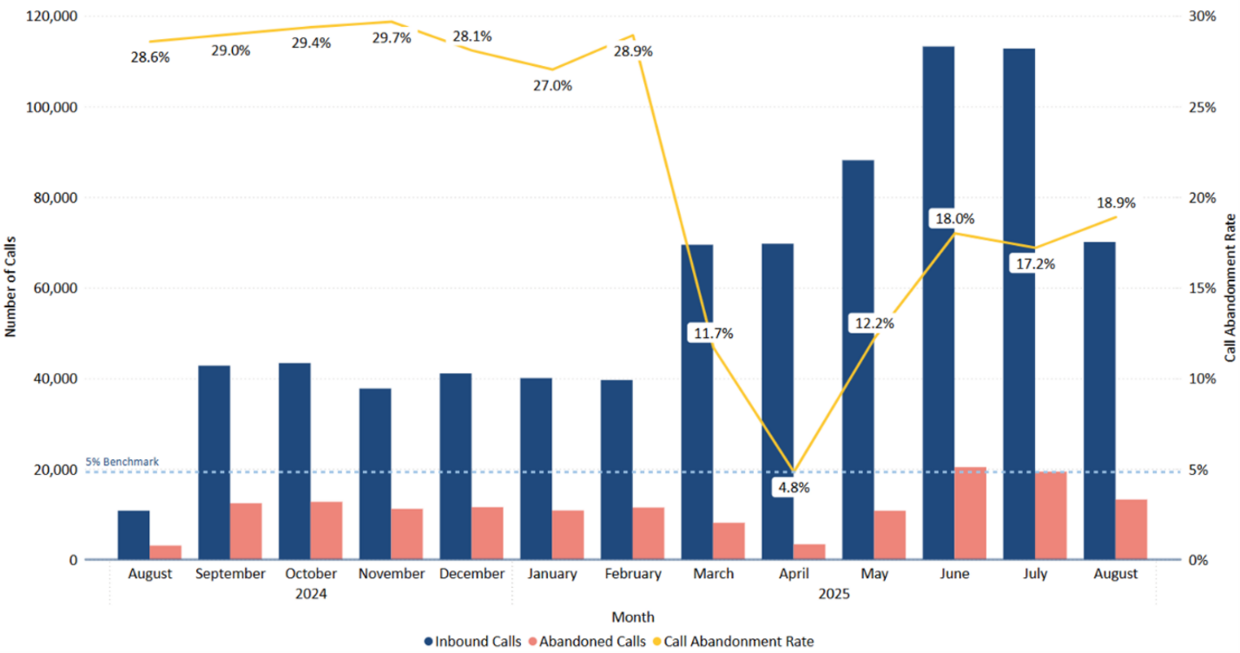
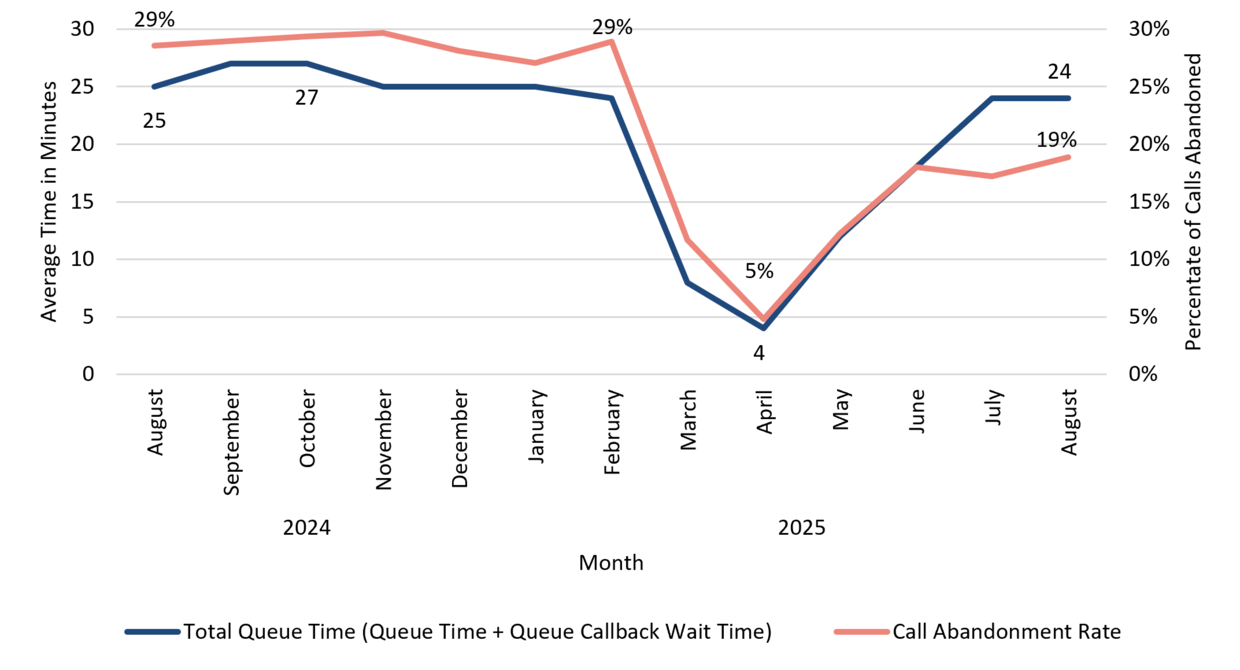
Figure 6 shows the average wait time callers experienced and the abandonment rate of calls during each month of the audit period.
Figure 6. Average Wait Time vs. Call Abandonment Rate
If DUA does not establish formal performance standards or metrics and does not monitor call log data, then it cannot ensure that it handles claimant inquiries in a timely and consistent manner. Significant wait times for callers may result in delayed access to unemployment insurance (UI) benefits, decreased trust in DUA, and reduced overall efficiency of call center operations. Without monitoring and performance standards, DUA lacks the ability to identify operational bottlenecks, allocate resources effectively, or implement improvements to enhance service delivery.
Authoritative Guidance
The federal Employment and Training Administration (ETA) issued Training and Employment Notice No. 18-24, which provides state UI agencies with a customer experience checklist and resources to improve state UI programs. According to Section 4 of ETA’s Training and Employment Notice No. 18-24,
c. Baseline [Customer Experience (CX)] Metrics (Attachment I – Section B). There are three categories of CX metrics the Department is recommending that [State Workforce Agencies (SWAs)] use to evaluate the current status of their [Employment Modernization and Transformation (EMT)] system. . . .
i. Operational metrics, also called interaction metrics, are centered around transactions and measure specific parts of UI application processes and the [EMT] system. Some examples of what can be measured is how many individuals accessed their online portal in a week, how long it takes an individual to complete tasks, number of minutes it takes to answer a phone call, and more.
ii. Experience metrics are based on how the individual felt about their interaction with the state agency and are captured via surveys or questions asked after an in-person, online, or phone interaction. The answers are typically a scale that ranges from extremely dissatisfied to extremely satisfied, with a neutral middle. Some metrics that can be baselined and measured at various intervals are trust, satisfaction, ease of use, timeliness, helpfulness of staff interaction, etc. It is important to remember that these metrics are completely based on the perception of the individual.
iii. Outcome metrics are based on actions completed by individuals and are used to evaluate and determine where improvements can be made in SWAs’ UI processes. Click-through rates between sections of the UI application, number of errors resulting at the end, and percentage of claimants who do not complete their application or weekly certification (abandonment rates) are some examples of outcome metrics.
Although DUA is not required to follow this notice, since this is an encouraged practice for states from ETA, we consider it a best practice. We also consider it a best practice for government agencies to track, and seek to improve, the performance of their work in service to the public.
We referenced New York State call center standards as a benchmark for assessing DUA’s call center performance. DUA could consider these benchmarks to improve operational efficiency and customer service quality. According to New York State’s official website,
Call center standards are a set of guidelines, benchmarks, and best practices designed to ensure high-quality customer service, operational efficiency and compliance with government regulations. . . .
Average handling time (AHT) . . . can vary by agency, but the general range is between 4 to 6 minutes. However, more complex customer inquiries may have longer AHT due to the detailed nature of customer needs.
Call Abandonment Rate: This measures the percentage of customers who hang up before their call is answered. . . . Call abandonment rates should ideally be kept under 5%, though this can vary depending on the agency and the complexity of customer queries.
Although DUA is not required to follow these standards, since they are written for New York State call centers, we consider these standards to be best practices.
Reasons for Issue
According to DUA officials, the issue was caused by insufficient staffing levels and budget constraints.
DUA stated that additional staff members are added when call wait times exceed 30 minutes. However, there was no documentation or evidence to demonstrate that this practice was implemented, monitored, or effective. Additionally, this approach was not incorporated into formal policies or procedures, and data did not exist to help us determine whether this reported practice helped reduce wait times and by how much, or whether it was an effective use of taxpayer dollars. Such data could assist DUA in conducting a cost-benefit analysis to determine whether it is more effective to hire additional staff members or additional contractors to address long wait times.
Recommendations
- DUA should develop and document policies that define expected response times for claimant telephone inquiries, including measurable targets for wait times and call handling.
- DUA should routinely review call log data, including call volume, wait times, and abandoned calls, to ensure timely service and identify areas that need improvement. DUA should retain documentation of monitoring activities.
- DUA should incorporate practices—such as adding staff members when wait times exceed a certain threshold—into formal policies with documentation showing how staffing decisions are made and implemented.
- DUA should analyze call log data trends regularly and use the results to make operational changes, improve service delivery, and ensure that response standards are being met.
Auditee’s Response
The DUA call center plays a critical role in the customer service experience, which is why the agency has made significant improvements, added resources, and prioritized its success.
DUA already tracks call center performance data, including call wait times, call volume, and staffing, through various reports (Director’s Report and All Queue Summary) to DUA leadership. These reports help DUA leadership monitor staffing and allocate resources, identify slowdowns, and make improvements to enhance the customer service experience. Historically, DUA experiences seasonal increases and decreases in call volume and evaluates staffing needs throughout the year.
During the time frame covered by this Audit, DUA was transitioning from its legacy unemployment system to its new [Employment Modernization and Transformation (EMT)] system, which launched in two phases. Phase 1, focused on revenue, launched September 12, 2023; Phase 2, focused on benefits launched May 6, 2025. In each instance, prior to and after each phase of the new system went live, DUA provided extensive new training to staff, focusing on how to navigate and perform their jobs in the new system. DUA has since increased staffing, continues to evaluate staffing capacity, and provide training for new staff to timely and efficiently handle calls. DUA’s contact center (call center) supervisors are continuously working with staff to assist them in learning and improving their skills.
In addition to the longstanding call monitoring reports, the EMT system offers numerous operational and outcome-driven metrics that DUA reviews to measure both the efficiency of the system itself and any common pain points in the application process. For example, the new system tracks the percentage of claimants requesting benefits using a mobile device and the average time it takes a claimant to request weekly benefits. The system also includes an “experience” metric that allows claimants to provide feedback to DUA. While DUA reviews and considers all such feedback, DUA currently maintains an average 4.6 out of 5 rating for user experience in the new system.
Call Handling Times vary at DUA based on individual caller needs. Unlike other call centers, DUA provides more than typical "customer assistance" including assistance in completing tasks that claimants may be unable or unwilling to complete themselves using online resources or self-service tools. Every call is unique and next steps and time to handle will vary. For example, a claimant may request that staff manually file an unemployment claim for them, which takes on average approximately 20 to 30 minutes. By contrast, someone calling simply to check on claim status typically takes 5 minutes or less on average. As another example, a claimant may call specifically to have staff assist in recording fact-finding for a non-monetary issue(s), which may take approximately 10 minutes on average for just one fact-finding. Managers and supervisors routinely monitor call center performance data, including call wait times, call volume, and staffing through the Director’s Report, All Queue Summary, and ad hoc reports. In addition to call center monitoring, managers and supervisors routinely review overall staff performance through employee work items completed, issues cleared, and overall efficiency and work with staff to ensure acceptable service is being provided.
DUA is focused on providing full service, delivering accurate information, and answering all questions a claimant may have on the telephone. Balancing quality and efficiency are vital to DUA's call center operations, but inherent in that balance is a requirement that DUA staff need to take the time necessary to resolve a claimant’s problem or reason for calling in order to minimize the claimant’s need for follow-up phone calls.
Auditor’s Reply
Although DUA states that it tracked call center performance data through various reports during the audit period, DUA could not provide documentation demonstrating that its leadership reviewed these reports, assessed performance, or used data from the reports to make operational decisions during the audit period. In addition, DUA did not have documented policies or procedures establishing how call center performance should be monitored and evaluated.
DUA describes steps it has taken to improve call center operations, including providing additional training, increasing staffing, and utilizing the new capabilities of its Employment Modernization and Transformation (EMT) system. However, Phase 2 of the EMT system, which made the system available to claimants, was not implemented until after the audit period; therefore, DUA’s claims regarding effectiveness have yet to be determined.
DUA states that call handling times vary depending on the type and complexity of assistance required for each claimant inquiry. We recognize that some claimant inquiries may require additional time based on the services provided. However, our finding was not based on an expectation that all calls should have the same call handling time. We found that DUA had not established documented performance standards, including targets for wait times and call handling. Without established standards and a documented monitoring process, DUA cannot demonstrate that it is consistently evaluating whether service goals are being met or identifying areas where improvements may be needed to support timely and consistent service for claimants.
We urge DUA to fully implement our recommendations. As part of our post-audit review process, we will follow up on this matter in approximately six months.
| Date published: | September 21, 2026 |
|---|