Downloads
View tile download instructions
Download from a spreadsheet of links (To download in bulk, save links in column C to a text file and use it as input to wget, WinWGet or Persepolis Download Manager)
Overview
In spring 2025, MassGIS acquired statewide, 15 cm resolution (7.5 cm resolution for Cape Cod), 16-bit, 4-band (RGB-IR) digital orthophotos. Funding for this imagery was provided by MassDOT, the State 911 Department and EOTSS.
The data were delivered in late 2025/early 2026 as 12,345 individual GeoTIFF images:
| Project Area | No. of images | Image dimensions | Pixel resolution |
|---|---|---|---|
| Cape Cod | 2,823 | 750 m x 750 m | 7.5 cm |
| Zone 19 (Eastern Mass.) | 5,427 | 1,500 m x 1,500 m | 15 cm |
| Zone 18 (Western Mass.) | 4,095 | 1,500 m x 1,500 m | 15 cm |

The tile naming convention is based on the U.S. National Grid (USNG), taking the coordinates of the southwest corner of the tile. See the Index layer. The imagery’s horizontal accuracy specification was ASPRS Class 1. The data were developed based on a horizontal projection/datum of NAD 1983 (2011) UTM Zones 18N and 19N (meters).
To allow for easier distribution of this free imagery, MassGIS compressed the GeoTIFFS into the JPEG 2000 format, which retains the IR band. MassGIS also serves the data as a cached tile service.
This digital orthoimagery was created to provide easily accessible geospatial data which are readily available to enhance the capability of federal, state, and local emergency responders, as well as to plan for homeland security efforts.
These images can serve a variety of purposes, from general planning to field reference for spatial analysis, to a tool for data development and revision of vector maps. The imagery can also serve as a reference layer or basemap for myriad applications inside geographic information system (GIS) software and web-based maps.
Production
Aerial Acquisition
Planning, acquisition, processing, and creation of derivative products by MassGIS and NV5 Geospatial of Lexington, KY.
Aerial imagery was acquired using an UltraCam Eagle M3 camera with a flight design that included a total of 235 flight lines to capture 13,676 photos. Aerial imagery was supplemented with the simultaneous acquisition of airborne GPS/IMU data, which captured the ground coordinate for the nadir point of each photograph.
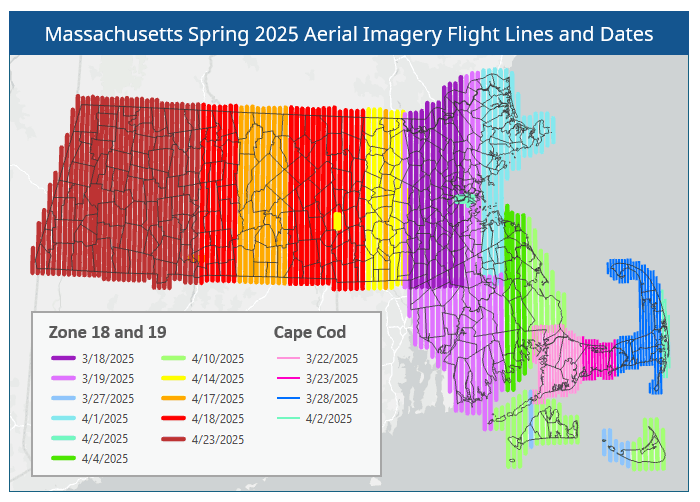
Imagery was collected on 14 days, from 3/18 to 4/23, under conditions free from clouds and cloud shadows, smoke, fog, haze, light streaks, snow, ice on water bodies, flooding, excessive soil moisture, and foliage.
Within the UltraMap software suite used by NV5 Geospatial, raw acquired images were radiometrically and geometrically corrected using the camera’s calibration files and output as Level 2 images. The resulting radiometry was then manually edited to ensure each image has the appropriate tone and no pixels are clipped, and to blend each image with its neighbors.
Once radiometry had been edited, separate RGBI and Panchromatic images were blended together to form 12,345 single level 4 band TIFF images.
Photo position and orientation were calculated by linking the time of image capture, the corresponding aircraft position and attitude, and the smoothed best estimate of trajectory (SBET) data in POSPac software. Aerotriangulation was then performed using the Inpho software suite. Adjusted images were then draped upon a ground model and orthorectified. Individual orthorectified tiffs were blended together to remove seams and corrected for any remaining radiometric differences between images using Inpho’s OrthoVista.
Orthophotography Creation
Digital orthophoto frames were created by using existing public domain elevation data sets, which were in turn combined with Level 3 processed imagery, aerotriangulation data, and government supplied airborne topographic LiDAR bare earth datasets of various vintages. This orthorectification process was done in Hexagon Geomedia on the three data sources (processed imagery, aerotriangulation data and surface data). Manual Seamlines were drawn in ArcMap on every frame. Then, using the grid created with in-house software, a set of “base” mosaicked tiles were created in ImageStation OrthoPro using a bilinear interpolation method on the three data sources (rectified imagery, aerotriangulation data and surface data).
Post-processing and Quality Control
Radiometry was verified by visual inspection of the digital orthophoto. Slight systematic radiometric differences may exist between adjacent orthoimage files due primarily to differences in source image capture dates and sun angles along flight lines. These differences can be observed in an image's general lightness or darkness when it is compared to adjacent orthoimage file coverages.
All GeoTIFF data and image file sizes were validated using commercial GIS software to ensure proper loading before delivery to MassGIS.
Seamlines and tile edges were visually inspected. Seamline mismatches were corrected unless the overall displacement was less than one pixel. Orthoimages were visually inspected for completeness to ensure that no gaps or image misplacements existed within and between adjacent images.
In order to post-process the imagery data to meet task order specifications and ASPRS horizontal accuracy guidelines, the horizontal accuracy was tested by NV5 Geospatial using a total of 17 ground control points (6 in Zone 18 and 11 in Zone 19).
NV5 Geospatial created independent check points, none of which were used in the calibration or post-processing of the imagery data. The checkpoints were distributed throughout the project area and were surveyed using GPS techniques. The x and y positions of where the checkpoints fell on the orthoimagery were collected. These values were then compared to the surveyed control point x and y values.
Overall Project Accuracy Statement:
"All point coordinates have been reported in the North American Datum of 1983 (2011). Universal Transverse Mercator – Zones 18/19 coordinates in meters horizontally. Elevations are relative to the North American Vertical Datum of 1988 (NAVD 88) which were derived using the Geoid 18 model and are reported in meters."
Control Points
- Average Horizontal RMSE is 0.003 m.
- Average Elevation RMSE is 0.008 m.
- Average 3 dimensional RMSE is 0.007 m.
Check Points
- Average Horizontal RMSE is 0.005 m.
- Average Elevation RMSE is 0.013 m.
- Average 3 dimensional RMSE is 0.013 m.
For Cape Cod, the aerotriangulation report lists 66 ground control points and 11 ground check points. The RMSE was:
- 56 Ground Control Points (X/Y/Z): 0.032/0.047/0.015
- 10 Control Points Vertical (Z): 0.019
- 10 Ground Check Points (X/Y/Z): 0.034/0.092/0.044
- 1 Check Point Vertical (Z): 0.088
Complete details are included in the Survey and AT reports.
JPEG 2000 Compression
MassGIS converted each GeoTIFF to an 8-bit JPEG 2000 (GMLJP2) format image using GeoExpress 10 software. These files maintain all four bands and were produced at a lossy compression ratio of 20:1, resulting in very minimal loss of image quality. Each image is approximately 19 MB, reduced from the 763 MB GeoTIFF, more suitable for distribution and download. MassGIS calculated statistics on the JPEG 2000 images in ArcGIS Pro. All of the imagery is available for public use and distribution.
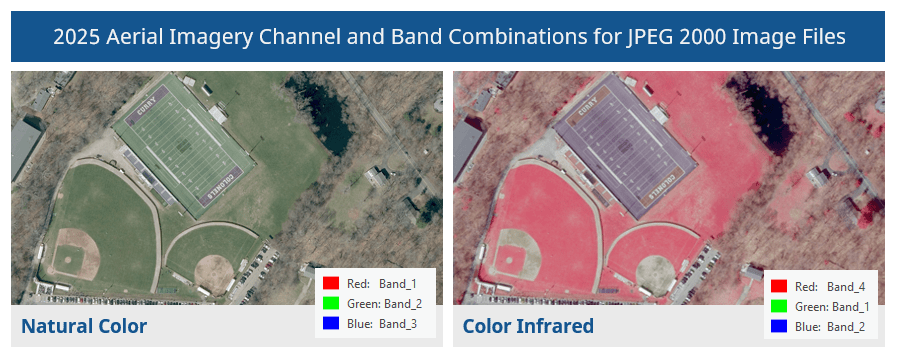
When displaying the JPEG 2000 images, you can choose how to render them by assigning different band combinations to the red, green and blue channels. The default method is to assign bands 1, 2 and 3 to the red, green and blue channels, respectively, to display the natural color view. To display a color infrared view, assign bands 4 (near infrared), 1 and 2 to the red, green and blue channels, respectively. The difference in rendering is shown here:
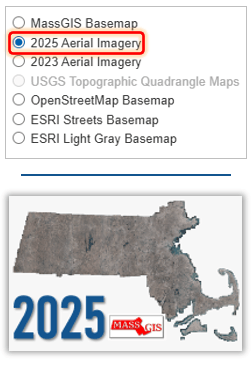
2025 imagery basemap choices in MassMapper (top) and MassGIS’ ArcGIS Online maps and apps
Web Services
MassGIS created a natural-color tile service (cache), hosted at ArcGIS Online, from the JPEG 2000 files. This service contains pre-rendered images to support fast visualization of large datasets. The cache uses the RGB bands and appears at scale levels 7 (1:4,622,324) to 20 (1:564). It is compatible not only with ArcGIS and web apps built with the ArcGIS APIs, but also QGIS and third-party apps that use OGC protocols such as WMTS.[Source]The cache appears as a basemap choice in MassMapper and all ArcGIS Online maps and apps hosted by MassGIS, including the Massachusetts Interactive Property Map.
MassGIS has also created a color-infrared (CIR) tile service from the same JPEG 2000 files. This cache uses the near-infrared, red, and green bands and appears at scale levels 7 (1:4,622,324) to 19 (1:1128). CIR imagery is widely used for interpretation of natural resources, particularly live vegetation, which appears red, and bare soils, man-made features, and water.
In addition to the information below, we have created a step-by-step, illustrated guide to help you connect to the web service.
ArcGIS desktop software
ArcMap and ArcGIS Pro users can add data from ArcGIS Online by searching for 'MassGIS 2025'.
QGIS
To add the service to QGIS, follow these instructions to create a new WMS/WMTS connection and for the URL enter:
Natural-color:
https://tiles.arcgis.com/tiles/hGdibHYSPO59RG1h/arcgis/rest/services/Massachusetts_Aerial_Imagery_2025/MapServer/WMTS/1.0.0/WMTSCapabilities.xml?cacheKey=9955572174118a43
Color-infrared (CIR):
https://tiles.arcgis.com/tiles/hGdibHYSPO59RG1h/arcgis/rest/services/Massachusetts_Aerial_Imagery_2025_CIR/MapServer/WMTS/1.0.0/WMTSCapabilities.xml?cacheKey=aa0722415a5d6f52
Use and Restrictions
No restrictions apply to these data. However, users should be aware that temporal changes may have occurred since this dataset was collected and that some parts of these data may no longer represent actual surface conditions. Users should not use these data for critical applications without a full awareness of their limitations.
MassGIS would appreciate acknowledgement for products derived from these data.
| Date published: | April 2, 2026 |
|---|---|
| Last updated: | April 20, 2026 |