4.1 Introduction
This chapter discusses design considerations and criteria for incorporating horizontal and vertical curves in a roadway’s alignment. All types of roadways are discussed in this chapter - ranging from local low-speed facilities to median divided highways. A horizontal curve in a roadway refers to the alignment, or how “straight” the roadway section is. A vertical curve refers to a roadway’s change in elevation, or the “flatness” of the roadway.
As described in Chapter 3, the operating characteristics of drivers and motor vehicles place the greatest constraints on roadway alignment. In most cases, application of the design controls for motor vehicles satisfies the design controls for bicycles and pedestrians, including those with disabilities. Incorporating a bend or a grade in a roadway segment that satisfies the design criteria for a motor vehicle will also likely satisfy the design criteria for pedestrians and bicyclists. One of the main goals of the designer in the layout of a roadway is to allow users to travel along a path in a safe and efficient manner that is compatible with the environment and the users’ operational characteristics.
Roadways must respect the existing and developed environment through which they pass while balancing the needs for safety and cost-effectiveness. As a result, roadways are not always flat and straight – they possess vertical and horizontal curves in their alignments to circumvent or be compatible with existing constraints. Alignment constraints typically include topographical variation, natural resource areas, property ownership, land use, cost, and environment. Introduction of curvilinear alignments is necessary when the designer encounters these constraints.
Good alignment design is critical in the effort to balance the needs and safety of the road user with the value of preserving the integrity of the environment.
The designer must use engineering judgment applied to a variety of factors to develop effective and efficient roadway geometry in three dimensions. These factors include:
Horizontal Curves
- Compatibility between existing and proposed conditions (controls)
- Topographical/terrain variations
- Vehicle characteristics
- Driver limitations
- Design speed
- Lines of sight
- Roadway cross section
- Radius of curve
- Superelevation (or banking)
- Length of curve
- Tangent-to-curve transition
- Profile
- Drainage considerations
- Cost
Vertical Curves
- Compatibility with existing grades and elevations on adjacent land and approaching roads and driveways/entrances adjacent to the new alignment
- Design speed
- Sight distance
- Vertical clearances
- Lengths of grade
- Entrance considerations associated with acceleration and deceleration
- Horizontal alignment
- Drainage considerations
- Costs
When using a combination of horizontal and vertical curves, it is important to consider the effects of the combination of both. It may be necessary to use more gradual change in each to meet sight distance, acceleration, and other needs safely, as described inSection 4.4.
The process of incorporating horizontal and vertical elements into a roadway’s design begins with the identification of the proposed corridor and location of critical constraints that must be considered for preservation throughout the design process. The critical constraints that drive the design process include, but are not limited to:
- Project limits
- Purpose and need of the project
- Private property and land use
- Pedestrian, bicyclist, and transit functions
- Context of the area
- Terrain
- Accessibility for people with disabilities
- Significant cultural (historical/archaeological) areas and features
- Regulated wetlands
- Natural drainage courses
- Endangered species habitat
- Intersecting roads and driveways
- Underground and overhead utilities
- Rail facilities
A balanced design will identify these constraints early in the process and align the vertical and horizontal position of the road to protect, preserve, or meet the requirements of each to the extent practicable.
4.2 Horizontal Alignment
Horizontal alignment, combined with vertical alignment, serves as the primary controlling element associated with the design of all types of public streets and highways. Engineering judgment and experience plays a major role in selecting horizontal geometry that meets desired design criteria. There are a variety of factors that are important in the selection of a horizontal curve or series of curves. In general, the designer should take into account the following considerations:
- Existing environmental and other constraints should be identified on the base mapping to assist the designer in minimizing impacts to wetlands, historical and archaeological features, private and protected property, and permanent structures. To the extent possible, these constraints should serve as boundaries through which the designer must fit the roadway alignment.
- The relationship of the roadway to wetlands and waterways and the interaction of different types of roadway drainage with these resources should be considered.
- Horizontal alignment should be compatible with the selected target speed of the roadway.
- For improvements to existing roadways, geometry should be concentric with and/or parallel to the existing roadway layout so that new impacts to the surrounding area are minimized.
- Horizontal alignment should be as smooth and as direct as possible while responsive to the topography. Flatter curvature with shorter tangents is generally preferable to sharp curves connected by long tangents. Angle points should be avoided.
- Curves with small deflection angles (5 degrees or less) should be long enough to avoid the appearance of a kink. Curves should be 500 feet long for a central angle of 5 degrees and increased 100 feet for each degree decrease in central angle.
- The minimum length of horizontal curves (Lc) should be:
- Lc desirable = 30V for freeways
- Lc minimum = 15V for other major highways
(Where V = design speed in miles per hour and Lc is in feet.)
- The “broken-back” or “flat-back” arrangement of curves (with a short tangent between two curves in the same direction) should be avoided except where very unusual topographical or right-of-way conditions make other alternatives impractical. Except on circumferential highways, most drivers do not expect successive curves to be in the same direction; the preponderance of successive curves in opposite directions may develop a subconscious expectation among drivers that make successive curves in the same direction unexpected. Use of spiral transitions or compound curve alignments, in which there is some degree of continuous superelevation, is preferable for such situations. The term “broken-back” usually is not applied when the connecting tangent is of considerable length. Even in this case, the alignment may be unpleasant in appearance when both curves are clearly visible for some distance ahead.
- Abrupt reversals in alignment should be avoided. Such changes in alignment make it difficult for drivers to keep within their own lane. It is also difficult to superelevate both curves adequately, and erratic operation may result. The distance between reverse curves should be the sum of superelevation runoff lengths and the tangent runout lengths or, preferably, an equivalent length with spiral curves.
- If compound circular curves are required in an effort to fit the highway to the terrain or to other constraints, large differences in radius should be avoided. The radius of the largest curve should not be more than 1.5 times the radius of the smaller curve (except for highway ramps). On ramps, the ratio of the larger curve to the smaller curve should not exceed 2:1.
- The horizontal alignment should be in balance with the vertical profile and cross section rotation associated with superelevation. This is accomplished through the use of a cross sectional analysis. Under this analysis procedure, the alignment is plotted onto the cross section to the lines and grades dictated by the geometry. Should the impacts on the existing topography, private property, environmental areas, etc. be significant for successive cross sections, then modification to the vertical and horizontal geometry should be considered to minimize the impacts, thereby optimizing a balanced geometric design. SeeSection 4.4 for more information regarding the combination of the design of horizontal and vertical alignments.
- Horizontal curves should be avoided on bridges whenever possible. These cause design, construction, and operational problems. Where a curve is necessary on a bridge, a simple curve should be used on the bridge and any curvature or superelevation transitions should be placed on the approaching roadway.
Types of Horizontal Curvature
Normally, in Massachusetts, simple circular curves are used in design; however, compound or spiral curves may be considered throughout the length of a curve to fit the roadway into a constrained corridor. For circular curves the radius definition is used, with design curves expressed to the nearest 20 feet.
Simple Curves
A simple curve has a constant circular radius which achieves the desired deflection without using an entering or exiting transition. This is the most frequently used curve because of its simplicity for design, layout, and construction as shown in Figure 4‑1.
Figure 4-1: Simple Circular Curve
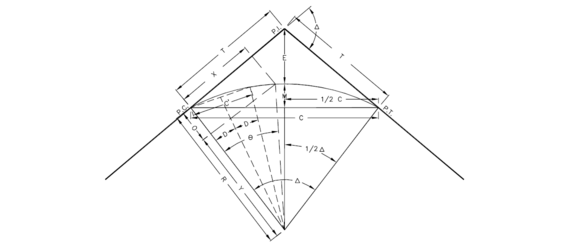
Source: MassDOT
- R = Radius
- C = Long Chord
- C' = Any Chord Length
- M = Middle Ordinate
- L = Length of Arc
- E = External Distance
- Δ = Intersection Angle = Central Angle
- D = Deflection Angle for Chord C'
- T = Length of Tangent
- O = Tangent Offset
- P.C. = Point of Curvature
- P.I. = Point of Intersection
- P.T.= Point of Tangency
- X = Distance Along Tangent
FORMULAS
- T = R tan(Δ/2)
- C = 2R sin(Δ/2)
- E = R (sec(Δ/2) - 1)
- M = R(1 - cosΔ/2)
- L = (Δ/360) (2πR)
- sinD = 1/2 ÷ C'R
TANGENT OFFSET METHODS
- Sin Ɵ = X/R
- 0 = R - (R2 - X2)0.5
- Y = R cos Ɵ
- 0 = R - Y
Elements of a horizontal curve:
- ∆ DELTA (Central Angle). The value of the central angle is equal to the intersection angle.
- R RADIUS. The radius of the circle of which the curve is an arc, or segment. The radius is always perpendicular to back and forward tangents.
- PI POINT OF INTERSECTION. The point of intersection is the theoretical location where the two tangents meet.
- PT POINT OF TANGENCY. The point of tangency is the point on the forward tangent where the curve ends. It is sometimes designated as EC (end of curve) or CT (curve to tangent).
- PC POINT OF CURVATURE. The point of curvature is the point on the back tangent where the circular curve begins. It is sometimes designated as BC (beginning of curve) or TC (tangent to curve).
- POC POINT ON CURVE. The point on curve is any point along the curve.
- L LENGTH OF CURVE. The length of curve is the distance from the PC to the PT, measured along the curve.
- T TANGENT. The length of tangent is the distance along the tangents from the PI to the PC or the PT. These distances are equal on a simple curve.
- C LONG CHORD. The long chord is the straight-line distance from the PC to the PT. Other types of chords are designated as follows:
- c The subchord distance between the PC and the first station on the curve.
- C’ Any chord distance between two points along a curve.
- E EXTERNAL DISTANCE. The external distance (also called the external secant) is the distance from the PI to the midpoint of the curve. The external distance bisects the interior angle at the PI.
- HSO HORIZONTAL SIGHTLINE OFFSET. The horizontal sightline offset is the distance from the midpoint of the curve to the midpoint of the long chord. The extension of the horizontal sightline offset bisects the central angle.
- D DEFLECTION ANGLE. The deflection angle for chord C’.
At a minimum, curve data shown on the drawings should include the radius, length of curve, central angle, and tangent length. Plan information should also include the stations at the PC and PT.
Reverse Curves
A reverse curve consists of two simple curves joined together, but curving in opposite directions. For safety reasons, the use of this curve should be avoided when possible. As with broken back curves, drivers do not expect to encounter this arrangement on typical highway geometry. Such changes in alignment make it difficult for drivers to keep within their own lane. It is also difficult to superelevate both curves adequately, and erratic operation may result. The distance between reverse curves should be the sum of superelevation runoff lengths and the tangent runout lengths or, preferably, an equivalent length with spiral curves.
Compound Curves
Compound curves are a series of two or more simple curves with deflections in the same direction immediately adjacent to each other. Compound curves are used to transition into and from a simple curve and to avoid some control or obstacle which cannot be relocated. The following guidelines should be followed when using compound curves:
- Compound curves are appropriate for intersection curb radii, interchange ramps, and transitions into sharper curves.
- As the curvature becomes successively sharper, the radius of the flatter circular arc should not be more than 50 percent greater than that of the sharper arc.
- Superelevating compound curves requires careful consideration.This is discussed in the section "Maximum Superelevation Rates and Minimum Curve Radii."
- Figure 4-2 and Figure 4-3 illustrate a typical compound curve layout and design for compound curvature transition.
Minimum Radius of Horizontal Curvature
The values for horizontal curvature are derived from the design speed, superelevation rate, and side friction factors. The basic equation is:
Rmin = [V2/15(0.01eMAX + ƒMAX)]
Where:
- RMIN = minimum radius of curve, feet
- e = superelevation rate*
- e = 6.0% is the maximum rate used in the Commonwealth of Massachusetts
- f = side friction factor (see the AASHTO Green Book for values)
- V = vehicle speed, mph
The design values derived from the equation above are dependent upon selection of superelevation rates as described in the section "Maximum Superelevation Rates and Minimum Curve Radii."
Figure 4‑2: Compound Curve Layout
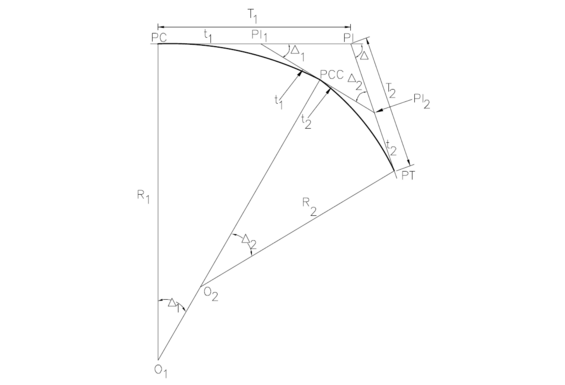
Source: MassDOT
FORMULAS
- PI - PI1 = sin [Δ2 (t1 + t2) / sin Δ]
- PI - PI2 = sin [Δ2 (t1 + t2) / sin Δ]
- T1 = t1 + PI - PI1
- T2 = t2 + PI - PI2
- L1 = (Δ1/360) (2πR1)
- L2 = (Δ2/360) (2πR2)
- HSO = R1 (1 - cos Δ1/2)
- HSO = R2 (1 - cos Δ2/2)
- Δ = Δ1 + Δ2
- Δ2 = Δ - Δ1
- t1 = R1 tan(Δ1/2)
- t2 = R2 tan(Δ2/2)
- C1 = 2R1 sin(Δ1/2)
- C2 = 2R2 sin(Δ2/2)
- E1 = R1 (sec(Δ1/2) - 1)
- E2 = R2 (sec(Δ2/2) - 1)
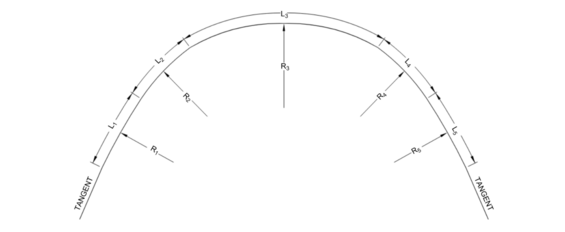
Figure 4-3: Compound Curvature Transition
Source: MassDOT
In Figure 4-3, the length of each curve is computed as follows:
Ln = The greater of:
a) Three seconds running time at the design speed.
b) The length of runoff plus the length of tangent runout, or
c) The length of runoff plus the length required to superelevate to curve R1.
L1 = The greater of:
a) Three seconds running time at the design speed.
b) The length to superelevate Curve R1 and R.
L= The greater of:
a) Three seconds running time at the design speed.
b) Two times the length required to superelevate to curve R or
c) A minimum length of 350 ft.
Table 4-1: Minimum Allowable Radii without Transition by Design Speed
| Design Speed (MPH) | Radius (ft) |
|---|---|
| 50 | 3940 |
| 55 | 4600 |
| 60 | 6560 |
| 70 | 6560 |
| 75 | 8200 |
Source: MassDOT
Where the horizontal curves are of radii less than “R” shown in the table above:
- Curves R1…Rn are introduced for the purpose of making the transition from the tangent to sharpest curve “R”.
- Curves R1… Rn are compounded with “R”.
- The radius of curves R1 … Rnis to be no more than 1.5 times the radius of the preceding flatter curve, i.e. R1 ≤ 1.5R.
- The curves are increased in radius until “Rn” is at least equal to the values indicated for the respective speeds shown on the table above.
- Superelevation should be developed as discussed in the section “Superelevation.”.
Horizontal Stopping Sight Distance
Horizontal sight distance on the inside of a curve is limited by obstructions such as buildings, hedges, wooded areas, walls, abutments, cut slopes, headlights, vertical curvature, or other topographic features. A comprehensive field survey should identify these obstructions on the critical cross sections and on the base plans.
Safe sight distance must be provided on the inside of horizontal curves to allow the driver sufficient brake reaction time to bring the vehicle to a stop. Obstructions which interfere with the needed sight distance should be moved or removed, if possible. If the obstruction cannot be removed, consideration should be given to realigning the road (horizontal and/or vertical) or providing appropriate warning signage.
On horizontal curves, a designer must provide a horizontal sightline offset (HSO), also referred to as middle ordinate, between the center of the inside lane and the sight obstruction. The basic equation is:
HSO = R[(1 - cos 28.65S/R)]
Where:
- HSO = horizontal sightline offset, or distance from the center of the inside lane to the obstruction, feet.
- R = radius of curve, feet.
- S = sight distance, feet.
Figure 4-4 illustrates the concept of a horizontal sightline offset and its impact on sight distance around a curve.
Figure 4-4: Sight Distance on a Curve
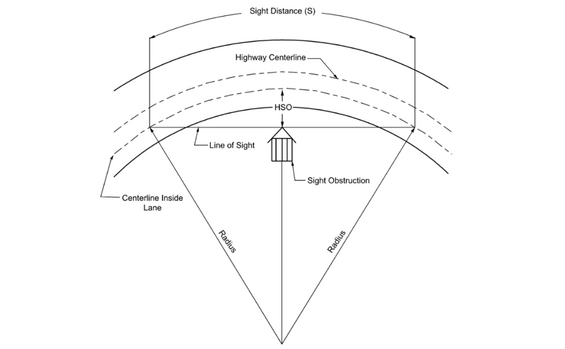
Source: A Policy on Geometric Design of Highways and Streets, AASHTO, 2018. Chapter 3 Elements of Design, Figure 3-13
The designer should consider the following:
- Figure 4-5 is a design chart showing the horizontal sight line offset (middle ordinate) needed for clear sight areas that satisfy stopping sight distance criteria presented in Table 3-8 for horizontal curves of various radii. The designer should make every practical effort to achieve the stopping sight distance criterion.
- The stopping sight distance is based on eye height of 3.5 feet and object height of 2 feet. The line-of-sight intercept with the view obstruction is at the midpoint of the sight line and 2.75 feet above the center of the inside lane.
- If a designer concludes that decision sight distance is needed, greater distance will have to be provided. Chapter 3 discusses those highway conditions where decision sight distance is appropriate and provides procedures for determining the distance. The calculated value would then be used in the basic equation for determining the horizontal sightline offset on the horizontal curve. Also, refer to Chapter 3 in the AASHTO Green Book for further information.
- Normally, it is not practical to provide passing sight distance on horizontal curves. These values yield very large numbers for the horizontal sightline offset. Passing should not be allowed where passing sight distance cannot be achieved.
Figure 4-5: Horizontal Sightline Offset (HSO) to Provide Stopping Sight Distance on Horizontal Curves
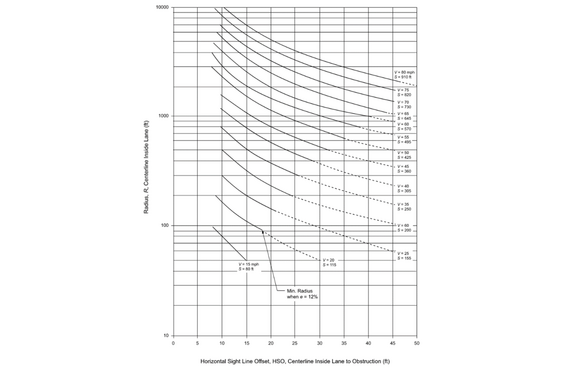
Source: A Policy on Geometric Design of Highways and Streets, AASHTO, 2018. Chapter 3 Elements of Design, Figure 3-14
Figure 4-6 illustrates the method of ensuring adequate sight distance in cut sections.
Figure 4-6: Method of Cutting Slope for Horizontal Sight Distance
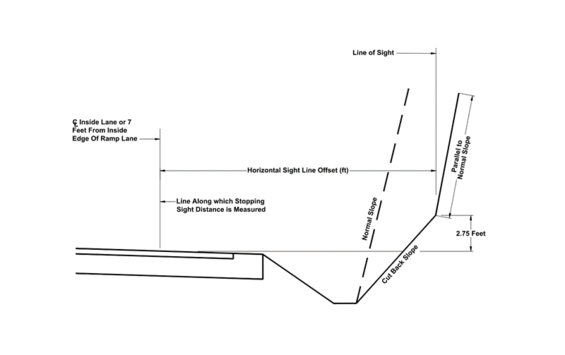
Source: MassDOT
Superelevation
Superelevation is the banking of a roadway around a curve as illustrated in Figure 4-7. The purpose of employing superelevation of the roadway cross section is to counterbalance the centrifugal force, or outward pull, of a vehicle traversing a horizontal curve. Side friction developed between the tires and the road surface also counterbalances the outward pull of the vehicle. A combination of these two concepts allows a vehicle to negotiate curves safely at higher speeds than would otherwise be possible.
Figure 4-7: Superelevation for Left and Right Turning Curves
Source: MassDOT
Right Turning Curve - The Left Edge of the Roadway is Higher than the Right Edge. The Surface Slopes Down to the Inside of the Curve.
Left Turning Curve - The Right Edge of the Roadway is Higher than the Left Edge. The Surface Slopes Down to the Inside of the Curve.
Incorporating superelevation into a roadway’s design may allow for the use of curves to avoid roadside obstacles which would otherwise be impacted by the alignment. In contrast, superelevation may not be desirable for low-speed roadways to help limit excessive speeds or in urban settings to limit impacts to abutting uses, drainage systems, and utilities. Moreover, superelevation may not be desirable when considering pedestrian or bicycle accommodations along the roadway segment. Like other roadway design elements, designers must consider the trade-offs of introducing superelevation in a roadway’s design.
The maximum useable rate for superelevation (emax) is controlled by several factors: climate conditions, terrain conditions, type of area, and the frequency of slow-moving vehicles. Because of winter snow and icing conditions, the rate of superelevation should not exceed the rate on which a vehicle standing or traveling slowly would slide toward the center of the curve when the pavement is icy; therefore, the maximum rate of superelevation (emax) used in Massachusetts is 6.0 percent. On roadways with lower design speeds (less than 45 mph), designing without superelevation is often acceptable because the outward pull of a vehicle negotiating a curve is lower.
Maximum Superelevation Rates and Minimum Curve Radii
Table 4‑2 provides minimum curve radii for common superelevation rates of 4 percent and 6 percent across a range of design speeds. The values in the table are minimum radii possible with rates of superelevation commonly used in undeveloped or lightly-developed areas (Rural Natural, Rural Developed, Rural Village, and Suburban Low Intensity). The designer should provide flatter curves wherever possible. It may be necessary to provide flatter curvature when the minimum radius will not provide the necessary stopping sight distance due to sight line obstructions along the edges of the roadway (See the "Superelevation"section).
Although superelevation is advantageous for traffic operation, various factors often combine to make its use impractical in many built-up areas (such as Suburban High Intensity, Suburban Town Centers and Urban Areas). Such factors include wide pavement areas, the need to meet the grade of adjacent property, surface drainage considerations, and frequency of cross streets, alleys, and driveways. Therefore, horizontal curves on low-speed roadways in urban areas may be designed without superelevation, counteracting the centrifugal force solely with side friction. Designing without superelevation is often a suitable design practice for low-speed roadways (less than 45 mph). If site specific conditions allow, designers should avoid using a superelevation to the extent possible for design speeds of 35 mph or less and use a normal crown in the roadway cross-section.
Table 4-2: Minimum Design Radii for Common Superelevation Rates
Design Speed (MPH) | Minimum Design Radius (ft) with e = 4% | Minimum Design Radius (ft) with e = 6% |
|---|---|---|
| 15 | 45 | 40 |
| 20 | 90 | 85 |
| 25 | 155 | 145 |
| 30 | 250 | 235 |
| 35 | 375 | 340 |
| 40 | 535 | 485 |
| 45 | 715 | 645 |
| 50 | 930 | 835 |
| 55 | 1190 | 1060 |
| 60 | 1500 | 1330 |
| 65 | Not Permitted | 1660 |
| 70 | Not Permitted | 2040 |
| 75 | Not Permitted | 2500 |
Note: For design speeds less than 35 mph, designers should avoid using superelevation to the extent possible. In recognition of safety considerations, use of emax= 4% should be limited to developed areas (such as suburban high intensity, suburban town centers, and urban areas). Radii are rounded to the nearest 5 feet.
Source: Adapted from A Policy on Geometric Design of Highways and Streets, AASHTO, 2018 Chapter 3 Elements of Design, Table 3-7
The minimum radius or sharpest curve without superelevation is reached when the side friction factor developed to counteract centrifugal force and adverse cross slope reaches the maximum allowable value based on safety and comfort considerations. For travel on sharper curves or at higher speeds, superelevation is needed. A maximum superelevation rate of 4.0 percent is commonly used. A maximum superelevation rate of 6.0 percent may be justified on sharper curves where adequate transition lengths are available.
For roadways in areas with design speeds of 45 mph and below, Table 4-3 provides the minimum radii for 2.0 percent, 0 percent, and -2.0 percent (no superelevation) rates of superelevation. The 2.0 percent column represents the situation where the normal pavement crown is replaced with a consistent 2.0 percent cross slope.
Table 4-3: Minimum Radius (ft) with Low or No Superelevation
| Design Speed (MPH) | e = -2.0% | e = 0% | e = 2.0% |
|---|---|---|---|
| 15 | 50 | 50 | 45 |
| 20 | 110 | 100 | 95 |
| 25 | 200 | 185 | 170 |
| 30 | 335 | 300 | 275 |
| 35 | 510 | 455 | 410 |
| 40 | 765 | 670 | 595 |
| 45 | 1040 | 900 | 795 |
Note: Radii are rounded up to the nearest 5 feet for e = percent superelevation. For design speeds less than 35 mph, designers should avoid using superelevation to the extent possible.
Source: Adapted from A Policy on Geometric Design of Highways and Streets, AASHTO, 2018 Chapter 3 Elements of Design, Table 3-13
Superelevation Transitioning
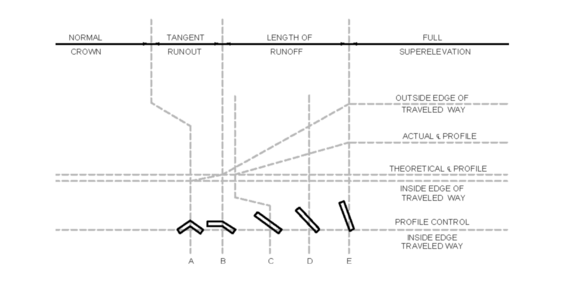
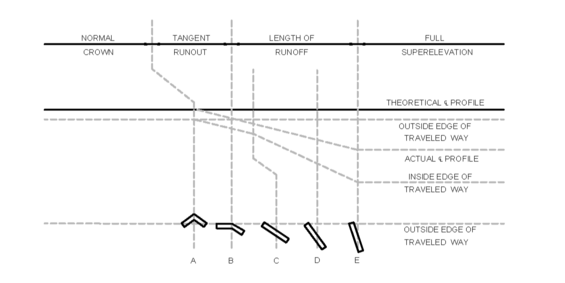
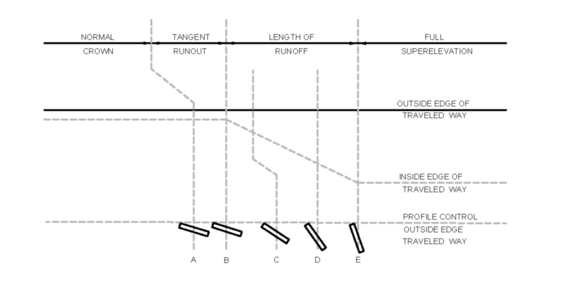
The development of superelevation on a horizontal curve requires a transition from a normal crown section, which is accomplished by rotating the pavement. The pavement may be rotated about the centerline or either edge of the travel lanes.
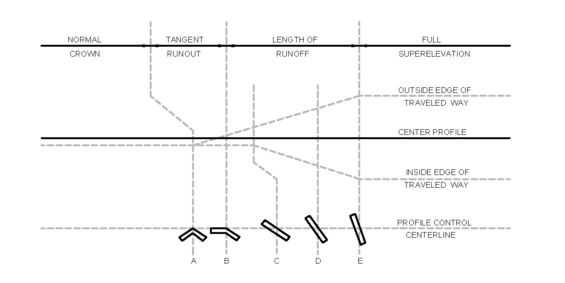
There are five basic cross section controls — (A) through (E) — involved in transitioning the pavement to obtain full superelevation illustrated in Figure 4-8.
- Cross section (A) is the normal crown section where the transitioning begins.
- Cross section (B) is reached by rotating half the pavement until it is level.
- Cross section (C) is attained by continuing to rotate the same half of pavement until a plane section is attained across the entire pavement section, at a cross slope equal to the normal crown slope.
- Cross section (D) is the rate of the cross slope at any intermediate cross section between (C) and (E) is proportional to the distance from Cross section (E).
- Cross section (E) is achieved by further rotation of the planar section, the entire pavement section, to attain the full superelevation at a cross slope equal to (e).
Figure 4-8: Five Cross Section Controls (Crowned Traveled Way Revolved About Centerline)
Source: Adapted from A Policy on Geometric Design of Highways and Streets, AASHTO, 2018. Chapter 3 Elements of Design, Figure 3-8
Superelevation runoff is the general term denoting the length of highway needed to accomplish the change in cross slope from a section with adverse crown removed (B) to a fully superelevated section (E), or vice versa.
Tangent runout is the general term denoting the length of highway needed to accomplish the change in cross slope from a normal section (A) to a section with the adverse crown removed (B), or vice versa.
Design Considerations
- Superelevation is introduced or removed uniformly over the lengths required for comfort and safety.
- Place approximately two-thirds of the superelevation runoff on the tangent section and one-third on the horizontal curve.
- Angular breaks occur in the vertical profile in the superelevation transition areas. To smooth these breaks, when the vertical angle points are greater than 1%, short vertical curves are required. The minimum vertical curve length in feet can be used as numerically equal to the 5.3 times the design speed in mph. Greater lengths should be used where possible.
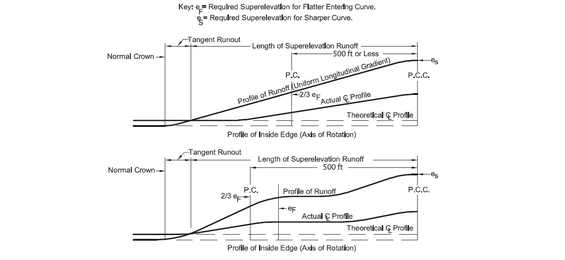
- On compound curves the following criteria should be met:
- Full superelevation for the sharpest curve should be attained at the PCC.
- If the flatter entering curve is less than or equal to 500 feet, a uniform longitudinal gradient should be used throughout the transition.
- If the flatter entering curve is longer than 500 feet, it may be preferable to consider the two curves separately. Superelevation for the entering curve would be developed by the 2/3-1/3 distribution method. This rate would be maintained until it is necessary to develop the remaining superelevation for the sharper curve.
Figure 4-9 illustrates the two transition methods for compound curves.
Figure 4-9: Superelevation on Compound Curves
Source: MassDOT
- The minimum superelevation runoff lengths for roadways wider than two lanes should be as follows:
- Three-lane traveled ways; 1.25 times the corresponding length for two-lane traveled ways.
- Four-lane undivided traveled ways; 1.5 times the corresponding length for two-lane traveled ways.
- Six-lane undivided traveled ways; 2.0 times the corresponding length for two-lane traveled ways.
Axis of Rotation
To attain superelevation an axis must be selected about which the pavement is rotated. In general there are four methods that may be selected:
- Rotation about the centerline profile of traveled way. This is generally the preferred method for two-lane and undivided multilane roadways and when the elevations of the outside of roadway must be held within critical limits, such as in an urban area to minimize the impact on adjacent properties. This is also the method that distorts the edge line profiles the least. Figure 4-10 graphically demonstrates how the roadway superelevation is developed for this method.
- Rotation about the inside-edge profile of traveled way. This is generally the preferred method when the lower edge profile is of concern, such as when the profile is flat and the inside edge of the roadway needs to be controlled for drainage purposes. Figure 4-11 graphically demonstrates how the roadway superelevation is developed for this method. This method is suitable for ramps.
- Rotation about the outside edge profile of traveled way. This method is similar to inside edge rotation except that the change is effected below the outside edge profile instead of above the inside edge profile. This method is used when the higher edge profile is critical, such as on divided highways where the median edge profiles are held. Figure 4-12 graphically demonstrates how the roadway superelevation is developed for this method.
- Rotation about the outside edge profile of traveled way when the roadway has a straight cross-slope at the beginning of transition ( -a- ). The outside edge rotation is shown because this point is most often used for rotation of two-lane one-way roadways, with profile along the median edge of traveled way or for the traveled way having a typical straight cross-slope. Figure 4-13 graphically demonstrates how the roadway superelevation is developed for this method.
Figure 4-10: Banking Undivided Highways – Rotation Around Centerline

Source: Adapted from A Policy on Geometric Design of Highways and Streets, AASHTO, 2018. Chapter 3 Elements of Design, Figure 3-8A
Figure 4-11: Banking Undivided Highways – Rotation About Inside Edge
Source: Adapted from A Policy on Geometric Design of Highways and Streets, AASHTO, 2018. Chapter 3 Elements of Design, Figure 3-9B
Figure 4-12: Banking Undivided Highways – Rotation About Outside Edge
Source: Adapted from A Policy on Geometric Design of Highways and Streets, AASHTO, 2018. Chapter 3 Elements of Design, Figure 3-8C
Figure 4-13: Undivided Highways – Straight Cross Slope, Rotation About Outside Edge
Source: Adapted from A Policy on Geometric Design of Highways and Streets, AASHTO, 2018. Chapter 3 Elements of Design, Figure 3-8D
On a divided highway with a wide median, rotate each road separately and provide a compensating slope in the median. When using the centerline profile or the outside edge as axis of rotation, the designer should evaluate the resulting edge profile of the low edge of sag and crest curves to ensure that positive drainage is preserved.
Shoulder Superelevation
All outside shoulders of 5.0 feet or greater should slope away from the travel lanes on superelevated curves as illustrated in Figure 4-14. The grade break occurs 1.0 feet outside the lane line; therefore, the first foot of all shoulders should always slope with the adjacent travel lane. The maximum algebraic difference between the travel lane slope and outside shoulder slope ("rollover") is 0.09 ft/ft.
All outside shoulders less than 5.0 feet should slope in the same direction as the adjacent travel lane.
Figure 4-14: Highway with Paved Shoulders
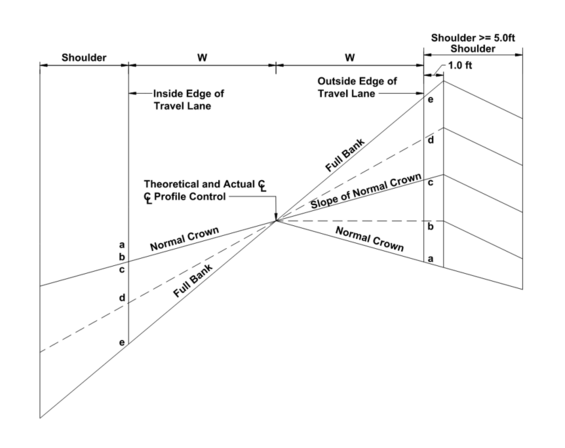
Source: MassDOT
Note: Shoulder treatments are typical for all methods of superelevation. Shoulders less than 5.0 ft. wide should slope in the same direction as the travel lane. "Roll–over" between travel lane and shoulder cannot exceed 0.09.
Divided Highways with Medians
Divided highways with medians require special consideration.
- Medians of less than 10 feet – To minimize the distortion between the two outside edges of the median, the center of the cross section may be used as the axis, with the whole roadway rotated about the center line of the median as a plane section. This method is limited to moderate superelevation rates.
- Medians wider than 10 feet – Where both roadways are crowned separately, the axis of rotation should be at the median edges for each side of the roadway, or the gutter lines where applicable. In this case the median is held in a horizontal plane. This method is illustrated in Figure 4-15.
- Medians wider than 40 feet – It may be preferable to develop the superelevation on each roadway independently with medians greater than 40 feet. The rotation may be made for each side of the roadway using any of the methods illustrated in Figures 4-10 to 4-14 as considered appropriate by the designer.
Figure 4-15: Banking Divided Highways – Rotation About Median Edge
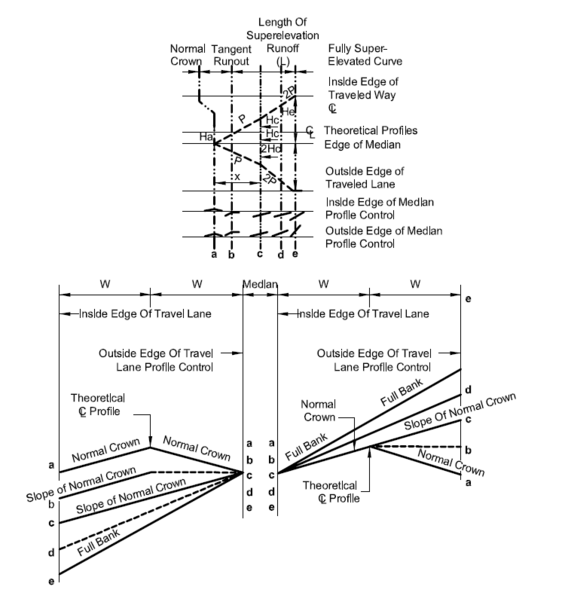
Source: MassDOT
Equations:
- Ha = 8 x W
- Ho = 8 x W
- He = 2 x e x W
- P = (e x W) / L
- Tangent Runout = Ha / P
- X = 2 x tangent runout
- 2P = 2 x P
Where:
- W = Width of travel lanes(s) from CL
- S = Normal cross slope
- e = Superelevation rate at full bank
- L = Length of runoff
- P = Rate of transition
Superelevation Design and Superelevation Runoff Lengths
As it is desirable to select a curve radius larger than the minimum, the design superelevation rate needs to be selected for the actual radius used and the selected design speed. Table 4-4 provides the design superelevation rates (for an undivided highway banked around the centerline) for a range of curve radii and design speeds with maximum superelevation of 6.0 percent.
Table 4-5 and Table 4-6 provides superelevation runoff lengths for a variety of design superelevations and design speeds, both for two-lane and four-lane cross-sections.
Table 4-4 may also be used to calculate the minimum desirable length of tangent between two reversing curves of minimum radii. The superelevation rate of zero may be used to determine the intervening length of tangent between reversing curves even if neither is superelevated. Because two-thirds of the maximum superelevation should be provided at the PC and PT of the curves, the minimum tangent length is two-thirds of the sum of the superelevation runoff lengths.
Superelevation runoff lengths should be long enough so that the rate of change (slopes) of the edges of pavement relative to the centerline does not exceed empirically developed controls. These maximum relative gradients, which provide a minimum length of runoff, are given in Table 4-7. The following equation should be used to compute the minimum superelevation runoff length:
Lr = [(wn1)ed/Δ](bw)
Where:
Lr = minimum length of superelevation runoff, ft
w = width of one travel lane, ft
n1 = number of lanes rotated
ed = design superelevation rate, percent
bw = adjustment factor for number of lanes rotated
∆ = maximum relative gradient, percent
The length of tangent runout is determined by the amount of adverse cross slope to be removed and the rate at which it is removed. To achieve a smooth edge of pavement profile, the rate of removal should equal the relative gradient used to define the superelevation runoff length. Based on this rationale, the following equation should be used to compute the minimum tangent runout length:
Lt = (eNC/ed)(Lr)
Where:
Lt = minimum length of tangent runout, ft
eNC = normal cross slope rate, percent
ed = design superelevation rate, percent
Lr = minimum length of superelevation runoff, ft
Spiral Curve Transitions
Any motor vehicle follows a transition path as it enters or leaves a circular horizontal curve. The steering change and the consequent gain or loss of lateral force cannot be achieved instantly. For most curves, the average driver can follow a suitable transition path within the limits of normal lane width. However, combinations of high speed and sharp curvature lead to longer transition paths, which can result in shifts in lateral position and sometimes actual encroachment on adjoining lanes. In such instances, incorporation of transition spiral curves between the tangent and the sharp circular curve, as well as between circular curves of substantially different radii, may be appropriate to make it easier for a driver to keep the vehicle within its own lane.
The principal advantages of transition curves in horizontal alignment are the following:
- A properly designed transition spiral curve provides a natural, easy-to-follow path for drivers, such that the lateral force increases and decreases gradually as a vehicle enters and leaves a circular curve. Transition spiral curves minimize encroachment on adjoining traffic lanes and tend to promote uniformity in speed. A spiral transition curve simulates the natural turning path of a vehicle.
- The spiral transition curve length provides a suitable location for the superelevation runoff. The transition from the normal pavement cross slope on the tangent to the fully superelevated section on the curve can be accomplished along the length of the spiral transition curve in a manner that closely fits the speed-radius relationship for vehicles traversing the transition. Where superelevation runoff is introduced without a transition curve, usually partly on the curve partly on the tangent, the driver approaching the curve may need to steer opposite to the direction of the approaching curve when on the superelevated tangent portion to keep the vehicle within its lane.
- A spiral transition curve also facilitates the transition in width where the traveled way is widened on a circular curve. Use of spiral transitions provide flexibility in accomplishing the widening of sharp curves.
- The appearance of the highway or street is enhanced by applying spiral transition curves. The use of spiral transitions avoids noticeable breaks in the alignment as perceived by drivers at the beginning and the end of circular curves. Such breaks are more prominent with the presence of superelevation runoff.
For more information on spiral curve design, see Chapter 3 of the AASHTO Green Book.
Table 4-4: Minimum Radii for Design Superelevation Rates, Design Radius and Design Speeds (emax = 6%), in feet
| e (%) | Vd = 15 mph | Vd = 20 mph | Vd = 25 mph | Vd = 30 mph | Vd = 35 mph | Vd = 40 mph | Vd = 45 mph | Vd = 50 mph | Vd = 55 mph | Vd = 60 mph | Vd = 65 mph | Vd = 70 mph |
|---|---|---|---|---|---|---|---|---|---|---|---|---|
| NC | 868 | 1580 | 2290 | 3130 | 4100 | 5230 | 6480 | 7870 | 9410 | 11100 | 12600 | 14100 |
| RC | 614 | 1120 | 1630 | 2240 | 2950 | 3770 | 4680 | 5700 | 6820 | 8060 | 9130 | 10300 |
| 2.2 | 543 | 991 | 1450 | 2000 | 2630 | 3370 | 4190 | 5100 | 6110 | 7230 | 8200 | 9240 |
| 2.4 | 482 | 884 | 1300 | 1790 | 2360 | 3030 | 3770 | 4600 | 5520 | 6540 | 7430 | 8380 |
| 2.6 | 430 | 791 | 1170 | 1610 | 2130 | 2740 | 3420 | 4170 | 5020 | 5950 | 6770 | 7660 |
| 2.8 | 384 | 709 | 1050 | 1460 | 1930 | 2490 | 3110 | 3800 | 4580 | 5440 | 6200 | 7030 |
| 3.0 | 341 | 635 | 944 | 1320 | 1760 | 2270 | 2840 | 3480 | 4200 | 4990 | 5710 | 6490 |
| 3.2 | 300 | 566 | 850 | 1200 | 1600 | 2080 | 2600 | 3200 | 3860 | 4600 | 5280 | 6010 |
| 3.4 | 256 | 498 | 761 | 1080 | 1460 | 1900 | 2390 | 2940 | 3560 | 4250 | 4890 | 5580 |
| 3.6 | 209 | 422 | 673 | 972 | 1320 | 1740 | 2190 | 2710 | 3290 | 3940 | 4540 | 5210 |
| 3.8 | 176 | 358 | 583 | 864 | 1190 | 1590 | 2010 | 2490 | 3040 | 3650 | 4230 | 4860 |
| 4.0 | 151 | 309 | 511 | 766 | 1070 | 1440 | 1840 | 2300 | 2810 | 3390 | 3950 | 4550 |
| 4.2 | 131 | 270 | 452 | 684 | 960 | 1310 | 1680 | 2110 | 2590 | 3140 | 3680 | 4270 |
| 4.4 | 116 | 238 | 402 | 615 | 868 | 1190 | 1540 | 1940 | 2400 | 2920 | 3440 | 4010 |
| 4.6 | 102 | 212 | 360 | 555 | 788 | 1090 | 1410 | 1780 | 2210 | 2710 | 3220 | 3770 |
| 4.8 | 91 | 189 | 324 | 502 | 718 | 995 | 1300 | 1640 | 2050 | 2510 | 3000 | 3550 |
| 5.0 | 82 | 169 | 292 | 456 | 654 | 911 | 1190 | 1510 | 1890 | 2330 | 2800 | 3330 |
| 5.2 | 73 | 152 | 264 | 413 | 595 | 833 | 1090 | 1390 | 1750 | 2160 | 2610 | 3120 |
| 5.4 | 65 | 136 | 237 | 373 | 540 | 759 | 995 | 1280 | 1610 | 1990 | 2420 | 2910 |
| 5.6 | 58 | 121 | 212 | 335 | 487 | 687 | 903 | 1160 | 1470 | 1830 | 2230 | 2700 |
| 5.8 | 51 | 106 | 186 | 296 | 431 | 611 | 806 | 1040 | 1320 | 1650 | 2020 | 2460 |
| 6.0 | 39 | 81 | 144 | 231 | 340 | 485 | 643 | 833 | 1060 | 1330 | 1660 | 2040 |
Source: A Policy on Geometric Design of Highways and Streets, AASHTO, 2018. Chapter 3 Elements of Design, Table 3-9
Table 4-7: Maximum Relative Gradients
| Design Speed (mph) | Maximum Relative Gradient (%) | Equivalent Maximum Slope |
|---|---|---|
| 20 | 0.80 | 1:125 |
| 25 | 0.73 | 1:138 |
| 30 | 0.67 | 1:150 |
| 35 | 0.62 | 1:163 |
| 40 | 0.57 | 1:175 |
| 45 | 0.53 | 1:188 |
| 50 and higher | 0.50 | 1:200 |
Source: Adapted from A Policy on Geometric Design of Highways and Streets, AASHTO, 2018 Chapter 3 Elements of Design
4.3 Vertical Alignment
Roadway vertical alignment is controlled by design speed, topography, traffic volumes and composition, highway functional classification, safety, sight distance, typical sections, horizontal alignment, climate, vertical clearances, drainage, economics, and aesthetics. In general, the designer should consider the following:
- In level terrain, the designer’s ability to efficiently satisfy the design controls can be accomplished without construction difficulty or extraordinary expense; however, as the terrain becomes more challenging, as in rolling or mountainous terrain and developed areas, significantly more complicated construction techniques must be employed to achieve compatibility between the road alignment and the surrounding ground. Introducing vertical curves to minimize the disruption to the existing environment may result in sight distance or clearance issues and may require truck climbing lanes for higher-speed facilities. The designer must balance these factors when introducing vertical curves into a roadway alignment.
- Where a highway crosses a waterway the profile of the highway must be consistent with the design flood frequency and elevation. (See Chapter 8 Drainage and Erosion Control).
- The roadway elevation must provide sufficient clearance and cover for construction of culverts and other components of the drainage system.
- When a highway is located where environmental resources exist the vertical alignment should be designed to minimize impacts.
- Vertical alignment should be properly coordinated with the natural topography, available right-of-way, utilities, roadside development, and natural and man-made drainage patterns.
- Vertical alignment should be compatible with the selected target speed of the roadway.
Grades
Roadway grades have a direct correlation to the uniform operation of vehicles. Vehicle weight and the steepness of the roadway grade have a direct relationship on the ability of the driver to maintain uniform speed. Table 4-8, Table 4-9, Table 4-10, Table 4-11, Table 4-12 and Table 4-13 present the recommended maximum roadway grades for achieving uniform vehicular operation for various design speeds. Flatter grades should be used where possible.
On a long ascending grade it is preferable to place the steepest grade at the bottom and flatten the grade near the top. To facilitate positive roadway drainage, the roadway must have a minimum longitudinal tangent gradient of 0.4% and preferably 0.5%.
Maximum grade recommendations are presented for the area types described in Chapter 3 and vary depending upon the terrain in which the facility is located. For most locations in Massachusetts, the level or rolling terrain category is applicable.
Where pedestrian or bicycle facilities follow a roadway alignment, these facilities should follow the prevailing grade of the adjacent roadway. See Chapter 11 for design guidance on facilities in separate rights-of-way. If bicycles share the roadway with motor vehicles, consideration should be given to providing extra width or a bicycle climbing lane on the uphill side. A designated bicycle lane may not be necessary on a downgrade where bicyclists travel as fast (or nearly as fast) as motor vehicles.
Grades on shared facilities should be carefully considered to accommodate all modes of intended transportation.
In addition to the maximum grade, the designer must consider the length of the grade. The gradient in combination with its length will determine the truck speed reduction on upgrades. Figure 4-16 shows how a typical heavy truck, approaching a grade at a given speed, loses speed as it travels along the length of the grade. For general design purposes, a 10-mph speed reduction should be used.
Table 4-8: Recommended Maximum Grades for Freeways (All Areas)
| Terrain | 50 mph | 55 mph | 60 mph | 65 mph | 70 mph | 75 mph |
|---|---|---|---|---|---|---|
| Level | 4% | 4% | 3% | 3% | 3% | 3% |
| Rolling | 5% | 5% | 4% | 4% | 4% | 4% |
| Mountainous | 6% | 6% | 5% | - | - |
Note: Grades 1% steeper than the value shown may be provided in mountainous terrain or in urban areas with crucial right- of-way controls.
Table 4-9: Recommended Maximum Grades for Arterials and Highways (Rural Villages, Suburban High-Intensity, Suburban Town Center, and Urban Areas)
| Terrain | 30 mph | 35 mph | 40 mph | 45 mph | 50 mph | 55 mph | 60 mph |
|---|---|---|---|---|---|---|---|
| Level | 8% | 7% | 7% | 6% | 6% | 5% | 5% |
| Rolling | 9% | 8% | 8% | 7% | 7% | 6% | 6% |
| Mountainous | 11% | 10% | 10% | 9% | 9% | 8% | 8% |
Table 4-10: Recommended Maximum Grades for Arterials and Highways (Rural Natural, Rural Developed, and Suburban Low Intensity Areas)
| Terrain | 40 mph | 45 mph | 50 mph | 55 mph | 60 mph |
|---|---|---|---|---|---|
| Level | 5% | 5% | 4% | 4% | 3% |
| Rolling | 6% | 6% | 5% | 5% | 4% |
| Mountainous | 8% | 7% | 7% | 6% | 6% |
Table 4-11: Recommended Maximum Grades for Collectors and Local Roads (Rural Villages, Suburban High-Intensity, Suburban Town Center, and Urban Areas)
| Terrain | 20 mph | 25 mph | 30 mph | 35 mph | 40 mph | 45 mph | 50 mph | 55 mph | 60 mph |
|---|---|---|---|---|---|---|---|---|---|
| Level | 9% | 9% | 9% | 9% | 9% | 8% | 7% | 7% | 6% |
| Rolling | 12% | 12% | 11% | 10% | 10% | 9% | 8% | 7% | 7% |
| Mountainous | 14% | 13% | 12% | 12% | 12% | 11% | 10% | 10% | 9% |
Table 4-12: Recommended Maximum Grades for Collectors (Rural Natural, Rural Developed, and Suburban Low Intensity Areas)
| Terrain | 20 mph | 25 mph | 30 mph | 35 mph | 40 mph | 45 mph | 50 mph | 55 mph | 60 mph |
|---|---|---|---|---|---|---|---|---|---|
| Level | 7% | 7% | 7% | 7% | 7% | 7% | 6% | 6% | 5% |
| Rolling | 10% | 10% | 9% | 9% | 8% | 8% | 7% | 7% | 6% |
| Mountainous | 12% | 11% | 10% | 10% | 10% | 10% | 9% | 9% | 9% |
Table 4-13: Recommended Maximum Grades for Local Roads (Rural Natural, Rural Developed, and Suburban Low Intensity Areas)
| Terrain | 15 mph | 20 mph | 25 mph | 30 mph | 35 mph | 40 mph | 45 mph |
|---|---|---|---|---|---|---|---|
| Level | 9% | 8% | 7% | 7% | 7% | 7% | 7% |
| Rolling | 12% | 11% | 11% | 10% | 10% | 10% | 9% |
| Mountainous | 17% | 16% | 15% | 14% | 13% | 13% | 12% |
Note for Tables 4-11, 4-12, and 4-13: Short lengths of grade in urban areas, such as grades less than 500 ft in length, one-way downgrades, and grades on low-volume urban collectors may be up to 2 percent steeper than the grades shown above.
Source: Adapted from A Policy on Geometric Design of Highways and Streets, AASHTO, 2018 Table 5-2, Table 6-2, Table 6-7, Table 7-2, Table 7-4a, and Table 8-1.
Figure 4-16: Speed-Distance Curves for a Typical Heavy Truck for Deceleration on Upgrades
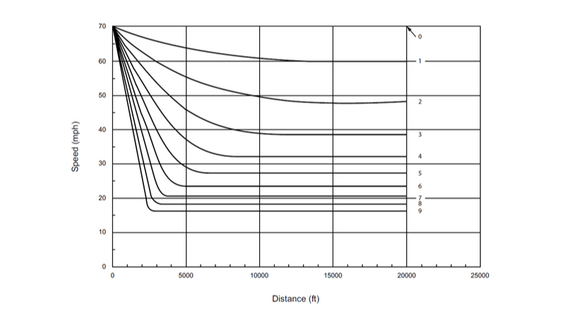
Source: A Policy on Geometric Design of Highways and Streets, AASHTO, 2018. Chapter 3 Elements of Design, Figure 3-17
Where an upgrade is preceded by a downgrade, trucks will often increase speed to make the climb. A speed increase of 5 mph on moderate downgrades (3-5%) and 10 mph on steeper grades (6-8%) of sufficient length are reasonable adjustments. These can be used in design to allow the use of a higher speed reduction curve. However, these speed increases may not be attainable if traffic volumes are high enough that a truck is likely to be behind a passenger vehicle when descending the grade.
Truck Climbing Lanes
If a critical length of grade in Table 4-8, Table 4-9, Table 4-10, Table 4-11, Table 4-12, and Table 4-13, is exceeded, then a truck climbing lane may be warranted provided the construction costs and environmental impact are reasonable. The Highway Capacity Manual and AASHTO’s Green Book present the detailed methodology for truck climbing lanes on two-lane highways. On freeways and expressways, the Highway Capacity Manual presents the accepted methodology.
When determining if a truck climbing lane is warranted, the designer must select a level of service. Preferably, the level of service should not be allowed to fall below that desired for the project as determined through the parameters described in Chapter 3 and determined in the project development process. At restricted locations, the ascending roadway facility may be operating below these guidelines before a truck climbing lane is warranted. If a truck climbing lane is warranted and the costs are reasonable, the following criteria should be followed for designing the lane:
- Lane width should be the same as the adjacent lane, but not less than 12 feet. The useable shoulder width should be at least 4 feet.
- The full width of the climbing lane should be achieved at the point where a truck will have reduced its speed by 10 mph.
- The full width of the climbing lane should, when feasible, extend to the point where the truck speed has returned to within 10 mph of the typical auto speed. At a minimum it should extend to a point where full passing sight distance becomes available.
- The entering taper should preferably be 25:1 and at least 150 feet long.
- An exiting or merging taper not sharper than 50:1 is preferred. It should be 200 feet or more in length.
Vertical Curves
Vertical curves are employed to effect gradual change between roadway grades. Vertical curves should be simple in application and should result in a design that is safe and comfortable in operation, pleasing in appearance, and adequate for drainage. The design of vertical curves should comply with the following general considerations:
- All vertical crest and sag curves are in the shape of a parabola. The computations for vertical curves are shown in Figure 4-17, 4-18, and 4-19. Design controls for vertical curves are generally based on the formula K = L/A where L is the length of curve in feet and A is the algebraic difference in grades expressed as a percent. The designer's use of K values facilitates geometric design. The tables are calculated to provide the minimum sight distances for the corresponding design speed.
- K is the horizontal distance required to effect a 1% change in grade.
- Vertical alignment should use a smooth grade line with gradual changes, consistent with the type of roadway and character of terrain. Grades with break points and short tangent lengths should be avoided.
- On long ascending grades, it is preferable to place the steepest grade at the bottom and flatten the grade near the top. It is also preferable to break a sustained grade with short intervals of flatter grades.
- Maintain moderate grades through intersections to facilitate starting and turning movements. See Chapter 6, (Intersections) for specific information pertaining to vertical alignment at intersections.
- Roller coaster-type profiles, where the roadway profile closely follows a rolling natural ground line along a relatively straight horizontal alignment, should be avoided. This type of profile is aesthetically undesirable and may be more difficult to drive.
- As with horizontal alignment, broken back curvature (short tangent between two curves in same direction) should be avoided because drivers do not expect to encounter this arrangement on typical roadways.
- Avoid using sag vertical curves in a cut section unless adequate drainage can be provided.
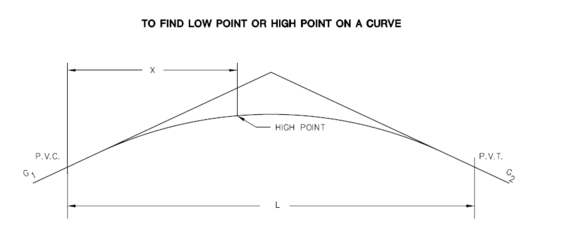
Figure 4-17: Parabolic Vertical Curves
Source: MassDOT
G1, G2 = Rates of grades expressed in % with proper sign
X = Distance of high point of a crest curve or low point of a sag curve from P.V.C win feet.
L = Length of curve in feet
X = [L(G1) /G1 - G2]
Note: In all of the above formulas, (G1-G2) is the algebraic difference in percent grade.
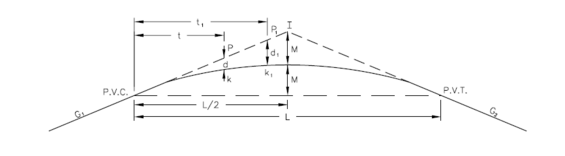
Figure 4-18: Parabolic Vertical Curves
Source: MassDOT
G1, G2 = Rate of grade expressed in percent, with proper sign
A = (G1 - G2) algebraic difference of rates of grades expressed in percent
L = Length of curves in station (The length is measured on a horizontal plane)
M = Middle ordinate in feet
d, d1 = Corrections (offset) from grade line to curve in feet
t, t1 = Distance in station from P.V.C. or P.V.T. that points k, k1 on the curve are located
a = Corrector factor, constant for any one curve
M = L(G1 - G2)/ 8 or M = 1/2 [Elev. Point 1 - (Elev. at P.V.C. + Elev. at P.V.T./2)]
a = M / (L/2)2 = A/2L
d = at2, d1 = at12 etc.
Elev of k = Elev. of P ± d, Elev. of k1, = Elev. of P1 ± d1, etc., When the algebraic difference of grades is positive, the offsets of d, d1... are subtracted from the elevations P, P1... on the tangent. When the algebraic difference of grades is negative, the offset d, d1... are added to the elevations P, P1... on the tangent.
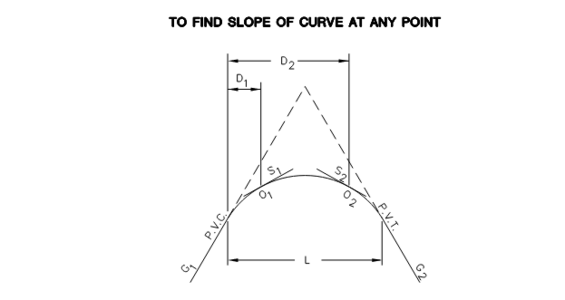
Figure 4-19: Parabolic Vertical Curves
Source: MassDOT
G1, G2 = Rate of grade expressed in percent, with proper sign
(G1, G2) = Algebraic difference in rates of grades
S1 and S2 = Slope in percent of a tangent drawn at points 01 02... at distances, D1 D2... from P.V.C. of vertical curve
D1, D2... = Distance in stations
S1 = G*1 ± D1 (|G1 - G2|) / L,
S2 = G*1 ± D2 (|G1 - G2|) / L
The sign of |G1 - G2| is always positive (absolute value)
* Assign the proper sign to G1
± Becomes a plus (+) for sag curves
± Becomes a minus (-) for crest curves
Note: The above formula may be used to find the rate of grade of a tangent at any point on a vertical curve and to check slopes of curves for drainage purposes.
Crest Vertical Curves
The primary control for crest vertical curves is providing adequate stopping sight distance as described in Chapter 3. Table 4-14 shows computed K values for lengths of vertical curves as required for the value of stopping sight distance for each design speed.
Table 4-14: Design Control for Stopping Sight Distance for Crest Vertical Curves
| Design Speed (mph) | Stopping Sight Distance (ft) | Rate of Vertical Curvature, Ka (Calculated) | Rate of Vertical Curvature, Ka (Design) |
|---|---|---|---|
| 15 | 80 | 3.0 | 3 |
| 20 | 115 | 6.1 | 7 |
| 25 | 155 | 11.1 | 12 |
| 30 | 200 | 18.5 | 19 |
| 35 | 250 | 29.0 | 29 |
| 40 | 305 | 43.1 | 44 |
| 45 | 360 | 60.1 | 61 |
| 50 | 425 | 83.7 | 84 |
| 55 | 495 | 113.5 | 114 |
| 60 | 570 | 150.6 | 151 |
| 65 | 645 | 192.8 | 193 |
| 70 | 730 | 246.9 | 247 |
| 75 | 820 | 311.6 | 312 |
| 80 | 910 | 383.7 | 384 |
* Rate of vertical curvature, K, is the length of curve per percent algebraic difference in intersecting grades (A), K=L/A
Source: A Policy on Geometric Design of Highways and Streets, AASHTO, 2018. Chapter 3 Elements of Design, Table 3-35
Crest vertical curves must be balanced with the horizontal alignment. The beginning of the horizontal curve should not be positioned beyond the crest curve in a way that does not allow the advancing driver the ability to see the upcoming change in the horizontal alignment.
Stopping Sight Distance —should be available on crest vertical curves. A height of eye of 3.5 feet and a height of object of 2 feet are used. A minimum length curve should be used for driver comfort and vehicular control. The line-of-sight intercept is 2.75 feet or above when the view obstruction is at the midpoint of the sight line.
Where:
- Lmin = 3V
- Lmin is in feet, V is in mph
Flat vertical curves of less than 0.3% for distances of 50 feet or greater from the crest require careful drainage design. This equates to a K value of 167 or greater.
Sag Vertical Curves
Headlight sight distance is the primary design control for sag vertical curves on non-illuminated roadways (see Chapter 7 for additional detail at underpasses). The height of the headlights is assumed to be 2 feet. The upward divergence of the beam is 1 degree from the longitudinal axis of the vehicle. The curvature of the sag should be such that the headlights will illuminate the pavement sufficiently to provide adequate stopping sight distance.
Table 4-15 shows the range of rounded values of K selected as design controls which provide for minimum headlight sight distance. Minimum lengths of vertical curves for flat gradients are equal to 3 times the design speed in mph.
As for crest curves careful drainage design must be made for K values of greater than or equal to 167.
The designer should check the sight distance under bridges.
Table 4-15: Design Control for Sag Vertical Curves
| Design Speed (mph) | Stopping Sight Distance (ft) | Rate of Vertical Curvature, Ka (Calculated) | Rate of Vertical Curvature, Ka (Design) |
|---|---|---|---|
| 15 | 80 | 9.4 | 10 |
| 20 | 115 | 16.5 | 17 |
| 25 | 155 | 25.5 | 26 |
| 30 | 200 | 36.4 | 37 |
| 35 | 250 | 49.0 | 49 |
| 40 | 305 | 63.4 | 64 |
| 45 | 360 | 78.1 | 79 |
| 50 | 425 | 95.7 | 96 |
| 55 | 495 | 114.9 | 115 |
| 60 | 570 | 135.7 | 136 |
| 65 | 645 | 156.5 | 157 |
| 70 | 730 | 180.3 | 181 |
| 75 | 820 | 205.6 | 206 |
| 80 | 910 | 231.0 | 231 |
*Rate of vertical curvature, K, is the length of curve (m) per percent algebraic difference intersecting grades (A), K=L/A
Source: A Policy on Geometric Design of Highways and Streets, AASHTO, 2018. Chapter 3 Elements of Design, Table 3-37
Vertical Clearances
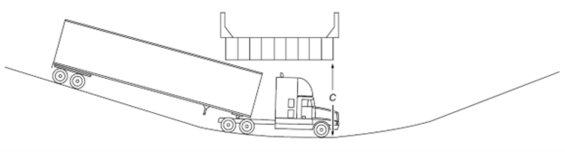
Sag vertical curves at undercrossing should be designed to provide vertical clearance for the largest legal vehicle that could use the undercrossing without a permit. For example, a WB-67 tractor-trailer will need a longer sag vertical curve than a single-unit truck to avoid the trailer striking the overhead structure as shown in Figure 4-20. The location of the critical clearance generally occurs where the highest point on the crown line and/or runoff line of the road underpass falls directly under the lowest elevation of the bottom overpass superstructure support member. Refer to the MassDOT Bridge Manual for the method of determining clearances.
Figure 4-20: Vertical Clearances For Largest Vehicle at Sag Curve Undercrossing
Source: A Policy on Geometric Design of Highways and Streets, AASHTO, 2018. Chapter 3 Elements of Design, Figure 3-39
Establishing Profiles
When establishing the vertical profile, use the following criteria:
- On freeways, a minimum distance of 1,500 feet should be provided between points of intersection. On other major highways, 1,200 feet is the minimum distance.
- The vertical profile should be in balance with the horizontal alignment (See Section 4.4).
- On divided highways with a median less than 30 feet, including shoulders, the median edges should be at the same elevation. For wider medians, the profiles for the two roadways should be established independently.
- Vertical profiles of urban and local roads are determined considering the existing topography, construction costs, safety, and the abutting properties. The evaluation should establish the critical abutting locations. Buildings, driveways, and steps are especially important when establishing profiles.
4.4 Combination of Horizontal and Vertical Alignment
Horizontal and vertical alignments should be designed concurrently. Their designs complement each other and poorly designed combinations can reduce the quality of both.
Coordinate the horizontal and vertical alignment to obtain safety, uniform speed, pleasing appearance, and efficient traffic operation. Coordination can be achieved by plotting the location of the horizontal curves on the working profile to help visualize the highway in three dimensions.
Horizontal and vertical alignments are among the most important of the permanent design elements. Quality in their design and in their combined design increases usefulness and safety, encourages uniform speed, and improves appearance. The following general controls should be considered in balancing horizontal and vertical alignments:
- Balance curvature and grades. Use of steep grades to achieve long tangent and flat curves, or excessive curvature to achieve flat grades, are both poor designs.
- Vertical curvature superimposed on horizontal curvature generally results in a more pleasing facility. Successive changes in profile not in combination with horizontal curvature may result in a series of dips not visible to the driver.
- A horizontal curve should not begin or end at or near the top of a crest vertical curve. This condition can be unsafe, especially at night, if the driver does not recognize the beginning or ending of the horizontal curve. Safety is improved if the horizontal curve leads the vertical curve, that is, the horizontal curve is made longer than the vertical curve in both directions.
- Curvature in the horizontal plane should be accompanied by comparable length of curvature in the vertical plane.
- Awkward combinations of curves and tangents in both the horizontal and vertical planes should be avoided (i.e., "broken back" curves).
- Horizontal and vertical curvatures should be coordinated to avoid combinations that appear awkward when viewed from a low angle.
- Ideally the vertices of horizontal curves (PI) and vertical curves (PVI) should coincide or be within 1/4 phase of each other.
- Horizontal curvature should lead vertical curvature. i.e., the horizontal curve should be longer than the vertical curve and the PVT and PC should not be at the same point.
- The alignment designs should enhance attractive scenic views of the natural and manmade environment, such as rivers, rock formations, parks, and outstanding man-made structures.
- In residential areas, the alignment design should minimize nuisance factors to the neighborhood. Generally, a depressed facility makes a highway less visible and less noisy to adjacent residents. Minor horizontal adjustments can sometimes be made to increase the buffer zone between the highway and clusters of homes.
- Horizontal curvature and profile should be as flat as feasible at intersections where sight distance along both roads is important and vehicles may have to slow or stop.
- On divided highways, consideration of variation in the width of the median and the use of independent alignments is needed to derive the design and operational advantages of one-way roadways.
- On two-lane roads, the need for safe passing sections (at frequent intervals and for an appreciable percentage of the length of the roadway) often supersedes the general desirability for combination of horizontal and vertical alignment. Passing zones with long tangent sections are needed to secure sufficient passing sight distance.
- Avoidance of a sharp horizontal curve at or near the low point of a pronounced sag vertical curve is important. The road ahead is foreshortened and any horizontal curve that is not flat assumes an undesirably distorted appearance. Further, vehicular speeds, particularly of trucks, often are high at the bottom of grades and erratic operation may result, especially at night.
- To maintain drainage, vertical and horizontal curves should be designed so that the flat profile of a vertical curve will not be located near the flat cross slope of the superelevation transition.
For more information, the designer should refer to the guidelines in the AASHTO Green Book.
4.5 For Further Information
- AASHTO Green Book. A Policy on Geometric Design of Highways and Streets, AASHTO, 2018
- Highway Capacity Manual, Special Report No. 209, Transportation Research Board.
- Practical Highway Esthetics, ABCE, 1977.
- Cross Section and Alignment Design Issues, TRB No. 1445, 1994.