3.1 Introduction
Basic design controls serve as the foundation for establishing the physical form, safety, and functionality of the transportation facility. Some design controls are inherent characteristics of the facility (e.g., its physical context and the existing transportation demands placed upon it). Other basic design controls are selected or determined by the designer, working with communities and users to address a project’s need, goals, and objectives. Selecting appropriate values or characteristics for these basic design controls is essential to achieve a safe, effective, and context sensitive design. This chapter discusses these basic design controls and their influence on the physical characteristics of a roadway or other transportation facility:
- Roadway context (Section 3.2)
- Roadway users (Section 3.3)
- Transportation demand (Section 3.4)
- Measures of effectiveness (Section 3.5)
- Speed (Section 3.6)
- Sight distance (Section 3.7)
These design controls influence the selection of alignment, cross section, and intersection design elements and their criteria (i.e., minimum or maximum values or value ranges), which are discussed in other PDDG chapters. Controlling criteria are introduced in Section 3.8.
3.2 Roadway Context
The current and future context of a roadway are critical factors to consider in identifying a project’s need, making fundamental design decisions such as the proposed cross-section, and selecting detailed design elements such as street light fixtures or other construction materials. Development of a roadway design that is sensitive to, and respectful of, the surrounding context (both present and envisioned by the community) is important for project success.
As described in Chapter 2, context-sensitive design refers to both the process and its results. An open community process that begins early in project development is important for developing consensus about the project need. This community process should continue through the design phase so that the features of the project are assembled to produce an overall solution that satisfies the project need, respects surrounding resources, and is consistent with the community’s values and future vision for the area.
A context-sensitive design should begin with analysis of the contextual elements, such as environmental and community resources, of the area through which a roadway passes, as well as future land use and economic development plans published by the community. As described later in this chapter, the concept of area types can help the designer understand the users, constraints, and opportunities that may be encountered in different settings.
Once the designer has an understanding of the area surrounding the road, the road’s users, potential users, and future land use changes, the designer should consider the transportation elements of the roadway, its function within the regional transportation system, and the appropriate level of access control. Thus, three main elements of context are considered in design:
- Area Type – the surrounding existing or future built and natural environment
- Roadway Type – the role the roadway plays in terms of providing regional connectivity and local access
- Access Control – the degree of connection or separation between the roadway and the surrounding land use
Area Types
The context of a roadway begins with its land use and environmental context, which includes nearby natural resources, terrain, and the manmade environment (development patterns, historic, cultural, and recreational assets). Throughout the PDDG, this context is generalized as area type. This context often establishes the physical constraints of the roadway alignment and cross-section, and influences the selection of motor vehicle target and design speeds. A roadway may traverse multiple area types. Additionally, the volume, potential demand, and character of pedestrian, bicycle, public transit, and motor vehicle activity can change considerably along its route. Land use is a determinant in the context of a road; as land use change along a road, the road design and cross section elements also change to meet the needs of the surrounding area and users. Roadways must be designed in a manner that serves the existing land use while supporting the community’s future land use goals. Chapter 15 also discusses land use and access management strategies.
Traditionally, roadways have been classified either as “rural” or “urban.” It is important to recognize that a roadway’s formal classification as urban or rural (which is determined from census data using periodically adjusted criteria adopted by the United States Office of Management and Budget) may differ from actual site circumstances or prevailing conditions. An example includes a rural arterial route passing through a small town. The route may not necessarily be classified as urban, but there may be a significant length over which the surrounding land use, activity, and transportation functions are more urban or suburban than rural. For this reason, it is important for the designer, working with the community and project reviewers, to determine an appropriate area type or types for a project early in the planning process. As a starting point, urban areas are as defined by the latest version of the “MassDOT Urban Boundaries” map available through GeoDOT.
Area types are illustrative of the broad range of environments that the designer may encounter throughout the Commonwealth. The designer should also identify unique or project-specific contextual elements that will influence the design beyond those generalized for the following area types. These might include, as examples, schools, nursing homes, churches, historic features, commercial areas, bike facilities, sidewalks, nearby transit, and bus stops. Special consideration should be given for sections of roadways that serve Environmental Justice communities, as the transportation needs for residents of these historically underserved areas may require an approach that differs from the transportation needs for residents in other communities.
Rural Area Types
Rural areas are generally undeveloped or sparsely settled with development at low densities along a small number of roadways or clustered in small villages, as illustrated in Figure 3‑1 and described below. Rural areas are often distant from large metropolitan centers and include three types:
Suburban Area Types
Suburban areas vary widely in character and are usually found outside the core of a metropolitan area. Some components of suburban zones may appear rural in character, while others are densely populated and more closely resemble urban areas, as illustrated in Figure 3‑2 and described below. Three suburban area types include:
Urban Area Types
Urban areas are typically found at the core of a large metropolitan area. In many cases, the urban area includes a central business district (CBD) with high density commercial and residential development surrounding the CBD. Open space is generally found in formal parks or urban preserves, as illustrated in Figure 3‑3 and described below. Three urban area types include:
Figure 3-1: Illustration of Rural Area Types
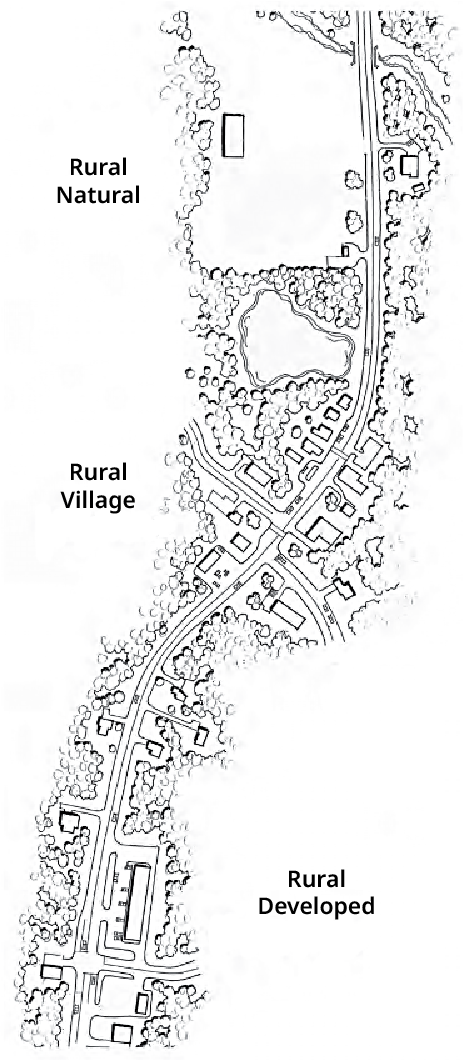
Source: MassDOT
Rural Natural
This is the traditional concept of rural space, where the roadway travels through forest land, farmland, and other open space. There are few access points along the roadway and little or no development. Design constraints tend to involve topographic, environmental, scenic, or historic resources.
Rural Village
This is an isolated built-up area with storefronts, civic uses, and interspersed housing. Varied building setbacks, and frequent driveways and intersections are common. Individual property frontage is generally less than 200 feet. Right-of-way is usually constrained by the built environment. An important safety consideration for design is the often rapid transition between rural natural or rural developed areas to a rural village.
Rural Developed
This is an area of low-density residential development or occasional commercial uses. Buildings generally have large setbacks from the roadway and are frequently obscured due to tree cover. Occasional driveways require a driver to be more alert for entering and exiting vehicles than in rural natural areas. The consideration of future developments are important factors in project development.
Figure 3-2: Illustration of Suburban Area Types
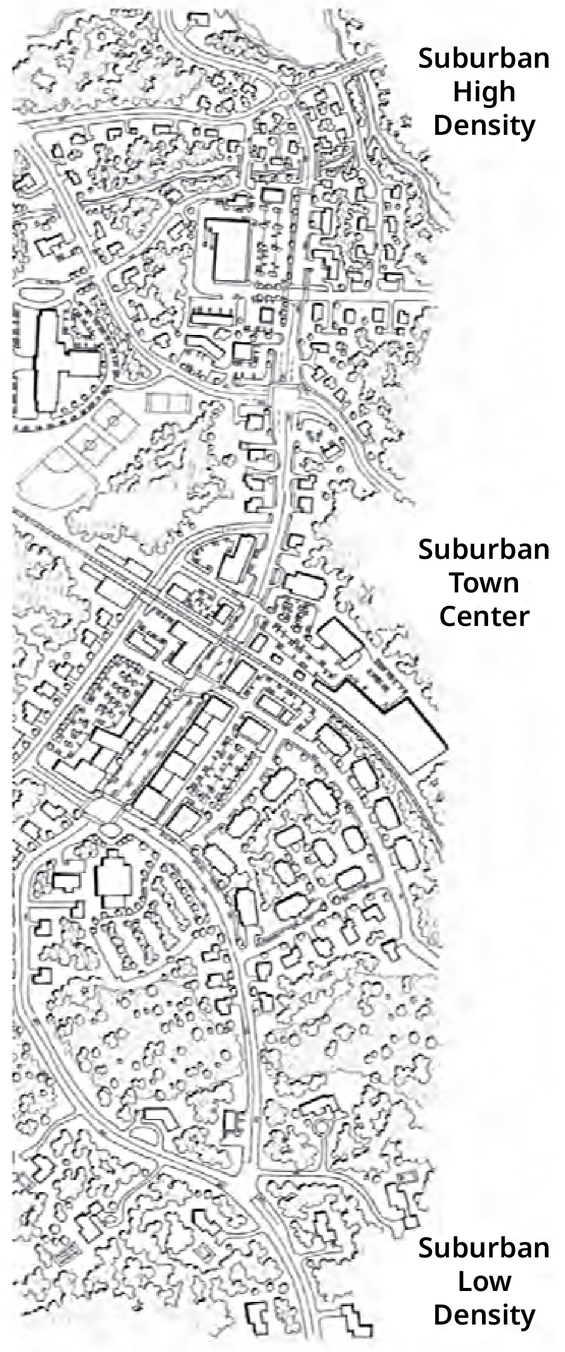
Source: MassDOT
Suburban High Density
This category covers a wide range of suburban development where the majority of the roadside is intensively developed with a mix of property-types and building setbacks. Residential property frontage is often less than 200 feet and intensive commercial development, including strip development, is frequently encountered. Right-of-way is usually restricted to a moderate extent by the built environment.
Suburban Town Center
This is a built-up area of commercial and residential uses. The commercial uses are usually concentrated together and are notable for a uniform building setback. Residential areas consisting of properties with frontage of less than 200 feet often define the edges of a suburban town center. Right-of-way is usually restricted by the built environment.
Suburban Low Density
These are transitional areas where roadways have a mix of natural and developed characteristics. Residential development is low to moderate in density, and there are isolated commercial properties. There are generally large setbacks to buildings and individual property frontage usually exceeds 200 feet.
Figure 3-3: Illustration of Urban Area Types
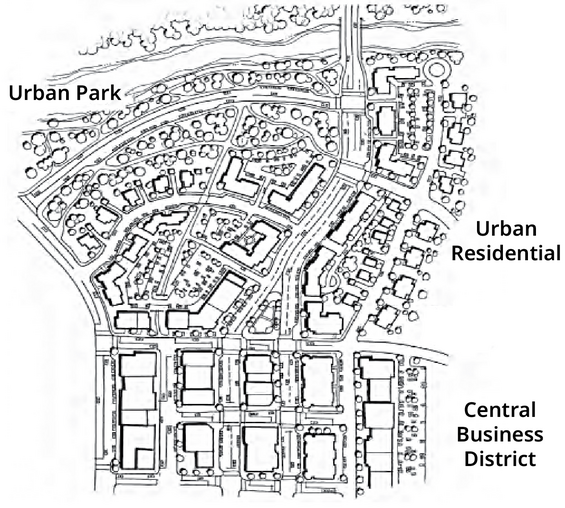
Source: MassDOT
Urban Park
Open space in the urban area is usually found in parks or preserves. Driveways are usually infrequent in open spaces, although path and trail crossings of the roadway may be common.
Urban Residential
Urban residential districts usually consist of multifamily developments at a common scale and setback along roadway corridors. Driveways are usually consolidated for entire buildings or blocks.
Central Business District (CBD)
The majority of development is usually commercial or mixed-use. Access to property is the primary function of the roadway network.
The designer can use characteristics such as building density, building setbacks, and land use to identify the area type(s) of a project based on Table 3‑1.
| Area Type | Density of Structures | Building Setback | Land Use | Block Size / Street Connectivity |
|---|---|---|---|---|
| Rural Natural | Low to None | N/A | Agricultural, undeveloped, recreation | Blocks are not defined due to lack of connected street network or topography |
| Rural Developed | Very Low | Large | Residential, occasional commercial | Blocks may not be well defined due to lack of connected street networks |
| Rural Village | Moderate | Shallow | Primarily commercial along a main street (some adjacent single-family residential) | Small to medium blocks that are typically well defined |
| Suburban Low Density Development | Low to Moderate | Medium to Large | Residential | Medium to large blocks, not well defined |
| Suburban High Density Development | Moderate to High | Varies | Residential, occasional commercial | Medium to large blocks, may not be well defined |
| Suburban Town Center | Moderate to High | Varies | Commercial, residential | Small to medium blocks that are well defined |
| Urban Park | Low to None | N/A | Recreation | Blocks may not be well defined due to topography |
| Urban Residential | High | Shallow to None | Residential, some commercial | Small, connected block structure |
| (Urban) Central Business District (CBD) | High to Very High | Shallow to None | High-rise commercial, high-rise residential | Small, connected block structure. Note that urban redevelopment has resulted in larger blocks in some CBD areas. |
Roadway Types
The transportation network is composed of several different types of roadways that provide different functions and different types of access to roadway users. A primary purpose of roads is to facilitate movement for all people and goods between destinations and between major cities and towns. Roadways are also integral parts of local communities and places where people live, work, and play. The roadway type, along with the area type, is an important contextual consideration for design.
MassDOT uses six roadway types, each of which reflects its degree of local access and regional connectivity as illustrated schematically in Figure 3‑4 and described below:
Figure 3-4: Schematic Representation of Roadway Type
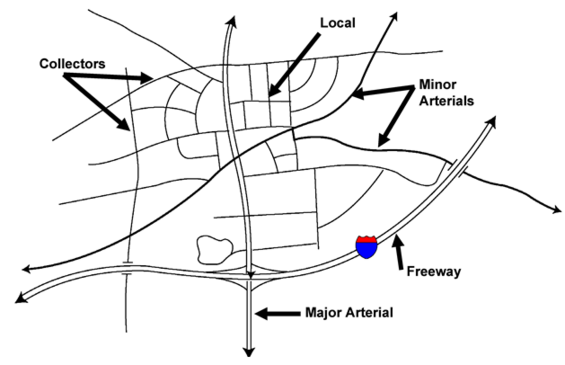
Source: MassDOT
- Freeways are primarily for interstate and regional travel (high regional connectivity at high speeds with limited access to adjacent land and no access for people walking and biking).
- Major arterials service statewide travel as well as major traffic movements and people walking and biking within urbanized areas or between suburban centers (high regional connectivity and a lower level of local access than the following roadway types).
- Minor arterials link cities and towns in rural areas and interconnect major arterials within urban areas (high to moderate regional connectivity and moderate degrees of local access).
- Major collectors link arterial roadways and provide connections between cities and towns (moderate to low regional connectivity and higher degree of local access than arterials and freeways).
- Minor collectors connect local roads to major collectors and arterials (lower regional connectivity and higher degrees of local access than the previous roadway types).
- Local roads and streets - Not intended for regional connectivity (high degree of local circulation and access).
The designer should select the project’s roadway type to reflect the actual role that the roadway plays in the transportation system and local place, as identified through the project development process. Some roadways may have multiple functions that are characteristic of different roadway types. For example, a roadway may serve a high number of regional trips but may pass through a town center with frequent driveways, close intersection spacing, and high levels of walking and biking activity. In this case, the designer should consider the roadway network holistically, including parallel routes, to determine the degree to which the roadway needs to continue to serve multiple functions. A roadway that serves both regional connectivity and local access functions may require increased attention to reducing or eliminating conflicts between users.
Note that parkways are a distinct type of roadway and are addressed in their own section below.
Relationship to the Formal Functional Classification System
The functional classification system, developed by the Federal Highway Administration and applied to all roadways in the United States, remains an element of system planning so that a safe and efficient transportation network, providing the desired level of regional connectivity and land access, is developed and maintained. This classification system is also used as a determinate of federal funding eligibility.
The FHWA has four formal functional classifications. Within the arterial and collector functional classifications, FHWA has five subcategories:
- Interstate
- Arterial
- Urban
- Rural
- Principal
- Major
- Minor
- Collector
- Urban
- Rural
- Principal
- Major
- Minor
- Local
While functional classification often serves as a starting point, the designer should not simply rely on this formal designation as a design control. When selecting the roadway type, the designer should determine the roadway characteristics and appropriate design considerations to serve both the regional purpose of the roadway and its role in the local setting.
Access Control
Access control is a term used to define how access to adjacent properties is regulated and designed along a roadway. Access control is among the most useful tools available to maintain safe and efficient roadway operations for all users. Judicious use of median treatments, driveway permits, and safe driveway geometry can improve roadway safety and enhance the operation of the road without undue burden on accessing bordering property.
The degree of access control is influenced by the roadway type and area type. For example, access controls are usually more stringent on arterials than on collectors and local roads, reflecting the mobility and land access functions of these roadways. Likewise, access controls are often given more consideration in developing areas where there is flexibility for future land use to conform to an access management plan than in developed areas where the pattern of land use has been established. However, the designer should consider existing access points along a roadway and the possibility for changes that are consistent with the project need. For example, it may be possible to relocate, redesign, or consolidate driveways along an existing roadway. A thorough understanding of access control will help the designer select an appropriate design and target speed, planning parameters, and safety design for the facility’s users.
Access control is exercised by statute, zoning, right-of-way purchases, driveway controls, turning and parking regulations, geometric design (e.g., raised medians, grade separations, and frontage roads), and local right of way permitting.
Roadways can be designed with the following approaches to access control:
- Full Control – Full control gives priority to through traffic by providing access only at grade-separated interchanges with selected public roads. No at-grade crossings or private driveway connections are allowed. “Freeway” is the common term used for this type of highway. Full access control maximizes the capacity, safety, and speeds on the freeway.
- Partial Control – Partial control of access is an intermediate level between full control and control via statute, zoning, or regulation. Under partial control of access, priority is given to through traffic, but a few at grade intersections and private driveway connections may be allowed. Partial control of access may be provided for certain arterial and collector roadways. The proper selection and spacing of at-grade intersections and service connections will provide a safe balance between the regional connectivity and local access functions of the facility.
- Statute, Zoning, or Regulation – If access points are properly spaced and designed, the adverse effects on roadway capacity and safety will be minimized. The design should enable vehicles to enter and exit safely with a minimum of interference to through traffic. Statutory control may be used, for example, on a rural or urban arterial highway to limit access only to public road crossings. Driveway regulations and permits are often used to control the geometric design of an entrance, driveway spacing, and driveway proximity to public road intersections. Zoning may also be used to effectively control the adjacent property development so that major generators of traffic will not develop; however, zoning regulations are at the discretion of the local government.
While the designer may have substantial flexibility in defining the access control during the project development process for new roadways, the options may be substantially more complex or limited on projects that are modifying existing roadways. The Access Management Manual, Second Edition published by the Transportation Research Board in 2014 provides guidance on the application of access management techniques for both existing and new roadways. Access management techniques are also discussed further in Chapter 15.
Parkways
Parkways are a unique category of roadway that have a distinct history. According to the Massachusetts Department of Conservation and Recreation (DCR), “The Metropolitan Boston Parkway System began its development in the late 1800s as urban planners and reformers sought to create outdoor recreational opportunities for city dwellers. Parkways were originally intended for recreational travel as access roads within parks, or roads connecting one park to another. Starting in the 1920s, the increase in automobile travel and accelerating pace of suburban development put pressure on parkways to serve as routes for local and regional through traffic. Access for walking and bicycling was diminished as many parkways were widened to serve regional traffic during the highway-building era of the 1950s and 60s. As a result, the parkway network today represents a wide variety of conditions. Some feature elegant promenades and popular recreational trails, while others are themselves significant barriers to walking and bicycling due to missing or unrepaired or missing sidewalks, infrequent crossings, lack of bicycle facilities, and high-volume, high-speed traffic.”
Examples of parkway types include:
- Narrow, linear parkways are intended to link larger park or reservations to one another, originally designed with internal carriage roads and bridle paths for recreational use, make up the first category. Examples of this type in the Boston area are the Riverway, Jamaicaway, and West Roxbury Parkway. The parkway layout is sufficiently wide to include scenic and interesting natural features and provide a natural separation from surrounding developed areas; their narrow linear or curvilinear layout accommodated recreational drives through their length from one significant park or reservation to another. In many instances the carriage roads became increasingly integrated with the surrounding roadway network.
- Landscaped boulevards are the group of parkways established under the provisions of the Boulevard Act of 1894 and other subsequent, specific enabling legislation. Like earlier parkways, these boulevards were intended as links to outlying Reservations. Examples in the Boston area include the Fellsway, Revere Beach Parkway, and Blue Hills Parkway. Boulevards were often laid out with reservations for electric trams and with a deliberate separation between general local access traffic and recreational traffic. As regional roadways crossing multiple communities, many became important arteries for automobile traffic.
- Park access roads were intended initially to provide internal access to a park or Reservation’s features. Unquity Road in the Blue Hills Reservation and the summit roads at Mount Greylock Reservation are examples of park access roads. Many of these roads serve their original purposes; others have been substantially altered by the construction of extensions or links to other roads.
Many of the context-sensitive design approaches and considerations described in the PDDG are appropriate for identifying these considerations and suitable design approaches. The proponent and designer must also work closely with the parkway’s owner to determine appropriate design considerations for the particular parkway.
Many parkways are owned and controlled by the Department of Conservation and Recreation (DCR). The DCR developed the Master Plan to Guide Investments in Parkway Systems in August 2020. This document should be used as guidance and followed for parkway projects. In some cases, MassDOT is involved in parkway projects due to project funding or other circumstances. In these instances, MassDOT will work cooperatively with the proponent and parkway owner to review or develop a design that is suitable for the parkway.
3.3 Roadway Users
A fundamental expectation in roadway design is that all people, regardless of mode of transportation, age, or ability, will have safe and comfortable facilities. All roadways, with exception of limited access facilities such as freeways, serve a variety of users including people walking, biking, using public transit, driving or riding as passengers, using other mobility devices. Transportation is the primary purpose of a roadway, but roadway space can serve secondary purposes such as business activities and public gatherings. These activities can influence design decisions. Appropriately considering the needs of a variety of users, especially vulnerable roadway users, during the project development process is essential for creating a safe roadway. A vulnerable roadway user (VRU) is a nonmotorist who is walking, biking, traveling in a wheelchair, working along a road, skateboarding, using a scooter, roller skating, or using other micromobility devices. Designers are encouraged to imagine they are using the facility from the perspective of each mode of transportation and from the perspective of people of different ages and abilities (younger child, person in a wheelchair, older adult). Additionally, it needs to be acknowledged that while roadways are used by everyone, some people have limited mode choice or are not able to drive and therefore travel for each mode needs to be safe and comfortable. In a few cases, such as freeways, roadways serve almost exclusively motor vehicle traffic.
As a key element in MassDOT’s commitment to zero roadway deaths and serious injuries by using the Safe System approach, it is imperative that the safety of all roadway users be equitably addressed. The FHWA’s Safe System principles include:
- Deaths and serious injuries are unacceptable – While no crashes are desirable, the Safe System Approach prioritizes crashes that result in death and serious injuries, since no one should experience either when using the transportation system.
- Humans make mistakes – People will inevitably make mistakes than can lead to crashes, but the transportation system can be designed and operated to accommodate human mistakes and injury tolerances and avoid death and serious injuries.
- Humans are vulnerable – People have limits for tolerating crash forces before death and serious injury occurs; therefore, it is critical to design and operate a transportation system that is human-centric and accommodates human vulnerabilities.
- Responsibility is shared - All stakeholders (transportation system users and managers, vehicle manufacturers, etc.) must ensure that crashes don’t lead to fatal or serious injuries.
- Safety is proactive - Proactive tools should be used to identify and mitigate latent risks in the transportation system, rather than waiting for crashes to occur and reacting afterwards.
- Redundancy is critical - Reducing risks requires that all parts of the transportation system are strengthened, so that if one part fails, the other parts still protect people.
See MassDOT’s Strategic Highway Safety Plan (SHSP) for more information on MassDOT’s adoption of the Safe System approach.
Consideration of roadway users’ characteristics and selection of appropriate accommodation can also influence the quality of life for the surrounding community, local businesses, the economic health of the region, the physical health of the population, and the quality of the built and natural environment. Designers should consider the desired paths of travel by each user based on destinations, parking, and transit stations and stops.
Roadway design also needs to consider that most personal and household trips are short trips, and non-commute. The National Household Travel Survey reports that 16% of trips are for work, and the remaining for social, recreational, school, family, personal errands, and other. MassDOT Tracker (2023) reports that 61% of trips are 3 miles or less with 3 miles being a 16-minute pedal bicycle ride providing a high potential for everyday walking and biking if safe and comfortable facilities were provided.
Various roadway users include, but are not limited to:
- People walking
- People bicycling
- People driving
- People using transit
Their characteristics are important influences in the physical design of a roadway, as described in the following sections. The designer should carefully consider the interactions between different roadway users when designing a roadway. The project design should provide safe and comfortable facilities for all users and make clear the trade-offs when selecting facilities and treatments.
People Walking (Pedestrians)
Most travelers are pedestrians at some point during their trip. Pedestrians include people traveling on foot, or people moving with the use of a wheelchair, walker, white cane, or other assistive device. In some cases, pedestrians are regular users of the roadway, while in others they may be using the roadway to connect to other modes of transportation, such as a bicycle, public transit, or walking to and from a parked or stopped vehicle, or working to fix a broken down vehicle.
Public pedestrian facilities include roadways, sidewalks, shared and pedestrian-only streets, paths, crosswalks, stairways, curb ramps, transit stops, or public parking areas - and all publicly accessible spaces adjacent to the roadway. Designing public pedestrian facilities may require considering tie-ins to private facilities such as building entrances, building stoops, and stairways. Thus, the pedestrian network is highly complex, and includes a multitude of spaces and amenities that allow people to travel for different purposes at different speeds – including places to pause and rest.
One of the six principles of the Safe System approach is that humans are vulnerable, and are made increasingly vulnerable by motor vehicles. Pedestrians particularly have limited ability for tolerating crash forces, which elevates the risk of death and serious injury occurring when struck by a vehicle. The risks are heightened when the roadway design facilitates high-speed driving. Therefore, designing transportation systems and infrastructure that are human-centric is critical to safety.
Designers should understand that there is no single “design pedestrian” and that the transportation system shall accommodate pedestrians of all ages and abilities. Streets must be designed to:
- Remove or minimize risk to life-threatening conditions
- Ensure that all people can equally access services and urban spaces
- Promote physical and mental well-being for all people
These fundamentals of people-centric streets need to be expanded based on specific needs of certain groups.
Influence of Age on Pedestrian Needs
Age has an influence on how people interact with public space. Designers should consider users across a range of ages, from an infant accompanied by a caregiver to young child, a teenager, or an older adult.
Environmental surroundings can have long-term effects on children’s health, physical and cognitive development, and social well-being. Children’s bodies and brains are less developed compared to adults. Because of their lower height and more fragile bodies, children are more susceptible to environmental risks such as traffic crashes, air pollution, excessive noise or heat, and lack of green spaces. Children behave and perceive their environment differently from adults: they might move slower, have less predictable walking patterns, may need more frequent places to pause, and are not able to assess risk nor judge how other street users will behave. Designers should imagine a parent with their toddler, or a five-year old, or a nine-year-old, for example, using the facility and plan for what space, cues, separations, comfort, crossing time, and visibility is needed for them to be able to move – or play – safely in the right of way.
Older adults may require more time to cross streets, desire more predictable surfaces, benefit from handrails in steep areas, and may require places to rest along their route. Similarly, pregnant people may also walk slower and need places to stop, rest, or sit.
Streets that serve children and older adults safely and comfortably better serve all people.
Influence of Disability on Pedestrian Needs
People have a wide range of physical, cognitive, and sensory abilities that can inform design decisions.
- People who are blind or who have low vision generally require audible and tactile cues to safely navigate sidewalks and crosswalks. To cross a street, a person who is visually impaired needs appropriate cues to help them complete the tasks of correctly identifying the crossing location, aligning themselves to cross, deciding when to initiate a crossing, and maintaining their alignment during the crossing.
- People with limited cognitive abilities may rely on symbols to navigate and take longer to cross the street.
- People using mobility devices such as wheelchairs or scooters need adequate space to maneuver, as defined in 521 CMR 6.00: Space allowance and reach ranges. They may travel across an intersection faster than someone walking, but it can be more difficult to see them from the seat of a truck, SUV, or car.
Gaps or barriers in the pedestrian network can have much greater negative impacts to people with disabilities, or make a trip not possible. For examples, whereas an able-bodied person may be able to step over a curb that is missing a pedestrian curb ramp, a person using a mobility device will not have equal access. Designers should ensure that pedestrian network connectivity and safe crossings are provided, especially to accommodate potential for walking trips to or from and between destinations.
Design guidance related to designing for people with disabilities is provided throughout the PDDG. In particular, see Chapter 5 for information on compliance with state and federal regulations and guidance on accessible bus stops, Chapter 6 for guidance on Accessible Pedestrian Signal (APS) systems, Chapter 11 for accessibility requirements for shared use paths, and Chapter 12 for guidance on accessible parking spaces.
A significant percentage of the population has some form of disability. Streets that serve people with disabilities safely and comfortably better serve all people.
Figure 3-5: Spatial Needs of Pedestrians
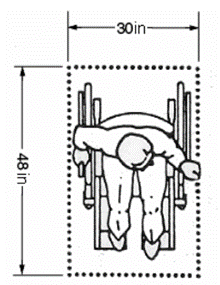
Source: MassDOT
Spatial Needs of Pedestrians
Walking is often a social activity, caregivers walk side-by-side with children, and frequently pedestrians walk in pairs or groups. When a pedestrian facility, roadway or intersection is under design, maximum clear space should be used to determine the selected design values, taking into account people walking side-by-side and passing. The designer should consider the following spatial needs of pedestrians:
- An individual body ellipse of 2 by 1.5 feet with a total area of 3 square feet is used as the basic space for a single pedestrian.
- The clear space for a person sitting stationary in a wheelchair is generally understood to be 2.5 feet by 4 feet (Figure 3‑5), although people using scooters and power chairs may require even more space.
- A person using crutches, a service animal, or a walker typically requires 3 feet of clear width.
- In evaluating a pedestrian facility, an area of 8 square feet is typically considered to allow a buffer zone for each pedestrian and approximately twice that is needed for a person using a wheelchair or a white cane.
- Figure 3‑6 provides typical dimensions of a family (8-16 feet wide), a person in a wheelchair (4 feet long), child and caregiver traveling together (4.5-5 feet long), and children with mobility support devices (4-4.5 feet long).
Figure 3-6: Typical Dimensions of Various Pedestrian Types
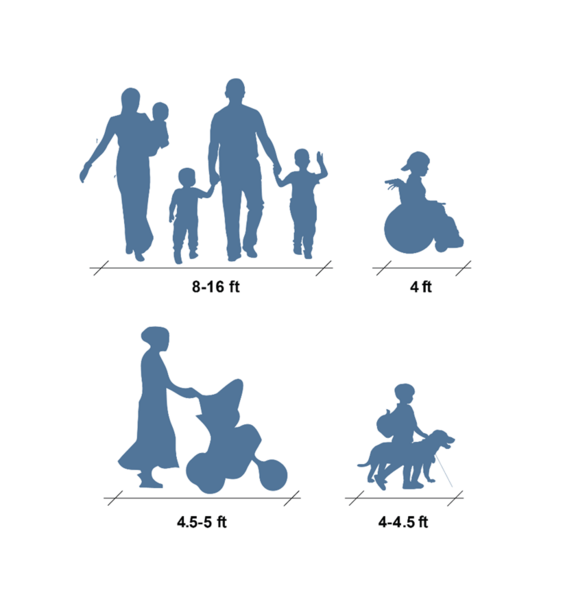
Source: Adapted from the Designing Streets for Kids Guide, Global Designing Cities Initiative, 2020
Based on the above spatial needs:
- A walkway that is 3 feet wide accommodates a single file pedestrian flow in one direction, in the absence of vertical obstructions along the route.
- A walkway that is at least 5 feet wide and clear of obstructions is required to allow passing clearance.
- A walkway that is at least 6 feet wide is desirable to enable two people to comfortably pass each other or to walk or ride their wheelchair abreast.
In areas with high pedestrian traffic, greater widths are desirable as described in Chapter 5. How wide a sidewalk or shared use path should be for a given demand should be based on safety and comfort for users of all ages and abilities.
See Chapter 6 for guidance on designing for pedestrians within the right-of-way at intersection locations.
People Biking (Bicyclists)
Every day, many residents and visitors choose to use a bicycle for daily trips, whether for getting to work or school, running errands, for recreation, or reaching transit stops and stations. For some people, biking may be their primary mode of transportation if they do not have access to public transit, a vehicle, or a driver’s license. For those who are able to choose among different modes, biking would be a more attractive choice for short daily trips if they knew that safe, comfortable, and connected bike routes were available.
In selecting and designing bicycle facilities, the designer should consider the different bicyclist user types with a focus on the 60% of the population who are “interested, but concerned” as defined below. People who bike vary in their comfort level, skill level, trip purpose, age, and experience. Not all people fall under a specific user type, and their user type can be fluid. Children may require special consideration, specifically when biking on neighborhood streets, in recreational areas, on main streets, and near schools. Among adults, three types of bicyclist users are commonly identified. These bicyclist types are described below and depicted in Figure 3‑7.
- Interested but Concerned Bicyclists comprise the largest group (estimated at 60% of the population), have a low tolerance for traffic-related stress, and prefer a comfortable, functional bicycle network with safe roadway crossings. People in this group will tend to avoid bicycling altogether except on very low-volume roadways or where they have access.
- Casual and Somewhat Confident Bicyclists (also known as Enthused and Confident, estimated at 7% of the population)have a moderate tolerance for traffic stress. While comfortable on most bicycle facilities, this group generally prefers low-volume residential streets and bike lanes on major roadways. However, Somewhat Confident Bicyclists are willing to use facilities that require tolerating higher levels of traffic stress for direct and efficient routes.
- Experienced and Confident Bicyclists (also known as Highly Confident or Strong and Fearless Bicyclists) comprise the smallest identified group (estimated at 1% of the population), have the highest tolerance for traffic stress, generally do not avoid operating in mixed traffic, and prefer direct routes.
The designer should plan and design for people who are “interested but concerned” about biking by providing low-stress, high-comfort bike facilities. See the FHWA Bikeway Selection Guide and supporting research ("Four Types of Cyclists? Examining a Typology to Better Understanding of Bicycling Behavior and Potential”) for more information on types of bicyclists.
Creating separation between people biking and driving in physical space or in time using traffic control devices is critical when vehicle speeds exceed survivable levels. Separation is increasingly important as motor vehicle design changes have resulted in heavier, larger vehicles and allow people to drive at higher speeds. When bikeways are located adjacent to on-street parking, more space is desirable to provide clearance for the opening of car doors into the travel lane.
When physical separation is necessary to achieve a low-stress facility but not feasible on a particular project, the designer should identify parallel routes to accommodate “interested but concerned” users. For further guidance on bicycle facility selection, see “Identifying the Need for Separation Between Modes” in Chapter 5, Section 5.3, Design Elements and the MassDOT Separated Bike Lane Planning and Design Guide, Chapter 2.
Figure 3-7: Types of Bicyclists and their Stress Tolerance
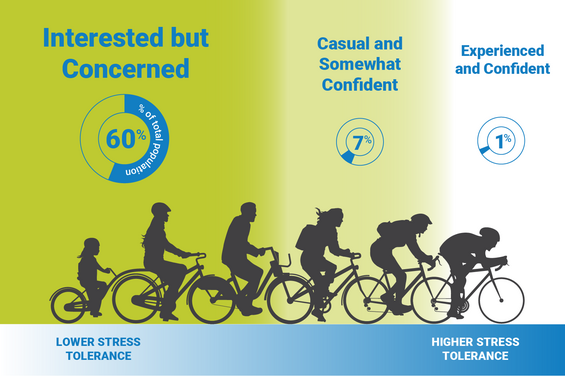
Source: MassDOT
Spatial Needs of Bicyclists
While the different bicyclist user types help the designer make decisions about the need for separation, this section focuses on operational needs within a bicycle facility, taking into account interactions between people biking. The bicyclist’s operating characteristics include physical device width, effective operating width needs including riding space and passing space, shy distance, angle of lean when negotiating curves, and sight distances. These characteristics differ based on the type of bicycle. These spatial needs discussed in this section are relevant to navigation within a bicycle facility as opposed to separation from other modes, which is discussed above and in Section 3.6, Speed and Chapter 5, Section 5.3, Design Elements.
A wide variety of bicycle types can be found across the Commonwealth. These include an adult’s typical bike, cargo bikes, bikes with trailers, recumbent bikes, tandem bikes, adult tricycles, and extra-large bikes. The following spatial needs are based on three types of bicycles, assumed to be operated by an adult:
- Typical bike – upright bike, including electric and non-electric options
- Cargo bike – bike with a front or rear cargo area, with or without a trailer
- Extra-large bike – a freight tricycle or pedicab
In general, 8.3 feet is the vertical operating space needed to accommodate an adult standing upright on the pedals.
Effective Operating Width
The effective operating width of a bicycle facility is based on two factors, as illustrated in Figure 3‑8:
- Riding space
- Passing space
Figure 3-8: Elements of Effective Operating Width and Total Bicycle Facility Width
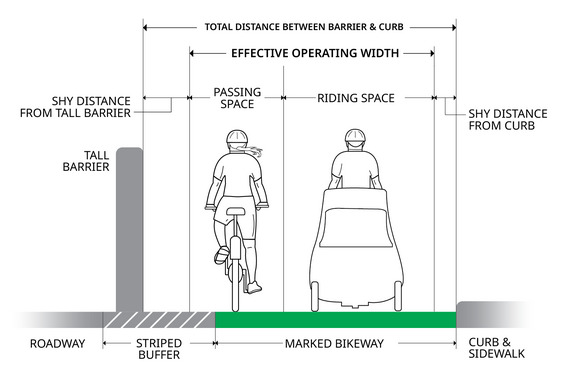
Source: Adapted from Designing for Small Things with Wheels, NACTO, 2023.
The total width of a bicycle facility is the sum of the effective operative width and side clearances to barriers and curbs to account for shy distance. Refer to Chapter 11, Section 11.4 Shared Use Path Design or the MassDOT Separated Bike Lane Planning & Design Guide, Chapter 3 for guidance on shy distance.
The necessary riding space and passing space vary by type of bicycle. Table 3‑2 presents requirements for one-way riding space and passing space for three bicycle types adapted from NACTO’s Designing for Small Things with Wheels. The AASHTO Guide for the Development of Bicycle Facilities (2012) also provides physical dimensions of various bicycle types. For determining effective operating width, the passing device is the design bike, and the vehicle being passed is the control bike. The design and control bike for intersections, crossing, and other design elements will differ according to critical dimensions. For example, a typical bike with a child or cargo trailer may be the design bike for confined spaces such as a median crossing island.
Riding space should accommodate the widest device that people will ride in the bicycle facility. In Massachusetts, the designer should assume that the bicycle facility needs to accommodate, at a minimum, comfortable riding space for a cargo bike. The cargo bike is the default control bike. Comfortable riding space is defined as the device width, plus 1.5-2.5 feet to account for natural side-to-side movement that varies with speed, stability, and level of comfort. A cargo bike requires 4.5-5.5 feet for comfortable riding space, as shown in Table 3‑2. The low end of the comfortable riding space range can also be defined as the minimum operating envelope, and the high end of the range as the preferred operating envelope.
Passing space should be based on the device that people will tend to ride faster, passing slower riders who are in the riding space. On most bicycle facilities, the typical bike is the design bike. However, in contexts where a higher percentage of people biking need capacity for carrying goods or passengers, a cargo bike or extra-large bike may be assumed to use the passing space.
| Type of Bicycle | Device Width | Comfortable riding space for one way bicycling (control device width plus 1.5-2.5 feet) | Passing space for faster rider during a passing event (design device width plus 0.5 feet) |
|---|---|---|---|
| Typical Bike | 2.5 feet | 4-5 feet | 3 feet |
| Cargo Bike | 3 feet | 4.5-5.5 feet | 3.5 feet |
| Extra-Large Bike | 4.5 feet | 6-7 feet | 5 feet |
Source: Adapted from Designing for Small Things with Wheels, NACTO, 2023.
One-Way Passing Needs
Table 3‑3 presents the effective operating width needed for comfortable passing on one-way bicycle facilities for several combinations of bicycle types. These widths represent ideal conditions. The designer should be clear about assumptions regarding space provided for passing maneuvers, especially for constrained conditions. The designer should note that:
- Engineering Directive E-20-001 sets the minimum width for a one-way bike lane at 5 feet, which allows comfortable riding space for a person on a cargo bike without passing space for faster riders, or infrequent and uncomfortable passing maneuvers between people riding typical bikes.
- MassDOT’s Separated Bike Lane Planning & Design Guide recommends a preferred width of 6.5 feet for a one-way separated bike lane, which allows for comfortable riding space for a typical bike and constrained passing space for another typical bike.
Accommodating different biking speeds and higher passing frequency requires more space for passing maneuvers. The designer should seek opportunities to allow a cargo bike to be passed by either a typical bike, another cargo bike, or an extra-large bike if appropriate based on the roadway context. On higher-volume bicycle facilities, greater passing frequency should be expected.
The designer should also consider the ease of maneuvering out of the bike lane for passing. For example, faster riders can merge into the adjacent travel lane to pass slower riders in a bike lane without a vertical separation, or they may be able to use the buffer space next to a sidewalk-level bike lane to pass slower riders. However, in a separated bike lane, faster riders may not have the option to move out of the bike lane and therefore require wider passing space.
| Type of Bicycle Passing | Typical Bike Being Passed | Cargo Bike Being Passed | Extra-Large Bike Being Passed |
|---|---|---|---|
| Typical Bike | 7-8 feet | 7.5-8.5 feet | 9-10 feet |
| Cargo Bike | N/A | 8-9 feet | 9.5-10.5 feet |
| Extra-Large Bike | N/A | N/A | 11-12 feet |
Note: The faster rider is assumed to pass the slower rider. Larger bicycle types are assumed to move more slowly. Therefore, larger bicycle types are not assumed to pass smaller bicycle types.
Source: Adapted from Designing for Small Things with Wheels, NACTO, 2023.
Two-Way Passing Needs
The necessary effective operating width for a two-way bicycle facility depends on how busy a bikeway is expected to be.
- On lower-volume bikeways (less than 150 bidirectional riders per peak hour), faster riders can pass slower riders by changing lanes during a gap in the opposing flow.
- On higher-volume bikeways (150 or more bidirectional riders per peak hour), faster riders may pass slower riders even when a gap is not present, requiring space for three people to bike side-by-side in a space that temporarily feels narrow for each rider.
Table 3‑4 presents the effective operating width needed for lower- and higher-volume two-way bicycle facilities for several bicycle types. It assumes the same type of bicycle is operating in both directions (for example, cargo bikes in either direction). The designer should note that:
- Engineering Directive E-20-001 sets the minimum width for a two-way bicycle facility at 10 feet, which requires riders to wait for a gap to change lanes and pass.
- MassDOT’s Separated Bike Lane Planning & Design Guide recommends a width of 11 feet for moderate-volume two-way separated bike lanes. 11 feet allows two people on typical bikes to travel in opposite directions while passed by a third person on a typical bike, or it allows two people on cargo bikes to travel in opposite directions, while a faster rider waits for a gap to pass. A recommended width of 14 feet for higher-volume two-way separated bike lanes allows two people on cargo bikes to travel in opposite directions while passed by a third person on a cargo bike.
See Chapter 11 for guidance on the recommended effective operating width of shared use paths, which typically accommodate use not only by people biking, but also by people jogging, skating, dog-walking, using a wheelchair, and maintenance vehicles.
| Type of Bicycle Being Passed | Width Needed for Comfortable Two-Way Operations (Lower Volumes) | Width Needed for Passing and Side-by-Side Riding (Higher Volumes) |
|---|---|---|
| Typical Bike | 8-10 feet | 11-13 feet |
| Cargo Bike | 9-11 feet | 12-14 feet |
| Extra-Large Bike | 12-14 feet | 15-17 feet |
Note: Comfortable two-way operations require double the one-way riding space. On lower-volume facilities, faster riders are assumed to wait for a gap to pass. Two-way operations on higher-volume facilities adds 3 feet passing width to the comfortable two-way operations width.
Source: Adapted from Designing for Small Things with Wheels, NACTO, 2023.
Influence of Surface Quality and Obstacles on Bicyclists
The operating behavior of a person biking is influenced by sensitivity to the surface quality of a facility and the presence of obstacles. People biking are sensitive to surface quality because of the minimal tire surface contact with the ground and the susceptibility of bicycle tires to damage. The minimal tire contact means that longitudinal seams and cracks, debris, metal utility covers and decking, and skewed railroad tracks can precipitate a crash. Longitudinal cracks as narrow as ¼ inch and surface edges higher than ½ inch can cause loss of control. Avoidance of obstacles such as utilities or temporary traffic control devices forces bicyclists to swerve. These swerving maneuvers may be unexpected by a driver or pedestrian sharing the same space or in an adjacent facility. Placement of obstacles in the travel path of bicyclists should be avoided.
People Driving (Drivers/Motorists)
Drivers include people of varying ages and abilities, in vehicles ranging from small personal sedans to large commercial trucks. Although drivers (like other roadway users) are expected to comply with traffic laws and operate their vehicles in a responsible manner, they will inevitably make operating errors. Therefore, anticipating such mistakes as part of a Safe System approach to designing transportation infrastructure can significantly reduce the severity of crashes that do occur. For example, with physical roadway treatments effectively implemented, streets become self-enforcing, reducing speed-related conflicts and serious crashes. The AASHTO Green Book discusses human factors in detail.
Spatial Needs of Motorists
Designers should consider the largest types of vehicles likely to use that facility on a regular basis to select a design vehicle and a control vehicle and to determine design values.
- The design vehicle is the largest vehicle that is expected to frequently use a facility and make specific movements, for example, through intersections or on turning roadways. Examples include buses and single unit trucks in urban area types, WB-62 tractor trailers in rural area types, and WB-67 tractor trailers on or near freeways. In many contexts, designs allow the design vehicle to make lane-to-lane maneuvers without encroaching on adjacent lanes. In other contexts, encroachment is acceptable and associated with speed management treatments.
- The control vehicle is the largest infrequent vehicle for which specific movements need to be accommodated. Examples include non-articulating fire trucks in urban settings, wide farm machinery or WB-67 tractor trailers in rural settings, oversize/overweight (OSOW) vehicles and other permitted loads on designated freight routes. Designs allow the control vehicle use available pavement to complete maneuvers, which may require encroaching into adjacent lanes.
Typically, trucks and buses require larger design values than passenger cars, which makes determining the appropriate design vehicle an important design consideration. Table 3‑5 summarizes the range of vehicle dimensions. Actual vehicle widths may vary from the dimensions listed in the table due to manufacturer and aftermarket vehicle variations such as side view mirror extensions.
On some streets the design might not fully accommodate all vehicles or trucks with the knowledge that vehicles may have to slow down or move to the side, or at intersections one vehicle can back up while another turns or can encroach upon opposing lanes. These types of decisions can be informed by the area type, roadway type, and site-specific characteristics, including the frequency of larger vehicles and the amount of other traffic.
| Vehicle | Vehicle Height | Vehicle Length | Vehicle Width | Operating Width1 |
|---|---|---|---|---|
| Passenger Cars and Light Trucks | 4.3 feet | 19.0 feet | 7.0 feet | 9.0 feet |
| School Bus (65 pass.) | 10.5 feet | 35.8 feet | 8.0 feet | 10.0 feet |
| Transit Bus | 10.5 feet | 40.0 feet | 8.5 feet | 10.5 feet |
| Single Unit Truck2 | 11.0-13.5 feet | 30.0 feet | 8.0 feet | 10.0 feet |
| Tractor-Trailer | 13.5 feet | 69.0 feet | 8.5 feet | 10.5 feet |
Notes:
1Assuming one-foot clearance on both sides of vehicle
2The SU-30 design vehicle is commonly used to model emergency response vehicle operations
Source: A Policy on the Geometric Design of Streets and Highways, AASHTO, 2018, Chapter 2 Design Controls and Criteria
Motor vehicle dimensions, characteristics, and operating speeds influence design criteria in the following ways:
- Stopping sight distances depend on the speed of operation and vehicle braking characteristics.
- Horizontal curvature depends on the side friction between tire and roadway, among other factors.
- Truck acceleration and deceleration rates are factors in the design of highway vertical alignment.
- Vehicles are restricted in how sharply they can negotiate a turn by their physical dimensions and tire friction, which influences curb radii at intersections.
- Another turning characteristic of vehicles is the transitional nature of their turning path. Vehicles cannot immediately turn to their desired turning radius but have an entering and exiting transition into that radius. This has led to the use of compound curves on highways.
- Lane and shoulder widths are derived from the design width of vehicles and horizontal clearances to allow safe operation.
Further discussion of design and control vehicles is provided in Chapter 6 of MassDOT’s Guidelines for the Planning and Design of Roundabouts, and in the AASHTO Green Book.
Driver Level-of-Service Measures
The level of service (LOS) for drivers on a facility reflects the capacity provided for motor vehicle travel at intersections. Different LOS measures apply to different components of the roadway. In general, there are two categories of vehicular LOS measures:
- Uninterrupted flow on limited-access roadways (two-lane highways, multi-lane highways, freeway segments, and freeway ramps) for which level of service is based on the concepts of average travel speed, percent time following, and density measures.
- Interrupted flow at intersections (signalized intersections, unsignalized intersections, and roundabouts) for which level of service is based on the amount of delay experienced by vehicles using the facility.
LOS measures for motor vehicles range from LOS A to LOS F, with LOS E representative of operation approaching or at capacity or entailing long control delays. The Highway Capacity Manual (HCM) provides procedures for determining LOS for a variety of facility types and discusses the strengths, weaknesses, and complexities of these measures.
LOS for motor vehicles is one of many design considerations, and it should not be prioritized over the safety of all potential users, especially people walking, biking, and taking transit.
Public Transit Vehicles and Passengers
Public transit within a roadway is usually provided with transit buses. A representative bus used by the local transit agency should be included as a design vehicle or control vehicle on roadways where transit service is provided, or is anticipated during the expected life of the project. The designer should also consider the design characteristics and potential location of bus stops, stations, and other intermodal facilities. Most buses are lift equipped, generating the need for a five-foot (measured at the curb and parallel to the vehicle) by eight-foot (measured from the curb or vehicle edge) level pad adjacent to the accessible sidewalk. This allows for the deployment of the lift and space to maneuver on and off of it. The designer should also ensure that pedestrian connectivity—including curb ramps, pedestrian crossings at bus stops, and accessible drop off areas to these facilities are provided.
Source: MBTA
In less frequent circumstances, rail transit is provided along a roadway or within a center median. The detailed clearance, station, and operational needs of rail transit should be integrated into the roadway design in these conditions. Other features such as exclusive lanes and traffic signal pre-emption can improve transit operations within a roadway. Transit design considerations are discussed further in Chapter 5, Chapter 6, Chapter 12, as well as in MBTA resources including:
National guidance can be found in NACTO Transit Street Design Guide.
In terms of level of service, there are many measures of transit quality of service as outlined in the Controlling Criteria for Transit Provisions (E-20-001), MBTA’s Transit Priority Toolkit, and the Transit Capacity and Quality of Service Manual. Most of these, such as vehicle type, operating hours and frequency of service, are independent of roadway design. For the purpose of roadway design, the key considerations are the location and design of bus stops, transit travel time and on-time performance, the pedestrian and bicycle routes connecting to the facility, and waiting areas to access transit.
Specific projects may include transit design elements that influence the roadway design, including bus lanes and bus stops. Where transit operations are present or expected, the designer should coordinate with the transit agency during the project development process to ensure that transit operational requirements are included in the design.
3.4 Transportation Demand
Transportation demands – volume, composition, and patterns – are important design controls. Understanding the existing and potential demands of various users on the facility can inform and support design decisions that meet the overall project goals and specific needs of each user. Community planning goals, the selected design year, and performance measures for a project are key determinants of how the design fulfills the project need.
Design Year
Projects are designed to accommodate travel demands likely to occur within the life of the facility under reasonable maintenance. This involves projecting future conditions for a selected planning horizon year. Projections of future demand for major transportation investments are usually made for the 15- to 25-year range. For large projects, the designer should usually select 20 years from the expected facility completion date as the design year. This is a reasonable compromise between a facility’s useful life, the uncertainties of long-range projections, and the consequences of inaccurate projections. For smaller, less capital-intensive projects, a 5 to 10-year planning horizon is generally used. To implement immediate safety or operational countermeasures, designs reflecting current year conditions may be acceptable.
Forecasts of future activity levels should reflect community and regional plans, community setting, and the project need. Based on these considerations, future conditions forecast represents a technical analysis and policy consensus on the type and developed intensity of land use, future regional economic activity, presence of transit service, the needs of pedestrian and bicyclists, and many other factors. Many municipalities also set mode use goals as part of their Transportation Plans or Master Plans. In cases where mode use goals have been set by a municipality for a future year, planners and designers should use those goals to inform future travel forecasts.
Forecasts of future activity levels should include estimates of potential pedestrian and bicycle activity, not just existing counts. Particular care must be used when forecasting pedestrian and bicycle volumes. Many times there is latent demand above observed pedestrian and bicycle volumes because pedestrian and bicycle facilities do not yet exist in the project area, are substandard, seasonally utilized, or do not provide complete connectivity to attractions. It is important to evaluate future land development, including any potential attractors such as transit stops, schools, parks and retail uses that may be located near moderate and high-density residential development.
Planners and designers need to determine the appropriate estimates of activity levels for design. Details outlined below. Although the typical process for forecasting traffic volumes assumes that traffic will increase over time, there are situations where traffic volumes may decline or remain relatively constant over time. It is important that traffic forecasts for a roadway design project reflect likely conditions over the project’s life and are not selected arbitrarily. Municipal planning departments, regional planning agencies, planning, as well as MassDOT, can provide assistance in seasonal adjustments and in validating the assumptions regarding future user estimates.
Volume and Composition of Demand
The composition of transportation demand is an important element in the design of roadways. The designer should develop a realistic design scenario including the volume and mix of activity for all modes as described below.
Pedestrian Demand
Existing and potential demand for pedestrian use are needed as input to the planning and design of roadway facilities. Understanding pedestrian demand includes:
- Existing pedestrian volumes – Pedestrian counts and observations should be collected in fair weather to determine existing pedestrian flows and patterns. The pedestrian counts should include sidewalk or shared use path volumes and crossing volumes.
- Peak travel times for walking do not always correspond with motor vehicle peak hours. It may be important to complete pedestrian counts for other times of the day and/or on weekends, depending on the project area. For example, if a project area is heavily influenced by a school, it is important to observe pedestrian flows during morning and mid-afternoon periods. Public assembly facilities and transit stops or stations also merit special consideration because they can produce high volumes of pedestrians over short durations.
- To determine the appropriate locations for pedestrian counts (including project area intersections), it is important to review current walking routes between activity centers. Informal paths or crossing locations may warrant supplemental observations during project planning.
- The designer should consider the volume of people waiting to cross the street at corners, traffic islands, and medians to inform the need for storage/waiting space.
- Before collecting count data for a particular facility, the designer should reference data from continuous count programs or from aggregated location-based data services, if available.
- For more information on developing a count program or using and adjusting data from a count program, refer to NCHRP Report 797: Guidebook on Pedestrian Bicycle Volume Data Collection (2014).
- Potential walking demand – The designer should evaluate the project area to determine if there is latent demand for new or improved pedestrian facilities due to an uncomfortable existing walking environment, missing links in the pedestrian network, or expected changes in development patterns.
- For statewide and regional analysis, MassDOT’s Potential for Walkable Trips by Regional Planning Agency map in MassDOT GeoDOT predicts where people are reasonably expected to walk for everyday travel if safe, comfortable, and convenient pedestrian ways are available.
- The likelihood of latent demand can be assessed by looking at surrounding land uses and destinations. This may include a dense village center with dozens of destinations, or a major arterial with a hotel on one side and a food establishment on the other side of the road.
- Conditions like pathways worn along the roadside can indicate that desired pedestrian connectivity is underserved.
Bicycle Demand
Designing for people biking is primarily focused on designing for potential users, those that are interested but concerned as highlighted in Section 3.3 Roadway Users. Understanding bicycle demand includes:
- Existing bicycle volumes – Bicycle counts should be completed in fair weather to determine existing bicycle flows and patterns, including crossing movements. Peak travel times for biking do not always correspond with motor vehicle peak hours. It may be important to complete bicycle counts for other times of the day (beyond the typical morning and evening motor vehicle peak hours) and/or on weekends, depending on the project area.
- To determine the appropriate locations for bicycle counts (including project area intersections), it is important to review current bicycle routes between activity centers. Informal paths or crossing locations may also warrant supplemental observations during project planning.
- Schools, public assembly facilities, and transit stops or stations merit special consideration because they can produce high volumes of bicycle use over short durations.
- Before collecting count data for a particular facility, the designer should reference data from continuous count programs or from aggregated location-based data services, if available.
- For more information on developing a count program or using and adjusting data from a count program, refer to NCHRP Report 797: Guidebook on Pedestrian Bicycle Volume Data Collection (2014) and NACTO’s Urban Bikeway Design Guide Working Paper: Making Bikes Count (2022).
- Potential bicycle demand – The designer should identify where and how many people are likely to bike if safe and comfortable facilities exist. Designers should always identify demand for everyday trips like commuting, running errands, shopping, recreation, or visiting family and friends, for example. Additionally, the potential for roadways to serve longer recreational trips (more than six miles) should be considered. Potential demand can be assessed at a high level by using the project’s area type and at a more detailed level by identifying origins and destinations. To estimate potential demand, designers should consider that an everyday biking trip tends to be less than 3 miles (average of 16-minute bike ride) and 6 miles for commuting (see the Massachusetts Bicycle Transportation Plan for more information). The designer should consider destinations within 3 miles as generators for potential for everyday biking trips and what facilities are needed to connect to and between destinations.
- For statewide and regional analysis, MassDOT’s Potential for Everyday Biking by Regional Planning Agency map in MassDOT GeoDOT predicts where people are reasonably expected to bike for everyday travel if safe, comfortable, and convenient bikeways are available.
- The designer should evaluate the project area to determine if there is potential demand for bicycle accommodation due to an uncomfortable existing bicycle environment, missing links in the bicycle network, or expected changes in development patterns.
- The designer should also consider potential crossing movements, storage needs while waiting to cross a street, and bicycle parking.
Motor Vehicle Traffic Volumes
Daily, peak hour, and patterns of motor vehicle traffic are needed as input to the planning and design of roadway facilities. Some key definitions of traffic volume measures are listed below:
- Average Annual Daily Traffic (AADT) — The total yearly volume of automobiles and trucks divided by the number of days in the year.
- Average Daily Traffic (ADT) — The calculation of average traffic volumes in a time period greater than one day and less than one year. (ADT is often incorrectly used interchangeably with AADT.)
- Peak-Hour Traffic (PH) — The highest number of vehicles passing over a section of highway during 60 consecutive minutes. T(PH) is the PH for truck traffic only.
- Peak-Hour Factor (PHF) — A ratio of the total volume occurring during the peak hour to the maximum rate of flow during a given time period within the peak hour (typically is 15 minutes).
- Design Hourly Volume (DHV) — The one-hour volume in the design year selected for determining the highway design. (In many cases, designers look at the typical worst case weekday morning or evening peak hour or the 30th highest hour of the year to assess the geometric requirements of their design.)
- K-factor (K) — The K-factor is the percent of daily traffic that occurs during the peak hour.
Manual turning movement counts (TMCs), including heavy vehicle movements, at intersections, and automatic traffic recorder/vehicle classification counts (ATRs) counts along roadways are generally needed for planning and design of transportation projects and can be used to provide estimates of the values listed above. The designer is encouraged to collect counts across a full day or multiple days to understand fluctuations in volumes, especially for roadways that operate with excess capacity outside the peak hour. These counts should also include pedestrian, transit, and bicycle activity.
Motor Vehicle Design Volumes and Traffic Composition
The design hourly volume (DHV), or daily peak hours, will affect many design elements including the desired number of travel lanes, lane and shoulder width, and intersection layout. The design volume may also influence the motor vehicle level of service provided and level of separation and comfort for people walking and biking.
Daily traffic estimates are also useful in making design decisions related to the total user benefit of a proposed improvement. For example, the benefit of highway safety roadside improvements is directly related to the crash exposure (expressed in ADT) on the road.
Sometimes, selection of the design hour entails judgment regarding the conversion of daily traffic to peak hour traffic volumes. Other times, when data from continuous traffic count stations are used, the design hourly volume is based on the peaking characteristics of the facility over an entire year. For rural areas, the DHV is typically based on the 30th or 50th highest hour. In urban areas, the DHV typically represents the 100th highest hour. In some circumstances, a lesser design hour is appropriate. These design hour volumes are usually selected since they capture operating conditions expected to occur on a regular basis and have been shown to have dependable statistical relationships to measured ADT on a roadway.
The choice of the design hour volume has a significant impact on the characteristics of a project. Designers should ensure that the design hour volume is selected such that the facility is well-matched to the traffic volumes it will carry on a regular basis and is not “over-designed.” For example, accommodating a high volume expected to occur infrequently will result in a project that is costly and has significant adverse impacts. Likewise, accommodating a lower design volume that is frequently exceeded may result in significant congestion.
Large or heavy vehicles, such as trucks and buses, have different operating characteristics from passenger cars and bicycles and can affect traffic operations. Therefore, the number of trucks and buses expected to use a facility needs to be estimated for both the daily and peak hour conditions, in planning and design.
For highway capacity purposes, “heavy vehicles” are typically defined as all buses, single-unit trucks, and truck combinations other than light delivery trucks. (Light delivery trucks have two axles with four tires). In addition, the impact of transit operations (such as buses making stops along a roadway) must be considered in operational analysis of the roadway.
Transit Frequency and Volume
Existing and planned transit frequency and volume should be understood to help inform project development and design. Transit services include fixed and non-fixed route service provided by bus, shuttle, streetcar, or trolley service owned or operated by a Regional Transit Authority (RTA), the Massachusetts Bay Transportation Authority (MBTA), or other public agency or local or state authority. When estimating transit traffic volumes for future years, service increase or expansion plans from Transit Agencies, such as the MBTA’s Bus Network Redesign, should be incorporated.
Transit considerations are discussed further in Chapters 5 and 6. For further guidance, refer to:
- MassDOT’s Engineering Directive E-20-001, which contains Controlling Criteria for transit priority treatments and transit stop amenities
- MBTA’s Transit Priority Vision and Toolkit
- MBTA’s Bus Stop Planning & Design Guide
- NACTO’s Transit Street Design Guide
3.5 Measures of Effectiveness
Through the project development process and with public input, the designer should evaluate the project (and its alternatives, if applicable) using several measures of effectiveness. Measures of effectiveness are outlined below.
Safety
The safety of transportation facilities is a primary concern in planning and design. MassDOT has shifted to a proactive Safe System approach with focus on preventing serious crashes and fatalities and is committed to incorporating the use of dynamic tools to identify and reduce inherent risks throughout the transportation system. This approach is data-driven, proactive, and strategic, instead of reacting to crash events. While some projects are specifically proposed to address known safety problems, all projects should result in safe facilities for all potential users. Corridor and intersection safety audits, analysis of crash records, and network screening can be useful for identifying both existing and potential safety deficiencies. Project design elements should be selected based on their historic safety performance and expected operating characteristics. The MassDOT Safety Alternatives Analysis Guide provides methods and instructions for interpreting safety performance measures, such as predicted crash frequency, and is designed to assist with the data-driven approach to prioritizing safety in projects. It includes tools for performing project alternative analysis through the lens of safety. It can be used to inform decisions at the project and program level to direct efforts that reduce the frequency of fatal and serious injury crashes.
System Preservation
System preservation is the extent to which the project maintains and improves existing assets and the potential cost of deferring the project. Projects on existing facilities should return a facility to a state of good repair or modernize by addressing existing structural, pavement surface, signal, ancillary structure, or other deficiencies for all users. Techniques such as pavement testing, and bridge and ancillary inspections can be used to identify existing deficiencies.
Mobility and Connectivity
Mobility is the extent to which the project improves the mobility of all users. Measures include motor vehicle mobility and congestion, pedestrian mobility and accommodations, bicycle mobility and accommodations, transit mobility accommodations, and accessibility for users with disabilities. The effectiveness of these projects can be measured by the degree to which they improve reliability, comfort, and safety of that mode. In some cases, projects are proposed to fill in missing links within a network so that connections by a particular mode are possible, and in other cases projects create the first link in an envisioned network.
Social Equity
Projects can serve or impact individual communities and demographic groups disproportionately. Demographic analyses based on race, income, and other factors are helpful to understand and address these differential impacts. Other measures may include positive environmental impacts for Environmental Justice communities, Title VI communities, and Housing Choice Initiative locations.
Economic Impacts
Economic development is often an important consideration in project planning and design. Some projects are proposed specifically to spur economic development. In other cases, a project could cause concern about a mismatch between the type of development proposed (e.g., auto-oriented) and the area’s vision for future growth (e.g., transit-oriented), or a project could cause concern about gentrification. Economic analyses can be helpful to measure the extent to which a project provides economic benefits to residents, local businesses, and the region. Measures may include positive economic impact on area, improvements to an existing labor market, improvements to workforce commuting and accessibility, and improvements to freight corridors.
Environmental Effects
Projects can impact environmental and community resources to different degrees. Highly effective projects minimize their impacts to these resources or create a positive effect, for example, by enhancing climate resilience. Projects should measure the extent to which the project meets the State goals of improving air quality and reducing greenhouse gases, manages stormwater, preserves wetlands and other natural areas, preserves wildlife, designs for climate resiliency.
Community Enhancement
Transportation projects are an important aesthetic and experiential element within communities. Well-designed facilities can complement their surroundings, while poorly designed projects can be a detriment to the visual experience of users and facility neighbors. Aesthetics are subjective and require qualitative metrics to measure, often gathered through public opinion surveys and community engagement techniques that give members of the public an opportunity to select or rank the visual elements that they find pleasing. Illustrative graphics and three-dimensional modelling can help a project team communicate and seek input on aesthetic and experiential elements of the design. Some projects are proposed specifically to mitigate impacts of existing transportation facilities, such as noise, vibration, and air quality.
Policy Support
The extent to which the project supports federal, state, regional, local policies and risk not accounted for in other criteria.
- Statewide Policies and Plans – project is mentioned in a statewide plan or fulfills the goals of a Massachusetts or MassDOT policy
- Regional Policy – project is supported by a regional study or plan
- Local Policy – project is supported in the municipality’s Master Plan or other municipal plan
- Public Outreach – project is supported by public with little opposition
- Risks – Design risks, construction risks, right of way risks, environmental risks, and utility risks have been addressed and/or anticipated early in the process
3.6 Speed
Speed is a major contributing factor to the safety of a roadway, and the geometric design of a roadway is a major contributing factor to the speed of motor vehicles on the roadway. Speed is defined as the distance traveled by an object in a certain period of time. Speed is commonly expressed in miles-per-hour (mph) or feet-per-second in the context of transportation planning and design. This chapter expresses speed in mph.
According to the FHWA, Safer Speeds are reduced speeds that accommodate human-injury tolerances by:
- Reducing impact forces
- Providing additional time for drivers to stop
- Improving visibility
Safer Speeds is one of the five elements of a Safe System Approach. Designing roadways for appropriate safe speeds, implementing speed management practices, and understanding the needs for each roadway user can support the Commonwealth’s goal of zero fatalities on the roadway network. Figure 3‑9 shows how the driver’s cone of vision is reduced at higher speeds and how the percentage of crashes that result in a pedestrian fatality or serious injury increases from 18% to 77% as the motor vehicle speed at which the crash occurs increases from 20 mph to 40+ mph. When vehicle speeds exceed survivable levels, the transportation facilities should separate people and motorized vehicles in time and space.
Figure 3-9: Relationship between Speed, Safety, and Driver's Cone of Vision
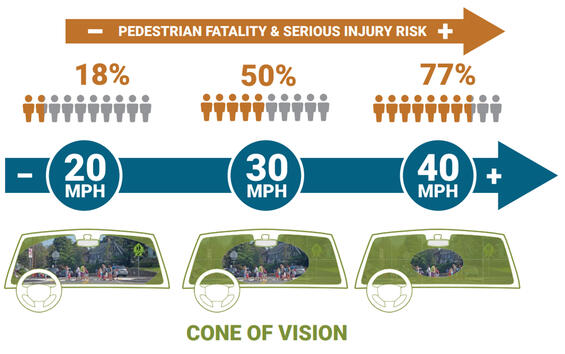
Source: Adapted from FHWA Achieving Multimodal Networks (2016) and Tefft, B.C. (2011). Impact Speed and a Pedestrian's Risk of Severe Injury or Death. Washington, D.C.: AAA Foundation for Traffic Safety
Achieving Safer Speeds starts with selecting the appropriate target speed and design speed for each roadway. This section contains guidance to support the designer in the selection of these speeds.
Speed Concepts and Definitions
Basic concepts related to speed are defined below and are used throughout the remaining discussions in this section.
- Operating Speed – the measured speed at which drivers are observed operating their vehicles in fair weather conditions during off-peak hours. Operating speed is measured at discrete points along a roadway. Operating speeds are usually reported using percentile speeds with the 50th percentile (median) and 85th percentile (the speed at which 85 percent of vehicles are traveling at or below) speeds often used to characterize the existing operating speed on a roadway.
- The roadway’s features such as curves and topography, width, access to adjacent properties, presence of people outside vehicles, land use, landscaping, parking, traffic control devices, lighting, etc., affect the operating speed.
- During peak periods, when traffic congestion or intersection operations are controlling movement along a corridor, observed operating speeds may be substantially lower than the operating speed measured during off-peak conditions when the roadway’s physical features and context are primarily influencing the operating speed.
- Target speed – A selected speed used to identify the highest operating speed at which vehicles should operate in a particular context to provide safer environments for all roadway users. Used to identify speed management measures and select design speed.
- Design speed– A selected speed used to determine the various geometric design features of the roadway for vehicles such as horizontal alignment, vertical alignment, cross slope, and separation of user types.
- Speed limit – The maximum lawful vehicle speed for a particular location as displayed on a regulatory sign and approved by MassDOT per Massachusetts General Laws (MGL) c.90§18 or MGL c.90§17D or a statutory limit as established by the Massachusetts State Legislature per MGL c.90§17, MGL c.90§17C, or MGL c.90§18B; the legally enforceable speed drivers must follow.
Purpose of Target Speed and Design Speed
The past practice of setting a design speed five or ten mph greater than the existing posted speed limit is not appropriate in most contexts. There is no requirement that the designer select a design speed based on the existing posted speed limit. As communities change, the current motor vehicle operating speeds and speed limits may no longer match the adjacent land use (area type) or the existing or planned road design. If the design speed of a roadway is increased during each project, operating speeds may perpetually increase, potentially creating an environment that works against project or community goals related to safety and multimodal travel.
The objective of selecting a target speed is to inform the selection of a design speed and design treatments that aim to achieve operating speeds that are appropriate for the context and mix of roadway users.
Although target speed informs and influences various design elements, it does not directly control the design geometry. Instead, target speed informs:
- The need for, selection, and frequency of speed management measures
- The type of facilities for people walking and biking
- The use of landscaping elements to create a sense of enclosure or terminated vista
Conversely, design speed controls the following elements, which include, but are not limited to:
- Minimum curve radii
- Maximum grade
- Superelevation rate
- Stopping sight distance
- Taper for lateral shifts
- Roadside design criteria
- Yellow and all-red clearance intervals at traffic signals
- Separation for bicycle facilities
The sections below discuss the process and factors for identifying target and design speed.
Overview Process for Identifying Target and Design Speed
The process for identifying target and design speed is summarized in Table 3-6.
| Project Development Step | Target Speed Process | Documentation | Review |
|---|---|---|---|
| Scoping | Identify target speed and design speed range |
|
|
| Pre-25% | Verify existing operating speed. Assess a target speed appropriate for the project context. Determine if speed management is needed to achieve target speed. If so, select speed management measures. Finalize target speed and select design speed. Assess the need for separation between motor vehicles and people walking and biking. |
|
Approval:
|
| 25% | Design project based on design speed. |
|
|
| Through 100% / PS&E | Confirm design elements meet target speed, design speed(s), and user separation needs. |
|
|
Source: MassDOT
The target speed and design speed should be identified in the early stages of the project development process through collaboration with a multi-disciplinary team that is responsible for developing the project scope. Table 3‑6 shows the process for identifying target and design speeds throughout the project development process, as follows:
- During project scoping, the designer should identify a target and design speed range based on the area type and roadway type in Table 3‑7 below. The target and design speed range should be documented in the Scoping Checklist for the Project Scoping Meeting and is reviewed by the District Project Development Engineer and MassDOT Highway Design.
- During pre-25% design, the designer should establish the project’s target and design speed by considering the project context, existing operating speed, and speed management treatments that may achieve the target speed. Both the target and design speeds should fall within the applicable design speed range. A project that serves multiple area types and roadway types or has varying factors may have multiple target and design speeds. The target and design speed selection should be documented in the Draft Design Justification Workbook (DJW). The Pre-25% OTS Review Meeting should result in consensus about target and design speed, with understanding that iteration during the 25% design phase may occur. Each District will determine who is responsible for reviewing the Draft DJW – the District Project Development Engineer and/or the District Traffic Engineer. MassDOT Highway Design will also review the Draft DJW. The designer should complete the following steps in the DJW:
- Verify the existing operating speeds
- Assess the factors described under the section “Establishing Target Speed” to establish a narrowed target speed range
- Assess the need for speed management strategies, select speed management measures, and assess whether they are expected to achieve operating speeds within the narrowed target speed range
- Select and justify the target speed
- In tandem, the designer should assess the need for separation between motor vehicles and people walking and biking based on the criteria and guidance in Chapter 5 Cross-Section and Roadside Elements, Section 5.3. Note that the need for separation will be influenced by the design speed.
- During 25% design, the designer should design the project based on the design speed, and finalize the design and target speed documentation in the DJW and the Functional Design Report (FDR). The DJW is reviewed by the District Project Development Engineer and MassDOT Highway Design, and the FDR is reviewed by the District Traffic Engineer and MassDOT Traffic and Safety. The District Traffic Engineer may also review the DJW based on the District’s discretion.
- Throughout the remaining stages of the project development, the designer should continue to verify that the project design meets the target speed, design speed(s), and user separation needs established in earlier stages.
Applicability of Target Speed
For most projects, target speed should be established to support the Safe System Approach by aligning roadway speeds with specific user and community goals and improve safety performance for all users on the facility.
The applicability of target speed is determined during project scoping. Projects that do not provide the opportunity to change operating speeds do not need to identify a target speed.
The methodology for identifying target and design speed is discussed in the following sections.
Identifying Target and Design Speed Range
Table 3‑7 provides a range of target and design speeds based on the area type and roadway type. The range of target and design speeds recognizes the diversity of roadway types, area types, and topographies and provides flexibility to the designer.
The target and design speed range is based on two factors:
- Area Type: Select an area type from the 9 area types described in Section 3.2 Roadway Context. The designer should account for surrounding land use and any known development or municipal master planning that would significantly change the character of the existing area type.
- Roadway Type: Select a roadway type based on role of roadway in the transportation system, as described in Section 3.2 Roadway Context.
| Area Type1 | Arterial Roadway Target and Design Speed Range (mph)2 | Collector Roadway Target and Design Speed Range (mph) | Local Roadway Target and Design Speed Range (mph) |
|---|---|---|---|
| Rural Natural | 25-55 | 25-45 | 15-35 |
| Rural Developed | 25-45 | 20-40 | 15-35 |
| Rural Village | 20-35 | 20-35 | 15-30 |
| Suburban Low Density Development | 20-45 | 20-40 | 15-35 |
| Suburban High Density Development | 20-35 | 20-35 | 15-30 |
| Suburban Town Center | 20-30 | 20-30 | 15-30 |
| Urban (Park, Residential, Central Business District) | 20-30 | 15-30 | 15-30 |
Notes:
1Table 3-7 does not apply to limited access roadways and freeways. The design speed range for a limited access facility such as a freeway is 50 to 75 mph regardless of area type.
2A design speed higher than these values, up to 55 mph, may be appropriate for multi-lane, divided arterials.
Establishing Target Speed
The designer should use engineering judgment to select an appropriate target speed by assessing eight factors described below.
- General Context and Need: Assess the first seven factors to identify whether target speed should be at the low or high end of the target and design speed range based on the general context and needs. This assessment is summarized in the Draft Design Justification Workbook (DJW).
- Project Achievability: Then, use the eighth factor, target speed achievability or appropriateness, to select the target speed for the project. This step requires considering the existing operating speeds, the design speed that current roadway elements meet, and the likely feasibility of implementing speed management, especially vertical and horizontal deflection countermeasures.
The designer shall document the target speed decision in the Draft DJW.
Target speed may vary along the overall length of the project based on changing context. A single project corridor may have segments with different target speeds. Examples include:
- Different area types along a corridor
- Transitions zones, typically from higher speed, free-flow segments outside a community to a residential or business district with lower existing or desired operating speeds
- Approaches to intersections
Factors for Establishing Target Speed
- Community input - Whether community members have expressed concerns about speed, safety, comfort, or the appropriateness of the facility for users of all ages and abilities. Input may have been received from various forums including public meetings, Road Safety Audits, and activities during a project’s planning / needs assessment phase.
- Safety risk - Risk for future crashes where speed could be a contributing factor. See MassDOT’s Systemic/Risk-based screening results within the “Speeding” Emphasis Area.
- Crash history - History of past crashes where speed may have been a contributing factor. See MassDOT and/or local crash data. Note that crash history may be incomplete, as not all crashes are reported, and crashes involving people walking and biking tend to be underreported.
- Activity level - How active a project area currently is or is expected to be, as indicated by density and mixes of adjacent land uses, presence of active public spaces, curbside demand, walking demand, biking demand, and transit demand.
- Crossing density - Density of crossing points based on signalized and unsignalized intersections, driveways, or other crossing points. Refer to NACTO’s “Crossing Point Density" guidance for details.
- Existing motor vehicle operating speed - Appropriateness of measured operating speeds, based on 50th percentile speed, 85th percentile speed, and percentage of drivers exceeding the speed limit.
- Existing or planned bicycle facilities (if applicable) - Level of separation for existing or planned bicycle facilities (consider influence of speed on need for separation).
- Target speed achievability or appropriateness - This factor requires iterative consideration of existing operating speeds, the design speed that current roadway elements meet, and the likely feasibility of implementing speed management, especially vertical and horizontal deflection countermeasures.
Establishing a Design Speed
In general, target speed and design speed should be the same. If the design speed is higher than the target speed, the roadway geometry will allow for and may encourage speeding. The roadway design should encourage an operating speed that matches the target speed, consistent with FHWA’s self-enforcing roadways concept. Alignment among target, design, and operating speed is expected for new construction and reconstruction projects that have the opportunity to change the roadway’s alignment.
State of good repair and targeted modernization projects within an existing layout have limited opportunity to change an existing roadway’s horizontal and vertical alignment. If speed management measures are not feasible, then target speed and design speed may not be the same (i.e., target speed is not achievable). However, the designer should not simply select the design speed based on the existing posted speed limit. To select design speed in these cases, the designer should use engineering judgment to:
- Consider the target speed, existing operating speed, the design speed selected when roadway was previously designed (if the project is on an existing roadway), topography, and driver expectancy.
- Consider potential speed reductions based on the design elements that are likely feasible for the project scope and context.
- Seek to minimize a differential between the target speed and design speed.
The designer shall document the design speed decision in the Draft Design Justification Workbook (DJW). Refer to the AASHTO Green Book for further guidance about design speed and its relationships to various design criteria.
Design Speed and Design Exceptions
Designers should not propose a design speed outside of the target and design speed range in Table 3‑7 for roadway or segment of a project as a design exception. A serious fundamental problem with accepting or allowing a design exception for design speed is based on its importance relative to all features of the roadway. A reduction in the design speed may potentially result in the unnecessary reduction of all of the speed related design criteria rather than just the one or two features, such as horizontal curves or cross slopes, that led to the need for the exception. The acceptable alternative approach to a design speed exception is to evaluate each geometric feature individually, addressing exceptions for each feature within the context of the appropriate design speed.
Occasionally, projects retain geometric elements, such as tight curves, superelevation, or restricted sight distances that are designed for a speed lower than the design speed for the corridor. This may be due to adjacent land use, or to environmental or historic constraints. In these cases, the designer should evaluate the need for an advisory speed consistent with the geometric features that do not meet the criteria for the design speed. For guidance, refer to Section 2C.59 of the MUTCD and FHWA's Methods for Establishing Advisory Speed.
Design Speed for Limited Access Roadways / Freeways / Interstates
For limited access freeways including Interstate Highways, the design speed range is from 50 to 75 mph. Additional guidance and details regarding the selection of design speeds for these types of facilities can be found in the AASHTO Green Book and the AASHTO Standards for Interstate Highways. Note that MassDOT’s target speed process does not apply to limited access roadways, freeways, and interstates.
Achieving Target Speed with Speed Management
Speed management is the use of design treatments to achieve target speed, reduce speeds, and therefore improve safety and comfort for the range of roadway users. Speed management can support creating a self-enforcing road to encourage drivers to select operating speeds consistent with the roadway features.
Benefits of speed management treatments may include:
- Reducing motor vehicle speed, thus reducing the frequency and severity of crashes
- Reducing the frequency and severity of vehicle-to-vehicle collisions and vehicle-to-property collisions.
- Reducing the likelihood of conflicts between people walking and driving
- Reducing the likelihood of conflicts between people biking and driving
- Reducing the frequency and severity of motor vehicle crashes involving people walking and biking
- Reducing the frequency of vehicle overtaking on urban and neighborhood streets
Designers should select speed management strategies based on target speed, existing operating speeds, and roadway users. Where the area type and roadway type support higher desired operating speeds, more separation is needed to reduce the risk of high-speed collisions by keeping vulnerable roadway users – those not protected inside of a motor vehicle – apart from higher-speed vehicles. Separation can be achieved with separated bike lanes, sidewalks, protected intersections, and other designs (see Chapter 5, Section 5.3). If separation is not achievable, then traffic calming should be implemented to lower vehicle speeds.
Table 3‑8 provides a summary of speed management treatments and potential speed reductions where data are available. All of these treatments have been implemented in Massachusetts. Speed management measures are most successful when consistently and uniformly applied. Not all speed management strategies require extensive implementation timelines and significant project budgets. Designers can use low-cost, lighter-weight materials such as flex posts and modular curbs to provide “quick-build” treatments. One benefit of this approach is that treatments can be implemented on an interim basis while longer-term, more capitally intensive solutions are being developed. For more information on these roadway treatments, see the Roadway Treatment Toolkit and Chapter 16. The toolkit and the MassDOT Safe Speeds website are resources that MassDOT will continually update with research, case studies, and additional guidance.
When selecting speed management measures, the designer should estimate the potential operating speeds that would be expected after the project is completed. FHWA’s Engineering Speed Management Countermeasures: A Desktop Reference of Potential Effectiveness in Reducing Speedincludes data on potential mean and 85th percentile speed reductions associated with speed management treatments. While these data are collected under differing circumstances and in different environments (volume of vehicles, rural vs. urban areas, etc.), they are a helpful gauge for what each countermeasure can achieve. The better estimate potential speed reductions for a particular project context, the designer can look for a similar area type, roadway type, and traffic volume in the FHWA table or reference other studies. The FHWA Traffic Calming ePrimer is an additional resource for the latest research and case studies on safe speeds to support the project development and design process.
| Type of Roadway Treatment | Description | Percent Speed Reduction |
|---|---|---|
| Vertical deflection countermeasures | Speed humps, raised pedestrian crossings, or raised intersections that raise roadways for various lengths to slow drivers. | Speed humps: 14-34% Raised crosswalks: 12-29% |
| Horizontal countermeasures | Median islands, chicanes or curves, or curb extensions that change the roadway. Chicanes are a series of curb extensions that alternate from one side of the street to the other, forming S-shaped curves that essentially narrow the roadway width and create an environment that slows down drivers. | Landscaped chicanes: 10-29% Curb extensions: 3-12% |
| Mini roundabouts and neighborhood traffic circles | Mini roundabouts have traversable islands and yield control on all approaches, so they function like other roundabouts. Neighborhood traffic circles are typically built at the intersections of local streets to provide traffic calming or aesthetic benefits. They operate as two-way or all-way stop-controlled intersections, typically without raised channelization to guide approaching traffic into the circulatory roadway. See the MassDOT Guidelines for the Planning and Design of Roundaboutsfor more information. | Neighborhood traffic circles: 10-29% |
| Road diets | Roadway configurations that involve narrowing or eliminating travel lanes to calm traffic speeds and increase safety of all roadway users. Road diets do not automatically impact throughput or cause congestion, and when it does enhanced safety is the preferred tradeoff. | 4-9% |
| Marking measures | Strategies such as optical measures and lane markings that can be used as visual cues to separate opposing traffic, signal a change in the roadway use, and help focus drivers’ attention on their speed. | 0-27% |
| Speed transition zones, advisory, and feedback signage | Strategies to slow drivers traveling from a rural to an urban environment and signs that communicate recommended speed information and feedback to drivers. | Dynamic speed feedback signs: 2-17% |
Note: The speed reduction percentages were sourced from FHWA's Engineering Speed Management Countermeasures Table linked above.
The Role of Speed Limits and Speed Zoning in Speed Management
In the project development and design process, speed zones and posted speed limits are primarily determined after construction of a project. One goal of speed zoning as part of the speed management process is to confirm that the target speed has been achieved and to set an enforceable speed limit once a project is completed. Ideally, design speed, target speed, speed limit, and operating speed are all the same. Once the construction is substantially completed, the road should be evaluated for a new permanent speed limit per MassDOT’s speed zoning standards.
If the target speed has not been met, additional measures may be needed, whether through a future project or in some instances, the application of quick-build treatments. For guidance on setting speed limits, see “About the Role of Speed Limits” and MassDOT’s Procedures on Speed Zoning on State Highways and Municipal Roads.
Bicycle Speed Considerations
Bicycle operating speedis a measured or estimated speed that is used to inform the characteristics and needs of different types of people, trips, and bicycles. Bicycle operating speeds can support design decision-making related to bicycle facilities and off-road shared-use paths. Emerging technology has created the need to consider both human-powered and electric-powered bicycles (e-bikes), which allow for varying operating speeds. Mean speeds for both human-powered and e-bikes are summarized below:
- Human-Powered Bicycles
- Younger children (13 years and younger): Approximately 9 mph
- Older children (14 years and older): Approximately 10 mph
- Adults on flat elevation profiles: Approximately 8-15 mph
- Adults on downgrades and faster cyclists: Approximately 25+ mph
- Electric Bicycles:
- Type 1 and Type 2 e-bikes: Assist up to 20 mph
- Type 3 e-bikes: Assist up to 28 mph
Bicycle operating speed is a consideration for the selection of separated facilities, especially when the speed differential between automobiles and people biking presents traffic stress for people biking and safety risks.
Bicycle design speed is a design criterion for determining horizontal curvature and sight distance for shared use paths. See Chapter 11 for guidance on bicycle design speeds for shared use paths. See Chapter 6 for additional details on traffic signals and the influence of bicycle speed on signal timing. See the MassDOT Separated Bike Lane Planning & Design Guide, Chapter 6, for guidance on bicycle signal operation.
Pedestrian Speed Considerations
People walk or travel with mobility devices at varying speeds. Pedestrian walking speedis a selected walking speed primarily used to inform pedestrian signal timing, including the time needed for a person to cross the roadway at a pedestrian signal or pedestrian hybrid beacon. The U.S. Access Board’s Accessibility Guidelines for Pedestrian Facilities in the Public Right-of-Way (PROWAG) requires that pedestrian clearance time (time required to cross the street) be calculated using a pedestrian walking speed of 3.5 feet per second or less. The MUTCD, Chapter 4E also provides guidance for using pedestrian of all ages and abilities, which may require assuming a slower walking speed in certain contexts, for example, near senior centers, hospitals, day cares, etc. See Chapter 6 for guidance on pedestrian walking speed.
Pedestrian walking speed is also a consideration for the design of shared use paths, where speed differentials between slower and faster path users may inform a potential need to separate path users onto multiple treadways. See Chapter 11 for guidance on multiple treadways.
3.7 Sight Distance
Sight distance is the length of roadway ahead that is visible to the roadway user. Specific sight distance measures apply to motor vehicles drivers and impact safety of all roadway users. The four following aspects are commonly discussed for motor vehicle sight distance:
- Stopping sight distance
- Passing sight distance
- Decision sight distance
- Intersection sight distance
All of these sight distances are directly related to the design speed of the roadway. The designer should refer to AASHTO’s Green Book for detailed information for the use and calculation of sight distances, and refer to the MassDOT Separated Bicycle Planning and Design Guide, Chapter 4, for guidance on providing adequate sight distance.
Stopping Sight Distance
The provision of adequate stopping sight distance (SSD) is a critical sight distance consideration for design and is described in more detail below.
Motor Vehicle Stopping Sight Distance
Stopping sight distance is the distance necessary for a vehicle traveling at the design speed to stop before reaching a stationary object in its path. The sight distance at every point along a roadway should be at least the stopping sight distance.
Table 3‑9 provides stopping sight distances for a range of design speeds and grades. Refer to Chapter 4 for guidance related to horizontal and vertical stopping sight distances.
| Design Speed (mph) | -9% | -6% | -3% | 0% | 3% | 6% | 9% |
|---|---|---|---|---|---|---|---|
| 15 | 85 | 82 | 80 | 80 | 75 | 74 | 73 |
| 20 | 126 | 120 | 116 | 115 | 109 | 107 | 104 |
| 25 | 173 | 165 | 158 | 155 | 147 | 143 | 140 |
| 30 | 227 | 215 | 205 | 200 | 200 | 184 | 179 |
| 35 | 287 | 271 | 257 | 250 | 237 | 229 | 222 |
| 40 | 354 | 333 | 315 | 305 | 289 | 278 | 269 |
| 45 | 427 | 400 | 378 | 360 | 344 | 331 | 320 |
| 50 | 507 | 474 | 466 | 425 | 405 | 388 | 375 |
| 55 | 593 | 553 | 520 | 495 | 469 | 450 | 433 |
| 60 | 686 | 638 | 598 | 570 | 538 | 515 | 495 |
| 65 | 785 | 728 | 682 | 645 | 612 | 584 | 561 |
| 70 | 891 | 825 | 771 | 730 | 690 | 658 | 631 |
| 75 | 1003 | 927 | 866 | 820 | 772 | 736 | 704 |
Source: A Policy on the Geometric Design of Streets and Highways, AASHTO, 2018, Chapter 3 Elements of Design
Sight Distance for Bicyclists
Bicycle stopping sight distance is an important consideration in the design of on and off-road facilities such as shared use paths. Refer to the MassDOT Separated Bicycle Planning and Design Guide for detailed information for reducing exposure risk between roadways users and calculations of sight distances. Detailed information on the design of these facilities, including stopping sight distance, is provided in Chapter 11. Refer to MassDOT’s Separated Bicycle Planning and Design Guide, Chapter 4, for guidance on providing adequate sight distance at intersections.
Sight Distance for Pedestrians
There is no “stopping sight distance” consideration for people walking since they usually travel at lower speeds than motor vehicles and bicycles and can stop within a few feet. However, the designer must consider the importance of pedestrians’ ability to view and react to potential conflicts, while considering people of all ages and abilities. The designer should provide adequate sight lines at street crossings, around corners, and at other locations where people walking interface with other users. For example, at street crossing locations, pedestrians should be able to see a sufficient portion of the traffic stream to judge the suitability of gaps for crossing the street. More detailed information regarding the design of street crossings is presented in Chapter 6.
Passing Sight Distance
For two-lane highways, passing maneuvers in which faster vehicles move ahead of slower vehicles must be accomplished on lanes regularly used by opposing traffic. If passing is to be accomplished safely, passing sight distance is necessary to allow the passing driver to see a sufficient distance ahead, clear of traffic, to complete the passing maneuver without cutting off the passed vehicle and before meeting an opposing vehicle that appears during the maneuver. The AASHTO Green Book includes detailed information for the use and calculation of passing sight distances.
Decision Sight Distance
Decision sight distance adds a dimension of time to stopping sight distance to allow a driver to detect and react to an unexpected condition along a roadway. Decision sight distance is considered when there is evidence that it would be prudent to provide longer sight distance, such as when complex decisions are needed or when information is difficult to perceive. It is the distance needed for a driver to detect an unexpected or otherwise difficult-to-perceive information source or condition in a roadway environment that may be visually cluttered, recognize the condition or its potential threat, select an appropriate speed and path, and initiate and complete the maneuver safely and efficiently. Table 3‑10 provides decision sight distances for a range of design speeds for the following avoidance maneuvers:
- Avoidance Maneuver A: Stop on road in a rural area – t = 3.0s
- Avoidance Maneuver B: Stop on road in an urban area – t = 9.1s
- Avoidance Maneuver C: Speed/path/direction change on rural road – t varies between 10.2 and 11.2 s
- Avoidance Maneuver D: Speed/path/direction change on suburban road or street – t varies between 12.1 and 12.9 s
- Avoidance Maneuver E: Speed/path/direction change on urban, urban core, or rural town road or street – t varies between 14.0 and 14.5 s
| Design Speed (mph) | A | B | C | D | E |
|---|---|---|---|---|---|
| 30 | 220 | 490 | 450 | 535 | 620 |
| 35 | 275 | 590 | 525 | 625 | 720 |
| 40 | 330 | 690 | 600 | 715 | 825 |
| 45 | 395 | 800 | 675 | 800 | 930 |
| 50 | 465 | 910 | 750 | 890 | 1130 |
| 55 | 535 | 1030 | 865 | 980 | 1135 |
| 60 | 610 | 1150 | 990 | 1125 | 1280 |
| 65 | 695 | 1275 | 1050 | 1220 | 1365 |
| 70 | 780 | 1410 | 1105 | 1275 | 1445 |
| 75 | 875 | 1545 | 1180 | 1365 | 1545 |
Source: A Policy on the Geometric Design of Streets and Highways, AASHTO, 2018, Chapter 3 Elements of Design
Intersection Sight Distance
Sight distance is provided at intersections to allow drivers to perceive the presence of potentially conflicting vehicles and other roadway users. This should occur in sufficient time for a motorist to stop or adjust their speed, as appropriate, to avoid colliding in the intersection. Sight distance also allows drivers of stopped vehicles with a sufficient view of the intersecting roadway to decide when to enter or cross the intersecting roadway. If the available sight distance for entering or crossing vehicles is at least equal to the appropriate stopping sight distance for the major road, then drivers have sufficient sight distance to anticipate or avoid collisions. However, in some cases, this may require a major-road vehicle to slow or stop to accommodate the maneuver by a minor-road vehicle.
To enhance traffic operations, intersection sight distances that exceed stopping sight distances are desirable. The Highway Capacity Manual provides guidance on gap acceptance for vehicles departing from minor approaches which can be used to calculate one measure of intersection sight distance. Additionally, the AASHTO Green Book provides procedures to determine desirable sight distances at intersections for various cases are described below and include:
- Case A – Intersections with no control on any approach
- Case B – Intersections with stop control on the minor street
- Case C – Intersections with yield control on the minor street
- Case D – Intersections with traffic signal control
- Case E – Intersections with all-way stop sign control
- Case F – Left turns from the major road
It is also necessary to provide adequate sight distances between people driving, biking, and walking as they approach intersections with streets, alleys, and driveways. Refer to MassDOT’s Separated Bicycle Planning and Design Guide, Chapter 4, for guidance on providing adequate sight distance for motorists and bicyclists to see each other and make decisions about yielding or proceeding at intersections.
Intersection Sight Triangle
Clear sight triangles are those areas along the intersection approach legs that should be clear of obstructions that can block a road user’s view of oncoming traffic. The dimensions of the triangle are based on the design speed of the intersecting roadways and the type of traffic control used at the intersection, grades on the roadways, and the roadway width. Two types of clear sight triangles are used at each intersection:
- Approach sight triangles are applicable for when the minor road driver is in motion
- Departure sight triangles are applicable when the minor road vehicle is accelerating from a stop position
Identification of Sight Obstructions within Sight Triangles
Within a sight triangle there are many obstructions that can obscure the driver’s view of oncoming vehicles. These may include buildings, vegetation, longitudinal barriers or retaining walls, side slopes, etc. The horizontal and vertical alignment of the intersecting roadways and any visual obstructions should be considered. For design purposes, the driver’s eye is assumed to be 3.5 feet above the roadway. The object that is used for design approximates the height of an automobile and is assumed to be 3.5 feet above the roadway.
Where the sight distance value used in design is based on a single-unit or combination truck as the design vehicle, it is also appropriate to use the eye height of a truck driver in checking sight obstructions. The recommended value of a truck driver’s eye height is 7.6 feet above the roadway surface.
Case A – Intersections with No Control on Any Approach
Where intersection movements are not controlled by a traffic control device (i.e., signal, STOP or YIELD sign), drivers approaching the intersection from any direction must be able to see potentially conflicting vehicles in sufficient time to stop before reaching the intersection.
The intersection sight triangle, as illustrated in Figure 3‑10, is formed by the sight distance along the minor street (indicated as Dimension a1 for viewing traffic approaching from the left and Dimension a2 for viewing traffic approaching from the right) and the intersection sight distance along the major street (indicated as Dimension b). The corresponding distances in Table 3‑11, arrayed by design speed, are based on the distance traveled as the approaching driver perceives and reacts to the presence of a possibly conflicting vehicle, and brings their own vehicle to a stop. For example, based on the values in Table 3‑11, an intersection of a major street with a design speed of 40 miles per hour with a minor street with a design speed of 25 miles per hour would require a sight distance defined by an intersection sight distance of 195 feet (Dimension b in Figure 3-10) and 115 feet (Dimension a1 in Figure 3-10). For sight distance viewing traffic from the right, Dimension a2 is the sum of Dimension a1 and the distance to the middle of the lane of interest. This distance includes the width of any median island unless the median is wide enough for drivers to stop and look for oncoming traffic before proceeding beyond the median island. If either street is sloped greater than 3% uphill or downhill, apply the adjustment factors in Table 3‑12 to the intersection sight distance. For example, if the minor street was on a 6 percent grade, then the intersection sight distance would be 127 feet (115 feet multiplied by the 1.1 grade adjustment factor) for the downgrade and 104 feet for the upgrade.
Figure 3-10: Sight Triangle Case A - Approach Sight Triangles
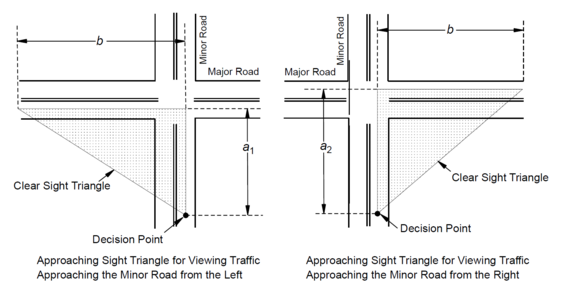
Source: A Policy on the Geometric Design of Streets and Highways, AASHTO, 2018, Chapter 9 Intersections, Figure 9-16
| Design Speed (mph) | Length of Legs, both major and minor streets, a1 and b (feet) |
|---|---|
| 15 | 70 |
| 20 | 90 |
| 25 | 115 |
| 30 | 140 |
| 40 | 195 |
| 45 | 220 |
| 50 | 245 |
| 55 | 285 |
| 60 | 325 |
| 65 | 365 |
| 70 | 405 |
| 75 | 445 |
Source: A Policy on the Geometric Design of Highways and Streets, AASHTO, 2018, Chapter 9 Intersections
| Design Speed (mph) | -6% | -5% | -4% | -3% to +3% | 4% | 5% | 6% |
|---|---|---|---|---|---|---|---|
| 15-20 | 1.1 | 1.0 | 1.0 | 1.0 | 1.0 | 1.0 | 1.0 |
| 20 | 1.1 | 1.0 | 1.0 | 1.0 | 1.0 | 1.0 | 1.0 |
| 25 | 1.1 | 1.1 | 1.0 | 1.0 | 1.0 | 1.0 | 0.9 |
| 30 | 1.1 | 1.1 | 1.1 | 1.0 | 1.0 | 0.9 | 0.9 |
| 35 | 1.1 | 1.1 | 1.1 | 1.0 | 0.9 | 0.9 | 0.9 |
| 40 | 1.1 | 1.1 | 1.1 | 1.0 | 0.9 | 0.9 | 0.9 |
| 45 | 1.1 | 1.1 | 1.1 | 1.0 | 0.9 | 0.9 | 0.9 |
| 50 | 1.2 | 1.1 | 1.1 | 1.0 | 0.9 | 0.9 | 0.9 |
| 55 | 1.2 | 1.1 | 1.1 | 1.0 | 0.9 | 0.9 | 0.9 |
| 60 | 1.2 | 1.1 | 1.1 | 1.0 | 0.9 | 0.9 | 0.9 |
| 65 | 1.2 | 1.2 | 1.1 | 1.0 | 0.9 | 0.9 | 0.9 |
| 70 | 1.2 | 1.2 | 1.1 | 1.0 | 0.9 | 0.9 | 0.9 |
| 75 | 1.2 | 1.2 | 1.1 | 1.0 | 0.9 | 0.9 | 0.9 |
Source: A Policy on the Geometric Design of Highways and Streets, AASHTO, 2018, Chapter 9 Intersections
Case B – Stop Control on Minor Street
At an intersection with stop control on the minor street, as illustrated in Figure 3‑11, the stopped minor-street driver must be able to see motor vehicles and bicycles approaching on the major street from either direction, at sufficient distance to allow crossing or turning maneuvers from the minor street. The leg of the intersection sight triangle on the minor street (Dimension a1 for viewing traffic approaching from the left and Dimension a2 for viewing traffic approaching from the right) is the distance from the driver’s eye (decision point) to the middle of the lane of interest. This distance includes the width of any median island unless the median is wide enough for drivers to stop and look for oncoming traffic before proceeding beyond the median island. Dimension a1 and a2 are dependent on, and may vary with, the placement of a marked stop line and presence of a marked crosswalk for the approach. The major street leg of the triangle is the intersection sight distance along the major road (Dimension b).
Left Turns from Stop Controlled Minor Street
For motor vehicles making a left turn, the intersection sight distance along the major street (Dimension b) is given for an intersection of 2 lane streets in Table 3‑13. For example, at a design speed of 35 miles per hour on the major street, the intersection sight distance (Dimension b) is 390 feet. It is recommended that this intersection sight distance (Dimension b) be applied along the major street in both directions from the intersection.
Right Turns from Stop Controlled Minor Street
For motor vehicles making a right turn from the minor street, the intersection sight distances are given in Table 3‑13.
Through Movement from Stop Controlled Minor Street
For motor vehicles crossing the major street from a stop-controlled minor street, the intersection sight distances are given in Table 3‑13.
Figure 3-11: Sight Triangle Legs: Case B - Stop Control on Cross Street
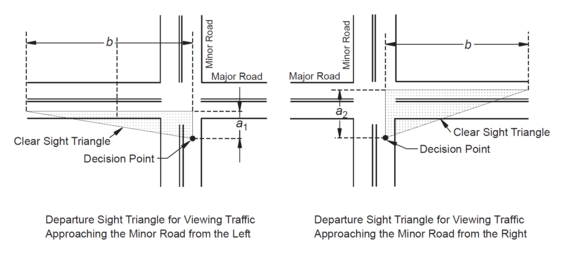
Source: A Policy on the Geometric Design of Highways and Streets, AASHTO, 2018, Chapter 9 Intersections, Figure 9-17
| Major Street Design Speed (mph) | Major Street for Left Turns (b, feet) | Major Street for Right Turns or Through (b, feet) |
|---|---|---|
| 15 | 170 | 145 |
| 20 | 225 | 195 |
| 25 | 280 | 240 |
| 30 | 335 | 290 |
| 35 | 390 | 335 |
| 40 | 445 | 385 |
| 45 | 500 | 430 |
| 50 | 555 | 480 |
| 55 | 610 | 530 |
| 60 | 665 | 575 |
| 65 | 720 | 625 |
| 70 | 775 | 670 |
| 75 | 830 | 720 |
Note: Sight triangle legs shown are for passenger car crossing or turning into a two-lane street, with grades (all approaches) 3 percent or less. For other grades and for other major street widths, recalculate using AASHTO Green Book formulas.
Source: A Policy on the Geometric Design of Highways and Streets, AASHTO, 2018, Chapter 9 Intersections
Case C – Yield Control
At intersections with yield control on the minor street, the minor street driver is permitted to enter or cross the major road without stopping, if there are no potentially conflicting vehicles. Yield-controlled approaches generally need greater sight distance than stop-controlled approaches. For four-leg intersections with yield control on the minor road, two separate pairs of approach sight triangles should be provided – one set to accommodate crossing the major road and the other to accommodate left and right turns, as previously shown in Figure 3-10. Both sets of sight triangles should be checked for potential sight obstructions. For three-leg intersections with yield control on the minor road, only the departure sight triangles to accommodate left and right turns need to be checked, as previously shown in Figure 3-11.
| Major Street Design Speed (mph) | Crossing Without Stopping - Minor Street (a1, feet) | Crossing Without Stopping1, 2 - Major Street (b, feet) | Left and Right Turn Without Stopping1 - Minor Street (a2, feet) | Left Turn and Right Turn Without Stopping1 - Major Street (b, feet) |
|---|---|---|---|---|
| 15 | 75 | 145 | 82 | 180 |
| 20 | 100 | 195 | 82 | 240 |
| 25 | 130 | 240 | 82 | 275 |
| 30 | 160 | 290 | 82 | 355 |
| 35 | 195 | 335 | 82 | 415 |
| 40 | 235 | 385 | 82 | 475 |
| 45 | 275 | 430 | 82 | 530 |
| 50 | 320 | 480 | 82 | 590 |
| 55 | 370 | 530 | 82 | 650 |
| 60 | 420 | 575 | 82 | 710 |
| 65 | 470 | 625 | 82 | 765 |
| 70 | 530 | 670 | 82 | 825 |
| 75 | 590 | 720 | 82 | 885 |
Notes:
1Sight triangle legs shown are for passenger car crossing or turning into a two-lane street, with grades (all approaches) 3 percent or less. For other grades and for other major street widths, recalculate using AASHTO Green Book formulas.
2Lengths are for design speeds of 20 to 50 mph on minor road. For other minor road design speeds, recalculate length of legs using AASHTO Green Book formulas.
Source: A Policy on the Geometric Design of Highways and Streets, AASHTO, 2018, Chapter 9 Intersections
Case C – Yield Control at Roundabouts
At roundabouts, intersection sight distance is calculated in part from the design speed of circulating or entering vehicles. The entry sight distance evaluation uses two conflicting approaches: entering stream (i.e., those vehicles entering from the immediate upstream entry) and circulating stream (i.e., those vehicles on the circular roadway). The length of the conflicting leg is shown in Table 3‑15 for a range of conflicting approach speeds. NCHRP Research Report 1043: Guide for Roundabouts provides guidance on how to estimate the conflicting approach speed for the entering and circulating streams. See page 54 of MassDOT’s Guidelines for the Planning and Design of Roundabouts for an illustration of intersection sight distance triangles.
| Conflicting Approach Speed (mph) | Computed Distance (feet) |
|---|---|
| 10 | 73 |
| 15 | 110 |
| 20 | 147 |
| 25 | 184 |
| 30 | 220 |
Source: NCHRP Research Report 1043: Guide for Roundabouts (2023)
Case D – Intersections with Traffic Signal Control
At signalized intersections, the first vehicle stopped on one approach should be visible to the driver of the first vehicle stopped on each of the other approaches. Where right turns on red are permitted, the sight distance triangle for a right turn from stop applies (Case B). Left turning motor vehicles and bicycles should have sufficient sight distance of the opposing roadway to be able to select gaps sufficient to safely make their left-turn movement (Case B). Where this sight distance is insufficient, most likely due to vertical or horizontal curvature of the roadway, remedies can include confining the left turn to a protected signal phase or prohibiting the left turn.
Case E – Intersections with All-Way Stop Control
At intersections with all-way stop control, the first stopped vehicle on one approach should be visible to the drivers of the first stopped vehicles on each of the other approaches. For this reason, all-way stop control may be a preferable option at intersections where, due to topographic or man-made constraints, sufficient sight distances for other types of control cannot be obtained.
Case F – Left Turns from the Major Road
Drivers turning left across oncoming traffic of a major roadway require sufficient sight distance to determine when there is time to complete the maneuver. If stopping sight distance has been provided continuously along the major road and if sight distance for Case B (stop control) or Case C (yield control) has been provided for each minor-road approach, sight distance will generally be adequate for left turns from the major roads. Therefore, no separate check of sight distance for Case F may be needed. However, at three-leg intersections or driveways located on or near a horizontal curve or crest vertical curve on the major road, the availability of sufficient sight distance for left turns from the major road should be checked. In addition, the availability of sufficient sight distance from divided highways should be checked because of the possibility of sight obstructions in the median. Intersection sight distances for Case F are listed in Table 3‑16.
| Design Speed (mph) | Intersection Sight Distance (feet) |
|---|---|
| 15 | 125 |
| 20 | 165 |
| 25 | 205 |
| 30 | 245 |
| 35 | 285 |
| 40 | 325 |
| 45 | 365 |
| 50 | 405 |
| 55 | 445 |
| 60 | 490 |
| 65 | 530 |
| 70 | 570 |
| 75 | 610 |
Note: Intersection sight distance shown is for a passenger car making a left turn from an undivided roadway. For other conditions and design vehicles, the time gap should be adjusted and the sight distance recalculated.
Source: A Policy on the Geometric Design of Highways and Streets, AASHTO, 2018, Chapter 9 Intersections
3.8 Controlling Criteria
MassDOT’s Controlling Criteria are described in Engineering Directive E-20-001. This directive includes design criteria for pedestrian, bicycle, transit, and vehicle facilities and provides direction regarding the FHWA controlling criteria and the use of the Design Justification Workbook to document design decisions.
The Controlling Criteria provide minimum requirements to meet the basic design controls outlined in this chapter. MassDOT recognizes 14 controlling criteria – 10 are federal and 4 are state. These criteria are:
- Pedestrian Facilities
- Bicycle Facilities
- Transit Provisions
- Ramp Length (for Roadways)
- Design Speed
- Design Loading Structural Capacity
- Lane Width
- Shoulder Width
- Horizontal Curve Radius
- Superelevation Rate
- Stopping Sight Distance
- Maximum Grade
- Cross Slope
- Vertical Clearance
Refer to Engineering Directive E-20-001 for the applicability of the controlling criteria and guidance specific to pedestrian facilities, bicycle facilities, transit provisions, and ramp length for roadways.
Every reasonable effort should be made to design projects within the ranges of standards provided in design guidance documents listed in Section 3.9 and in all sections of the PDDG. Any necessary design exceptions to the controlling design criteria must be documented and approved in accordance with the Design Justification Workbook procedures described in E-20-001. MassDOT is committed to providing facilities that are accessible to all people, and in accordance with all state and federal regulations.
3.9 For Further Information
- AASHTO Green Book. A Policy on Geometric Design of Highways and Streets, AASHTO, 2018
- AASHTO Guide for the Development of Bicycle Facilities, 2012
- AASHTO Guide for the Planning, Design, and Operation of Pedestrian Facilities, 2004
- AASHTO Guide on Geometric Design of Transit Facilities on Highways and Streets, 2014
- AASHTO A Guide on Achieving Flexibility in Highway Design, 2004
- AASHTO A Policy on Design Standards - Interstate System, 2016
- FHWA Achieving Multimodal Networks, 2016
- FHWA Engineering Speed Management Countermeasures: A Desktop Reference of Potential Effectiveness in Reducing Speed, 2014
- FHWA Flexibility in Highway Design, 1997
- FHWA Manual on Uniform Traffic Control Devices (MUTCD), 2023
- FHWA Small Town and Rural Multimodal Networks, 2016
- FHWA Traffic Calming ePrimer, 2017
- Global Designing Cities Initiative Designing Streets for Kids, 2020
- MassDOT Separated Bike Lane Planning & Design Guide, 2015
- MassDOT Guidelines for the Planning and Design of Roundabouts, 2022
- NACTO City Limits: Setting Safe Speed Limits on Urban Streets, 2020
- NACTO Designing for Small Things With Wheels, 2023
- NACTO Don’t Give up at the Intersection, 2019
- NACTO Transit Street Design Guide, 2016
- NACTO Urban Bikeway Design Guide, Second Edition, 2014
- NACTO Urban Street Design Guide, 2013
- NCHRP Research Report 480: A Guide to Best Practices for Achieving Context-Sensitive Solutions, 2002
- NCHRP Research Report 834: Crossing Solutions at Roundabouts and Channelized Turn Lanes for Pedestrians with Vision Disabilities: A Guidebook, 2017
- NCHRP Research Report 1043: Guide for Roundabouts, 2023
- Thompson, D. C., Rebolledo, V., Thompson, R. S., Kaufman, A., & Rivara, F. P. (1997). Bike speed measurements in a recreational population: validity of self reported speed. Injury Prevention : Journal of the International Society for Child and Adolescent Injury Prevention, 3(1), 43–45.
- Transportation Research Board. Highway Capacity Manual 6th Edition, 2016
- U.S. Access Board Public Right-of-Way Accessibility Guidelines (PROWAG), 2023