
Of the 351 municipalities in Massachusetts, 26 are not subject to the quota formula for on-premises licenses.101 These 26 municipalities obtained control under legislation that authorized a limited group of municipalities to issue on-premises licenses irrespective of the quota.102 The window closed in 1985 with no subsequent opportunity for municipalities to obtain comparable quota flexibility.103
The result is a two-tiered licensing system:
- Local-control municipalities: 26 municipalities that set their own on-premises license counts without reference to the quota formula, subject to local approval, ABCC review, and operating, enforcement, suspension, and revocation rules that apply to all on-premises licensees
- Quota municipalities: 302 municipalities that continue to be allocated on-premises licenses under the quota formula and may exceed that allocation only by securing special legislation from the Legislature, discussed in detail in Finding 4.
The two-tier system is the result of a historical eligibility rule. Only municipalities that had granted seasonal on-premises licenses before January 1, 1978, were eligible to become local-control municipalities. That rule favored places with established seasonal increases in population, so local-control municipalities are disproportionately Cape Cod, coastal, and Berkshire resort communities (see Figure 17 below). Notably, only 3 of the 26 Gateway Cities (Barnstable, Haverhill, and Worcester) are local-control municipalities.104 This is particularly concerning where barriers to liquor license access may exacerbate the challenges already faced by Gateway Cities—municipalities that have been designated by the Commonwealth for targeted economic development.
Figure 17. Two-Tier Licensing System
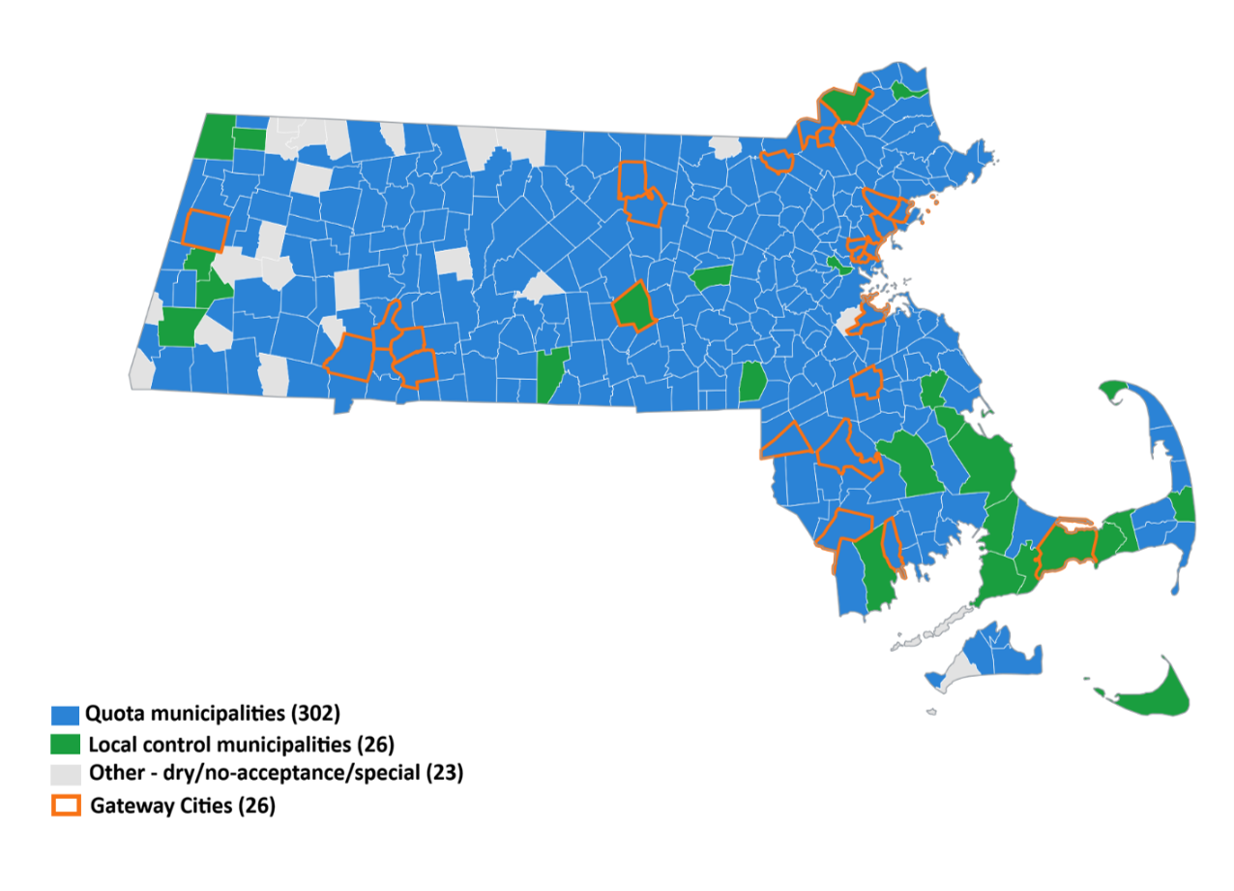
This Finding compares the two tiers of the Massachusetts liquor licensing system in two ways. First, it compares the number of on-premises licenses local-control and quota municipalities issue per 10,000 residents. Second, it applies the quota formula to the 26 local-control municipalities to calculate how many licenses those municipalities would be allocated if the state-imposed population-based quota applied to them today.
Local-control municipalities issue approximately twice as many on-premises licenses per resident as quota municipalities, and they issue substantially more than the quota formula would have allocated to them.
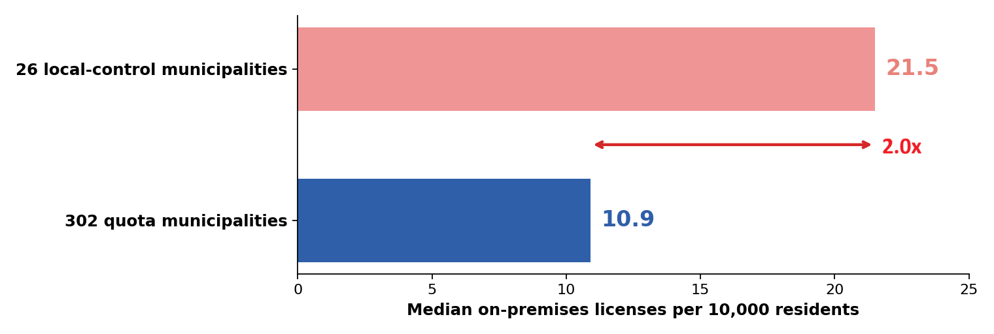
This study’s analysis shows that local-control municipalities issue substantially more on-premises licenses than quota municipalities. The 26 local-control municipalities issue 21.5 on-premises licenses per 10,000 residents, compared with 10.9 in the quota municipalities—twice as many licenses per resident (see Figure 18 below).105
Figure 18. License Issuance, Local-Control vs. Quota Municipalities106
The gap in license issuance between quota municipalities and local-control municipalities is powered by local-control municipalities as a group and not driven by a small number of high-issuing local-control outliers.107
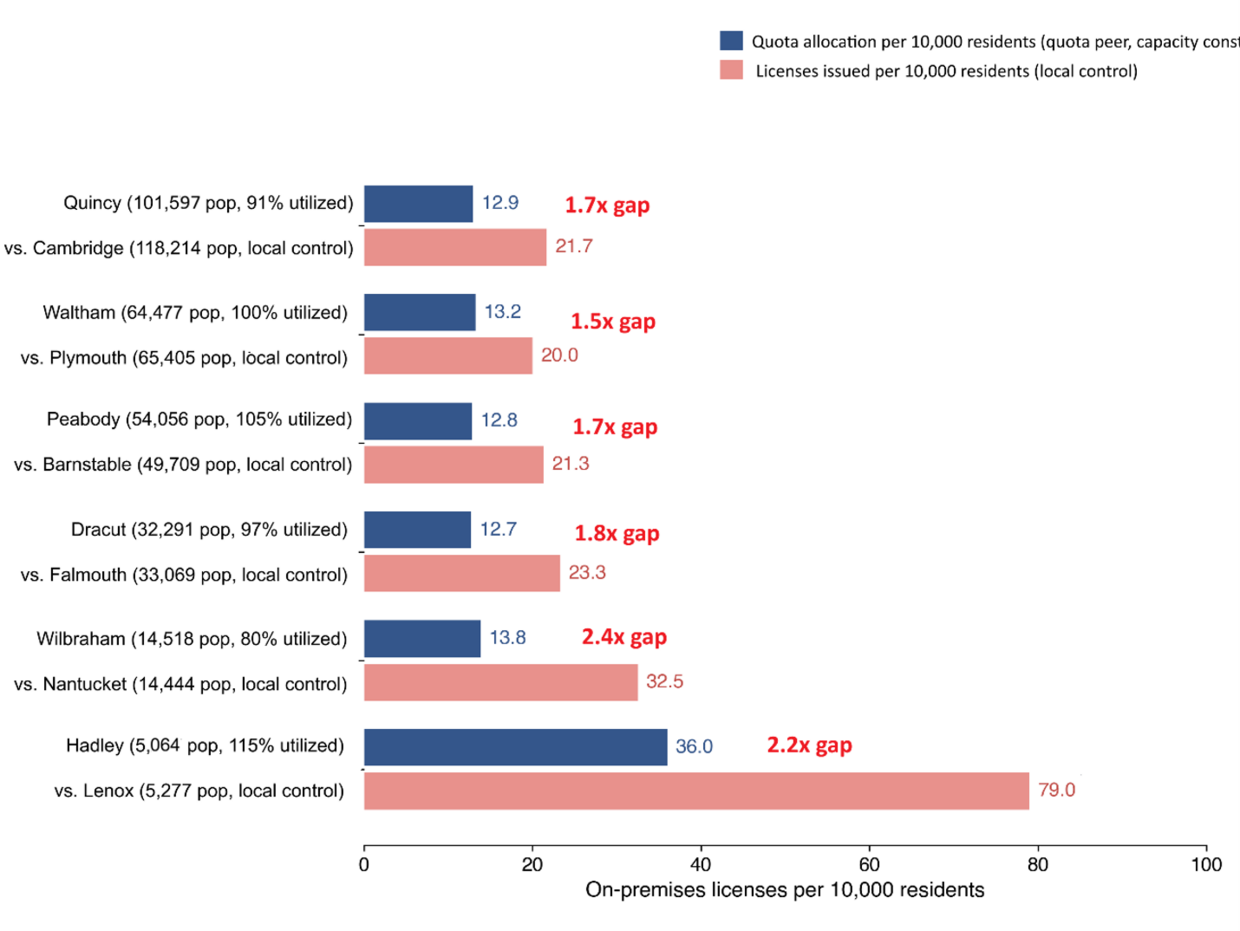
To illustrate differential outcomes between the two tiers, this study compared quota municipalities at or above 80% license utilization with local-control municipalities of comparable population across various population levels.108 Figure 19 on the next page compares the quota municipality’s allocated licenses under the formula with its local-control peer’s issued licenses. Allocated licenses provide the appropriate benchmark for quota municipalities because they represent the maximum number of licenses quota municipalities may issue without special legislation and approximate the limits local-control municipalities would face if subject to the quota formula. Figure 19 illustrates that local-control municipalities issue 1.5 to 2.4 times as many on-premises licenses per resident as the quota allocates, further evidencing that demand outpaces allocation under the formula.109
Figure 19. Matched-Pair Comparison of Local-Control and Constrained Quota Municipalities110
Applying the quota formula to local-control municipalities shows the practical value of local-control authority.
Having established the gap in license access by comparing matched-pair local-control and constrained quota municipalities, the analysis now considers how local-control municipalities would have been limited by the quota formula. If the quota formula applied, the 26 local-control municipalities would have been allocated a combined total of 1,205 on-premises licenses (hypothetical quota allocation).111 Under local control, those 26 municipalities actually issue 1,562 on-premises licenses, 357 (30%) more licenses than the quota formula would have allocated.112
Twenty-one of the 26 local-control municipalities issue more on-premises licenses than the quota formula would have allocated. In Figure 20 on the next page, each row compares the hypothetical quota allocation with licenses currently issued by each local-control municipality. The figure illustrates the benefit of local control versus the limitations of the quota formula, both by raw numbers and percentages. By raw numbers, Cambridge (+104 licenses above the hypothetical quota allocation), Plymouth (+46), Barnstable (+43), and Falmouth (+35) have benefited the most from local control.113 By percentages, the gap between hypothetical quota allocation and currently issued licenses is widest in smaller resort communities like Nantucket (+135%), Great Barrington (+121%), Lenox (+111%), and Provincetown (+89%), which have benefited substantially from their local control status.
Figure 20. Hypothetical Quota Allocation vs. Currently Issued Licenses for Local-Control Municipalities
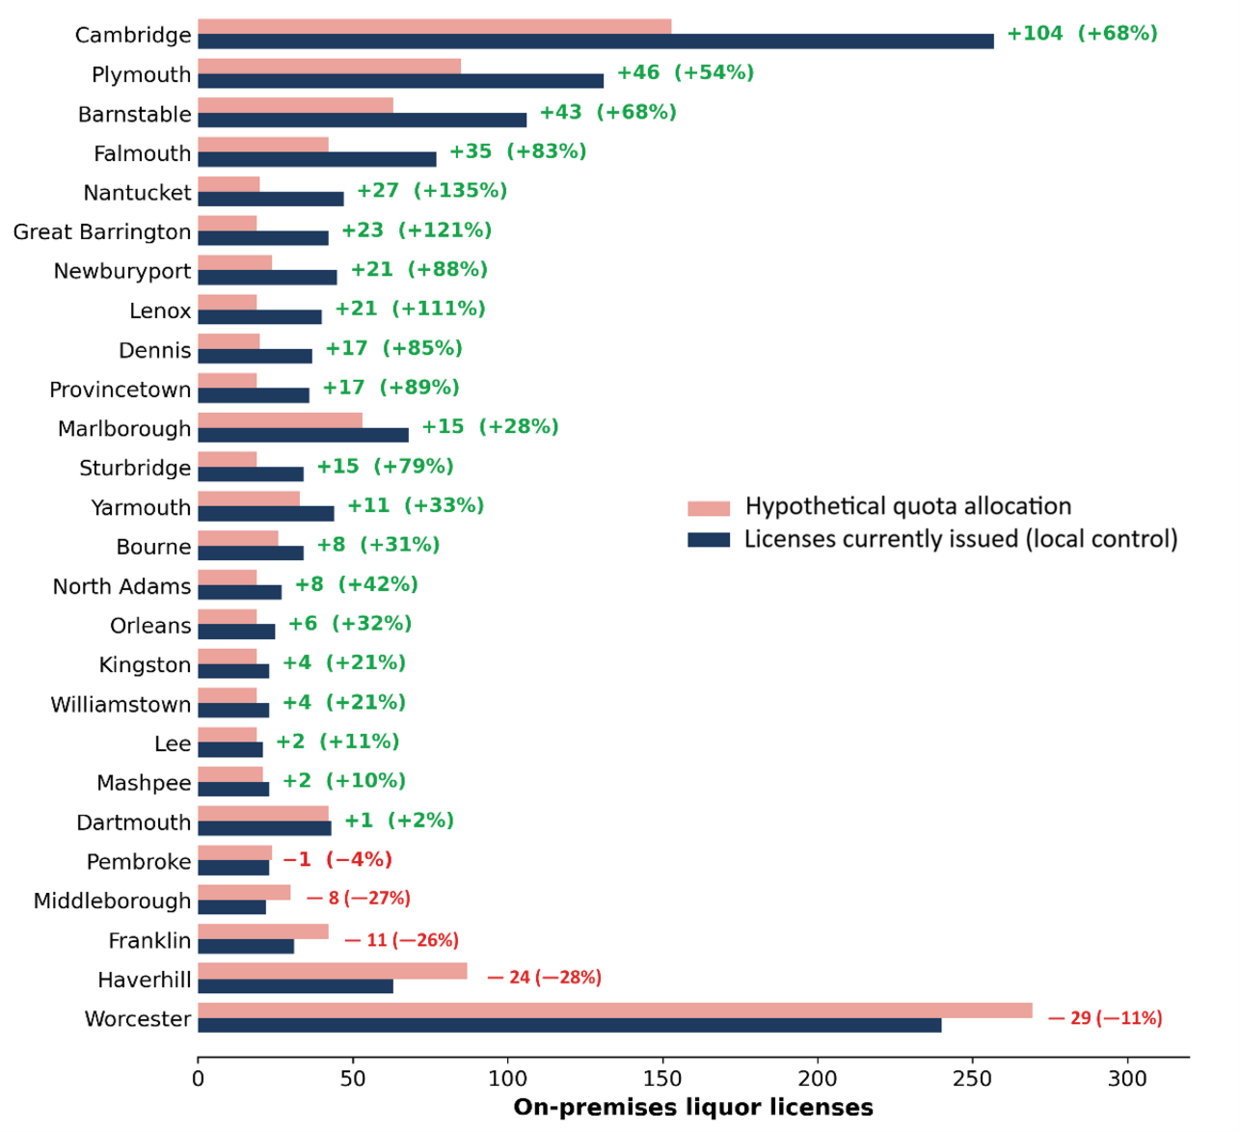
The analysis also demonstrates that local-control municipalities exercise discretion and that local control does not automatically lead to license issuance beyond what the quota formula would have allocated. In fact, five local-control municipalities—Franklin, Haverhill, Middleborough, Pembroke, and Worcester—issue fewer on-premises licenses than the quota formula would allow.
The hypothetical quota allocation analysis shows the benefit of local control in responding to local conditions. Officials and business operators in local-control municipalities describe this authority as a practical economic-development asset, allowing a community to calibrate license supply to downtown recovery, tourism, transit-oriented development, and seasonal demand rather than to a fixed resident count. A Cambridge restaurant owner stated that “the field feels leveled in Cambridge,” referring to the equal opportunity for obtaining a license in local-control Cambridge versus trying to obtain a license in a constrained quota municipality.114 A Haverhill municipal employee wrote that “local governments have a clearer understanding of their community’s needs than the state legislature and are better equipped to determine what works best and fits their community’s needs,” and a Nantucket official noted that “a little more flexibility to allow more or less on-premise licenses by the municipality would be very useful.”115
Local-control municipalities that have issued licenses in excess of what the quota would have allocated were able to do so without needing special legislation. In contrast, quota municipalities—particularly constrained quota municipalities—are subject to the lengthy, complicated, and uncertain home rule petition process. In the absence of special legislation via the home rule petition process, prospective licensees may be forced to rely on an expensive secondary market or reconsider location, negatively impacting economic growth in quota municipalities. Finding 4 discusses these barriers in further detail.
In summary, the 1978–1984 exemption window created an inequitable two-tier system: local-control municipalities that manage their own on-premises license supply and quota municipalities that must request permission from the Legislature for additional on-premises licenses. Municipalities that were able to take advantage of the temporary exemption window have experienced more than four decades of local flexibility, unlike quota municipalities that cannot freely respond to changing demand driven by factors such as tourism, commercial activity, downtown redevelopment, and strategic planning.
| Date published: | October 13, 2026 |
|---|