
This Finding examines whether on-premises license access varies by municipal wealth across Massachusetts. The quota formula allocates licenses by resident population alone and does not account for differences in municipal tax base, commercial activity, or local economic conditions. The analysis in this Finding tests whether municipal wealth-associated patterns nevertheless emerge in license access—first among the 302 quota municipalities117 and 26 local-control municipalities118 combined (the outcome-based sample), then isolating the 302 quota municipalities, and finally isolating the 26 local-control municipalities.119
To evaluate whether on-premises license access varies by municipal wealth, this study compares Massachusetts municipalities along a statewide scale of equalized valuation (EQV) per capita, commonly used as a standard measure of municipal wealth.120
The 328 municipalities in the outcome-based sample are sorted by EQV per capita and divided into four equal groups (n = 82 per wealth quartile).121 Table 2 defines the EQV per capita range for each wealth quartile. The same EQV per capita ranges are used in each of the three analyses, meaning the number of municipalities within wealth quartiles for Analysis B and for Analysis C are unequal.
Table 2. Statewide wealth quartiles122
| Wealth quartile | EQV per Capita Range | Number of Municipalities |
|---|---|---|
| Q1 (Lowest) | $76,427–$177,434 | 82 |
| Q2 | $177,435–$231,944 | 82 |
| Q3 | $231, 945–$328, 158 | 82 |
| Q4 (Highest) | $328, 159–$2,837,676 | 82 |
The following three analyses demonstrate that license access rises with municipal wealth and that the extent of license access disparity between the lowest and highest wealth municipalities is exacerbated by the two-tier licensing system.
Analysis A. On-premises license access across the outcome-based sample (n = 328)
Across the 328 quota and local-control municipalities, license access rises with municipal wealth—the wealthiest quartile issues substantially more on-premises licenses per resident than the least wealthy quartile. See Table 3 below.
Table 3. Analysis A—On-premises License Access by Wealth Quartile, Outcome-Based Sample (n = 328)
| Wealth Quartile | EQV per Capita Range | Number of Municipalities (Quota + Local-Control) | Licenses Issued per 10,000 Residents123 |
|---|---|---|---|
| Q1 (Lowest) | $76,427–$177,434 | 82 | 12.2 |
| Q2 | $177,435–$231,944 | 82 | 12.4 |
| Q3 | $231, 945–$328,158 | 82 | 13.6 |
| Q4 (Highest) | $328, 159–$2,837,676 | 82 | 19.3 |
The 82 municipalities in the lowest wealth quartile (Q1) issue an average of 12.2 on‑premises licenses per 10,000 residents; the 82 municipalities in the highest wealth quartile (Q4) issue an average of 19.3: 58% more than Q1.
The difference across wealth quartiles is statistically significant, meaning the pattern is strong enough that it is unlikely to be explained by chance alone.124 This does not mean municipal wealth by itself causes higher license access, but it does show a meaningful correlation between wealth and license access.125
Analysis B. On-premises license access across quota municipalities (n=302)
Narrowing the analysis to the 302 quota municipalities shows that the wealth-access gap persists within the quota framework. Although all 302 municipalities are subject to the same quota formula, the highest wealth quartile (Q4) issues 37% more licenses per resident than the lowest wealth quartile (Q1) (see Table 4). This difference is statistically significant, meaning a gap this large would rarely appear by chance if wealth and license access were unrelated; therefore, the pattern is a real feature of the data rather than an artifact of which municipalities happen to fall in each wealth quartile. It does not establish that wealth causes the difference.126
Table 4. Analysis B—On-premises License Access by Wealth Quartile, 302 Quota Municipalities
| Wealth Quartile | EQV per Capita Range | Number of Municipalities (Quota) | Licenses Issued per 10,000 Residents127 |
|---|---|---|---|
| Q1 (Lowest) | $76,427–$177,434 | 79 | 12.2 |
| Q2 | $177,435–$231,944 | 78 | 11.9 |
| Q3 | $231, 945–$328,158 | 75 | 12.7 |
| Q4 (Highest) | $328, 159–$2,837,676 | 70 | 16.7 |
The highest wealth quartile (Q4) quota municipalities issue 37% more licenses than the lowest wealth quartile (Q1) quota municipalities (compared to the outcome-based sample disparity of 58% in Analysis A).
Analysis C. On-premises license access across local-control municipalities (n = 26)
The 26 local-control municipalities obtained local control status during the 1978–1984 statutory window described in Finding 2. Eligibility for the window turned on a municipality’s prior issuance of seasonal on-premises licenses and a local vote; it did not turn on municipal wealth. This analysis examines where the 26 local-control municipalities are distributed among the wealth quartiles.
Of the 26 local-control municipalities, 3 (12%) sit in the lowest wealth quartile (Q1), 4 (15%) in Q2, 7 (27%) in Q3, and 12 (46%) in the highest wealth quartile (Q4). See Table 5 below. Nineteen of the 26—approximately three-quarters—sit in the top half of the wealth distribution. If the 26 local-control municipalities were distributed evenly across the four wealth quartiles, each wealth quartile would contain 6 or 7 local‑control municipalities (26 ÷ 4 = 6.5). The observed distribution is significantly skewed toward higher wealth quartiles.128
Table 5. Analysis C—Distribution of Local-Control Municipalities Across Wealth Quartiles (n = 26)
| Wealth Quartile | EQV per Capita Range | Number of Municipalities (Local-Control) | Licenses Issued per 10,000 Residents129 |
|---|---|---|---|
| Q1 (Lowest) | $76,427–$177,434 | 3 | 14.2 |
| Q2 | $177,435–$231,944 | 4 | 22.7 |
| Q3 | $231, 945–$328,158 | 7 | 23.8 |
| Q4 (Highest) | $328, 159–$2,837,676 | 12 | 34.3 |
| Total | 26 |
Within the local-control group, license access again rises with municipal wealth. The three local-control municipalities in Q1 issue an average of 14.2 on-premises licenses per 10,000 residents; the twelve in Q4 issue an average of 34.3. In each wealth quartile, the average local-control municipality issues more on-premises licenses per resident than the average quota municipality. Figure 21 below compares the data in Table 4 and Table 5 to illustrate the difference in issued licenses between local-control and quota municipalities by wealth quartile.
Figure 21. Local-Control vs. Quota Municipalities by Wealth Quartile130
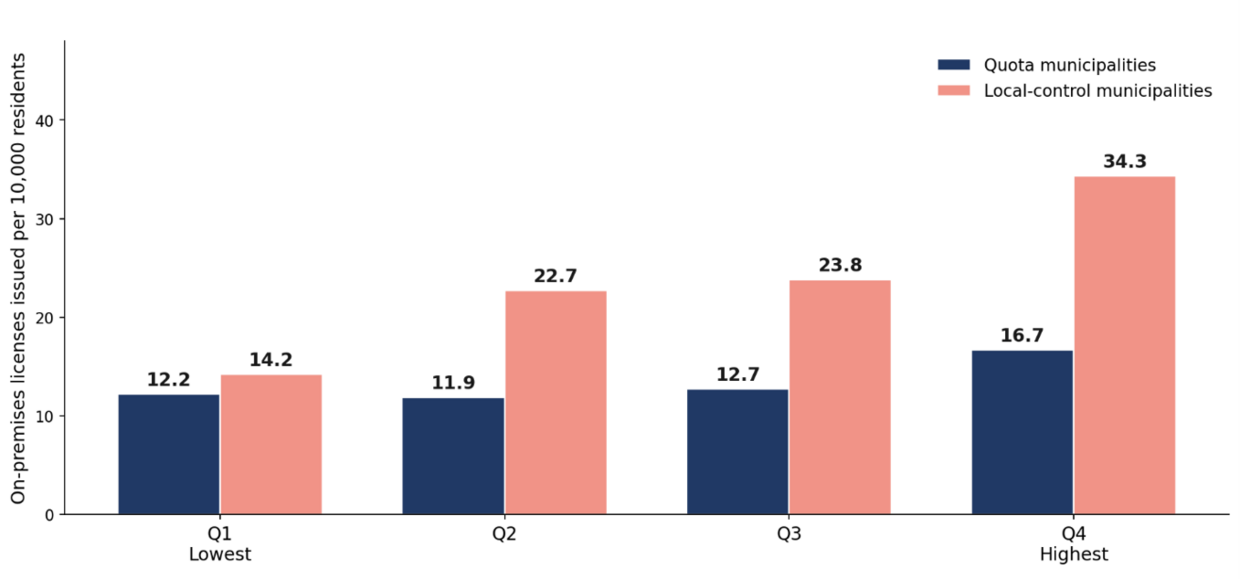
As the three analyses demonstrate, license access rises with municipal wealth. Further, as shown in Analysis C, local-control municipalities both (1) issue more on-premises licenses per 10,000 residents than quota municipalities at every wealth quartile and (2) sit disproportionately in higher wealth quartiles. Including them in the analysis therefore widens the wealth-access gap—the 58% disparity in Analysis A is the combined effect of license access rising with wealth among quota municipalities (Analysis B) and the concentration of local-control municipalities in higher wealth quartiles (Analysis C).
| Date published: | October 13, 2026 |
|---|