
When a quota municipality needs more on-premises licenses than the state formula allocates, its only pathway is a home rule petition to the Massachusetts Legislature.133 Municipal officials or business owners must work with state legislators to draft petition language, navigate committee hearings, and secure floor votes in both chambers. Special legislation licenses are typically tied to specific premises and often carry conditions or restrictions. Success depends on factors beyond market demand: familiarity with opaque and lengthy legislative procedure, relationships with and between municipal and state officials, and administrative capacity. Moreover, access to licenses via special legislation rises with municipal wealth, raising additional equity concerns.
The home rule petition process is opaque and slow, with no statutory deadline.
The process has a municipal and state legislative component. A municipality or business owner must work with state legislators to draft petition language, secure local authorization, navigate committee hearings, and obtain floor votes in both chambers of the Legislature before the Governor signs the resulting special act. An Amherst municipal employee described the burden on municipalities in pursuing home rule petitions as “a ton of work and effort from many different parties.”134
While the home rule process is outlined in this Finding, no public legislative guidance could be found that would allow a potential licensee or municipality to understand how to navigate the process or that would outline the criteria for a successful petition for additional liquor licenses. Further, there is no centralized, searchable record of past and pending liquor license home rule petitions, their outcomes, and the reasons for approval, denial, or amendment.135 The absence of published criteria and accessible records is examined further in Finding 5. A Revere municipal employee called the process clumsy—anything that moves through the Legislature takes a long time, and each municipality must draft its own request, secure local votes, and work through its delegation: “Everybody sort of seems to have to reinvent the wheel.”136
A recurring theme appearing in survey and interview responses is the lengthiness of the process and the negative economic impact of delays on the prospective licensee. On the municipal side, a petition must be drafted, authorized by the local governing body, and filed—steps that can take months or years, irrespective of the municipality’s form of government.137 The legislative side is more consistent—consistently long. Once the petition reaches Beacon Hill, there is no statutory obligation for the Legislature to act and no deadline for action.138 Committee and floor action can add months to the process.139 Progress depends heavily on the municipality’s administrative capacity and the willingness of the municipality’s legislative delegation to champion the petition.
Example timelines range from approximately six months to multiple years: Fairhaven’s 2024 single-license petition moved from filing to enactment in about 6 months;140 Montague’s 2015–2016 single-license petition took about 10 months;141 and Boston’s 2023–2024 multi-license package was enacted roughly 18 months after the underlying petition received local approval.142 Watertown submitted its petition to its delegation on May 11, 2015, and the Governor signed the resulting act on April 8, 2016—roughly eleven months, during which the municipality made repeated trips to the State House to lobby individual committee chairs.143 Municipalities reporting total durations most often described as about a year: Milford, “4 months to close to a year”; Avon, “approximately one year”; Chelmsford, “about a year”; Northampton, “close to a year, 9–12 months.”144
Home rule timelines are often incompatible with how restaurants finance, lease, and launch. Representative McKenna described commercial reality: An applicant needs “a little bit of legislative know-how, and patience and the ability to tell your financing, ‘we’ve got to wait 18 months for this bill to pass before we can sell a drink.’”145 Of the process itself, he said, “the bureaucratic process is not quick. It’s not nimble.”146 Prospective licensees do not sign leases, raise capital, or hire staff members on legislative calendars. The delay is financial, as well as administrative: A prospective licensee holding real estate, financing, and labor commitments during a yearlong wait absorbs those costs without being able to serve alcohol.
Interviewees also described a subtler concern with how the relief provided via home rule petition is often designed. Special legislation frequently ties additional licenses to a specific corridor, parcel, or development concept. Representative McKenna explained the legislative rationale: Petitions tied to an identified business and location look more reasonable and are easier to advance, because the Legislature does not like to hand a municipality a stack of unused authority that it can keep in a drawer, and lawmakers want to know who is applying, where the license would be used, and what kind of establishment is involved.147 The practice is visible in the special legislation resulting from home rule petitions: Chapter 142 of the Acts of 2016 confined Somerville’s special legislation licenses to designated Transformative and Enhancement Areas, and Chapter 202 of the Acts of 2024 tied Boston’s special legislation licenses to specified ZIP codes and neighborhoods.148 Municipal officials worry that such licenses can prove unusable if the underlying project fails to materialize or demand settles elsewhere in the municipality—authorized on paper, but not deployable where live demand exists. An example is seen in Tyngsborough where a municipal official reported the receipt of three special legislation licenses in 2024, which were restricted to a largely built-out corridor but remain unissued because no applicant has come forward for the designated location.149
A lack of publicly available information, combined with politically mediated inputs and restricted outputs, is what interviewees most often have in mind when they describe the home rule pathway as opaque. A lack of rules and criteria produces a system in which local officials and legislators have wide latitude over which requests advance and for whom. Given the opacity of the home rule petition process, outcomes turn heavily on relationships and on access to people who already understand how the process works: legislative staff, committee counsel, former officials, and licensing attorneys.
The home rule petition process is relationship-dependent.
Interviewees consistently described the home rule petition process as governed less by transparent rules than by personal relationships, committee preferences, and political bargaining. Success can depend on relationships among prospective licensees, municipal leaders, and legislative delegations.150 Success can also depend on views on license expansion and the preferences and priorities of legislative leaders and committees reviewing the petition—none of which appear in any written criteria available to applicants.
An example of unexplained disparate treatment of requests is illustrated by Tyngsborough’s petition for three unrestricted licenses in 2024, which stalled.151 As reported by a municipal official, “Town Meeting approved a home rule petition granting three (3) additional all alcohol on-premises licenses. The home rule petition, which passed unanimously, did not restrict the licenses to specific locations. Twice previously, the State Legislature approved similar language.”152 With respect to the 2024 petition, however, the Joint Committee on Consumer Protection and Professional Licensure required restricting the licenses to specific areas in order to advance the legislation to a hearing.153 The town ultimately accepted three location-restricted licenses, even though the town’s counsel and committee staff members agreed that the law does not require such a condition.154
A Revere municipal employee noted that “Home rule petitions are a clumsy and time-consuming tool. Most home rule petitions are generated by politicians for political reasons, which are not always consonant with fairness or equity. Those people most in need of fairness and equity are probably not even aware that a home rule petition is an option.”155 Representative McKenna explained that outcomes often turn, not on demonstrated demand, but on whether a municipality has calibrated its request to what committee leadership will accept—a pattern of strategic under-asking that advantages municipalities and legislative delegations with longer-standing relationships on Beacon Hill.156
In his words, “whether intentional or not, the House Committee on Consumer Protection maintains an outsized influence over this marketplace, and it feels as though there is an unwillingness to surrender that authority.”157
Special legislation licenses authorized under home rule are concentrated in wealthier municipalities with more resources.
The home rule pathway requires municipalities to draft a petition, move it through local approval, and follow it at the State House across a legislative session. Given the complexity and lack of standardized procedural guidance available to the public, this process advantages well-resourced municipalities.
In interviews, respondents described the challenges faced by under-resourced municipalities. A municipal employee from Revere described running a one-person office and explained that many municipalities appear to rely on a single staff member for liquor licensing.158 A Lawrence employee described the administrative capacity challenges: “We only have one licensing clerk, and that’s it,” for an office that handles more than 250 liquor license matters a year.159
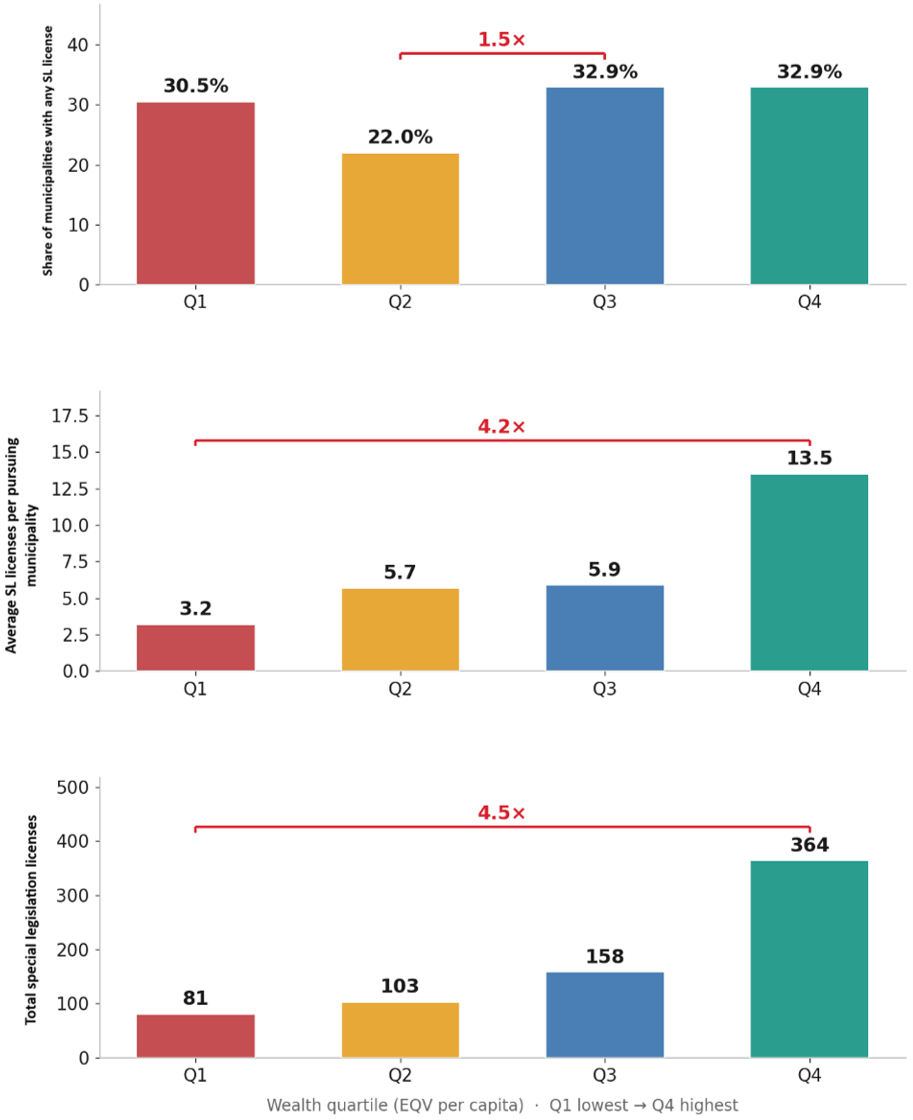
This study analyzed 706 special legislation on-premises licenses (8% of all on-premises licenses) obtained via home rule petition, held by 97 municipalities.160 Table 6 sorts those 97 municipalities into the wealth quartiles established based on the full 328‑municipality sample (302 quota and 26 local-control).161 The percentage of municipalities holding at least one special legislation license in each wealth quartile is broadly similar. For example, the Q1 wealth quartile contains 25 municipalities holding at least one special legislation license (30.5% of the 82 total municipalities in Q1), compared to the Q4 wealth quartile, which contains 27 municipalities holding at least one special legislation license (32.9% of the 82 total municipalities in Q4).
What differs sharply is the number of special legislation licenses obtained: an average of 3.2 per municipality in the lowest wealth quartile (Q1), rising to 13.5 in the highest (Q4).
See the last two columns of Table 6 on the next page.
Table 6. Special Legislation Licenses by Wealth Quartile162
| Wealth Quartile | EQV per Capita Range | Percentage of Municipalities with Special Legislation Licenses | Number of Municipalities with Special Legislation Licenses | Total Special Legislation Licenses | Licenses per Municipality163 |
|---|---|---|---|---|---|
| Q1 (Lowest) | $76,427–$177,434 | 30.5% | 25 | 81 | 3.2 |
| Q2 | $177,435–$231,944 | 22.0% | 18 | 103 | 5.7 |
| Q3 | $231,945–$328,158 | 32.9% | 27 | 158 | 5.9 |
| Q4 (Highest) | $328,159–$2,837,676 | 32.9% | 27 | 364 | 13.5 |
Table 6 shows that municipalities across the wealth scale turn to home rule petitions at roughly the same rate, but wealthier municipalities come away with far more licenses. Within the municipalities analyzed, the highest wealth quartile (Q4) holds 364 special legislation licenses (52% of the sample total) while Q1 municipalities hold only 81 (11%). Several factors could contribute to the gap in acquiring special legislation licenses: Wealthier municipalities tend to have more administrative capacity, economic development, and legal staff members; resources to support larger-scale development projects that increase demand for licenses; and continuity of institutional knowledge and established relationships with industry insiders that make it easier to advance larger licensing requests.164 Whatever the factor, the process results in wealthier municipalities obtaining more special legislation licenses.
Figure 22 below plots three dimensions of the special legislation liquor licensing by wealth quartile: the number of municipalities pursuing home rule in each wealth quartile, the average number of licenses obtained per pursuing municipality, and the total number of licenses by wealth quartile.
Figure 22. Special Legislation and Wealth—Three Dimensions*
* In two of these three charts, SL in the y-axis title represents special legislation.
Municipalities in the sample pursue special legislation at a similar rate, but the volume of licenses acquired climbs steeply across the wealth quartiles. The lowest wealth municipalities (Q1) that pursued special legislation secured, on average, 3.2 licenses each (81 total); Q2 municipalities averaged 5.7 (103 total); and Q3 averaged 5.9 (158 total). In comparison, the highest wealth municipalities (Q4) averaged 13.5 licenses each (364 total)—more than four times (322%) the average number of special legislation licenses secured by Q1 municipalities.165 Wealth correlates with how many special legislation licenses a municipality secures when it pursues special legislation.
The result is that some municipalities, especially those needing relief, but least equipped to pursue that relief, face compounding disadvantages: They lack available licenses to spur economic growth, the businesses to generate revenue that fund municipal services, and the capacity to mount a sustained home rule effort.
| Date published: | October 13, 2026 |
|---|